当前位置:网站首页>(subplots用法)matplotlib如何绘制多个子图(轴域)
(subplots用法)matplotlib如何绘制多个子图(轴域)
2022-07-03 05:07:00 【音程】
import matplotlib.pyplot as plt
#准备数据。
x=np.arange(3)
y1=np.random.rand((3))
y2=np.random.rand((3))
粗略
#得到绘图区以及子图。
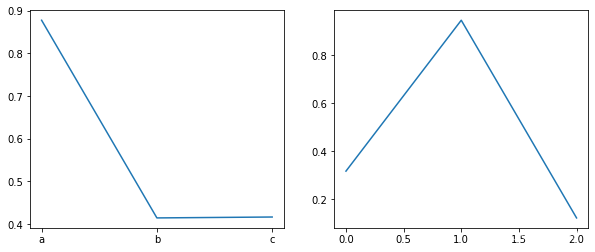
fig,(ax1,ax2)=plt.subplots(1,2,figsize=(10,4))#指定绘图区为(10,4),并且一行两列,默认两列各占一半,即(5,4)(5,4)
ax1.plot(x,y1)
ax2.plot(x,y2)

精细
1.刻度
子图的刻度和plt的那个刻度用法不一样。
后者是:
plt.xticks(x,label)#就可以在x的位置处填写label值。
但是子图的用法是:
ax1.set_xticks(x)#在x的位置处标记数字。
ax1.set_xticklabels(label)#在x处标记标签。
效果如下:
#得到绘图区以及子图。
fig,(ax1,ax2)=plt.subplots(1,2,figsize=(10,4))#指定绘图区为(10,4),并且一行两列,默认两列各占一半,即(5,4)(5,4)
ax1.plot(x,y1)
ax2.plot(x,y2)

ax1.set_xticks(x)#在x的位置处标记数字。
# ax1.set_xticklabels(label)#在x处标记标签。

#得到绘图区以及子图。
fig,(ax1,ax2)=plt.subplots(1,2,figsize=(10,4))#指定绘图区为(10,4),并且一行两列,默认两列各占一半,即(5,4)(5,4)
ax1.plot(x,y1)
ax2.plot(x,y2)

ax1.set_xticks(x)#在x的位置处标记数字。
label=["a","b","c"]
ax1.set_xticklabels(label)#在x处标记标签。
2.大小
现在我们可以看到,我们上面设置整个绘图区是(10,4),然后默认就是各自一半,那么如何精细控制每一个子图的大小呢?
#得到绘图区以及子图。
fig,(ax1,ax2)=plt.subplots(1,2,figsize=(10,4))#指定绘图区为(10,4),并且一行两列,默认两列各占一半,即(5,4)(5,4)
ax1.plot(x,y1)
ax2.plot(x,y2)

ax1.set_position((0.1,0.1,0.8,0.8))#将ax1的左下角放在绘图区的0.1,0.1位置处(0.1指代的是绘图区的10%的意思)。ax1的左下角放置好了之后,宽为80%,高为80%。注意,此时ax1的右上角的位置是0.9,0.9。
ax2.set_position((0.9,0.9,0.1,0.1))#所以这里从0.9开始,否则会重叠。然后只占比0.1,刚好用完绘图区。

可以看到,一个大,一个小。
绝招
其实如果你有时间的话,子图(轴域)这个类官方文档中有写,axes其他属性可以见https://matplotlib.org/stable/api/axes_api.html?highlight=axes#module-matplotlib.axes。
总之,要有类的思想,axes(子图)是在figure(画布)中的。那为什么一到画图就很难学了呢?我的感觉是官方为了方便大家,构建子图,我们根本不是去构造axes类,而是调用五花八门的方法,例如上面的
subplots()
这样子,很容易上手,方便新手,但是却大大损害了进阶人士的理解,哎。
按照类的思想,我们应该如下:
先创建绘图区对象figure,然后将这个对象以及子图位置传入axes类的构造函数中,得到子图。然后绘制。
边栏推荐
- Hire cashier (differential constraint)
- 2022-02-11 daily clock in: problem fine brush
- Esp32-c3 learning and testing WiFi (II. Wi Fi distribution - smart_config mode and BlueIf mode)
- [batch dos-cmd command - summary and summary] - CMD window setting and operation command - close CMD window and exit CMD environment (exit, exit /b, goto: EOF)
- [set theory] relationship properties (common relationship properties | relationship properties examples | relationship operation properties)
- Market status and development prospect prediction of the global autonomous hybrid underwater glider industry in 2022
- [Yu Yue education] basic reference materials of interchangeability and measurement technology of Zhongyuan Institute of Technology
- Webapidom get page elements
- 动态规划——相关概念,(数塔问题)
- Web APIs exclusivity
猜你喜欢
Mobile terminal - uniapp development record (public request encapsulation)

Without 50W bride price, my girlfriend was forcibly dragged away. What should I do
![[research materials] 2022q1 game preferred casual game distribution circular - Download attached](/img/13/5a67c5d08131745759fdc70a71cf0f.jpg)
[research materials] 2022q1 game preferred casual game distribution circular - Download attached
Silent authorization login and registration of wechat applet
Detailed explanation of the output end (head) of yolov5 | CSDN creation punch in

Learn to use the idea breakpoint debugging tool
Basic knowledge of reflection (detailed explanation)

M1 Pro install redis
2022-02-11 daily clock in: problem fine brush
![[set theory] relation properties (reflexivity | reflexivity theorem | reflexivity | reflexivity theorem | example)](/img/2a/362f3b0491f721d89336d4f468c9dd.jpg)
[set theory] relation properties (reflexivity | reflexivity theorem | reflexivity | reflexivity theorem | example)
随机推荐
document. The problem of missing parameters of referer is solved
Silent authorization login and registration of wechat applet
1106 lowest price in supply chain (25 points)
1099 build a binary search tree (30 points)
Wechat applet distance and map
[set theory] relation properties (transitivity | transitivity examples | transitivity related theorems)
1094 the largest generation (25 points)
What is UUID
Botu uses peek and poke for IO mapping
BIO、NIO、AIO区别
Appium 1.22. L'Inspecteur appium après la version X doit être installé séparément
Gbase8s unique index and non unique index
Market status and development prospect prediction of global neutral silicone sealant industry in 2022
2022-02-11 daily clock in: problem fine brush
Current market situation and development prospect forecast of global UV sensitive resin 3D printer industry in 2022
Shuttle + Alluxio 加速内存Shuffle起飞
Shallow and first code
Esp32-c3 learning and testing WiFi (II. Wi Fi distribution - smart_config mode and BlueIf mode)
Thesis reading_ Tsinghua Ernie
es7创建索引容易犯的错误