当前位置:网站首页>WPF common function integration
WPF common function integration
2022-07-26 14:37:00 【Xiongsiyu】
Catalog
WPF introduction -1 Row and column
WPF introduction -3 Scroll bar
WPF obtain DataGrid Control to select the value of a column in the current row
WPF introduction -1 Row and column
Official information of Microsoft : Click the jump
Partition modules
Yes web Anyone with front-end development experience knows , Before making the interface , The interface is usually divided into several modules , Then refine the interface layout inside the module , therefore , Study WPF Before , You must understand this first
The front-end code
<Window x:Class="WpfApplication1.MainWindow"
        xmlns="http://schemas.microsoft.com/winfx/2006/xaml/presentation"
        xmlns:x="http://schemas.microsoft.com/winfx/2006/xaml"
        Title="MainWindow" Height="350" Width="800"  Loaded="Window_Loaded">
    <Grid>
        <Grid.RowDefinitions>
            <RowDefinition Height="50"/>
            <RowDefinition Height="50"/>
            <RowDefinition Height="50"/>
            <RowDefinition Height="50"/>
            <RowDefinition Height="*"/>
        </Grid.RowDefinitions>
        <!-- first line -->
        <Grid Grid.Row="0" Background="AntiqueWhite">
        </Grid>
        <!-- The second line -->
        <Grid Grid.Row="1" Background="Aqua">
            <Grid.ColumnDefinitions>
                <ColumnDefinition Width="300"/>
                <ColumnDefinition Width="300"/>
            </Grid.ColumnDefinitions>
            <!-- First column -->
            <Grid Grid.Column="0" Background="BlueViolet">
            </Grid>
            <!-- Second column -->
            <Grid Grid.Column="1" Background="CadetBlue">
            </Grid>
        </Grid>
        <!-- The third line -->
        <Grid Grid.Row="2" Background="Aquamarine">
            <Grid.ColumnDefinitions>
                <ColumnDefinition Width="300"/>
                <ColumnDefinition Width="300"/>
            </Grid.ColumnDefinitions>
        </Grid>
        <!-- In the fourth row -->
        <Grid Grid.Row="3" Background="Bisque">
            <Grid.ColumnDefinitions>
                <ColumnDefinition Width="300"/>
                <ColumnDefinition Width="300"/>
            </Grid.ColumnDefinitions>
        </Grid>
        <!-- The fifth row -->
        <Grid Grid.Row="4" Background="Blue">
        </Grid>
    </Grid>
</Window>
effect :

<RowDefinition Height="50"/> Here is to add a line
Below Grid.Row="0" Indicates the layout of the first row , And what components are added inside
<Grid Grid.Row="0" Background="AntiqueWhite"></Grid>
Two more columns are added to the second row ColumnDefinition, The writing method is the same as adding lines
WPF introduction -2 tab
1. The main page
<Window x:Class="WpfApp1.MainWindow"
        xmlns="http://schemas.microsoft.com/winfx/2006/xaml/presentation"
        xmlns:x="http://schemas.microsoft.com/winfx/2006/xaml"
        xmlns:d="http://schemas.microsoft.com/expression/blend/2008"
        xmlns:mc="http://schemas.openxmlformats.org/markup-compatibility/2006"
        xmlns:local="clr-namespace:WpfApp1"
        mc:Ignorable="d"
        Title="MainWindow" Height="450" Width="800">
    <Grid>
        <TabControl>
            <TabItem Header="Page1">
                <Frame Source="/WpfApp1;component/Pages/Page1.xaml"/>
            </TabItem>
            <TabItem Header="Page2">
                <Frame Source="/WpfApp1;component/Pages/Page2.xaml"/>
            </TabItem>
            <TabItem Header="Page3">
                <Frame Source="/WpfApp1;component/Pages/Page3.xaml"/>
            </TabItem>
            <TabItem Header="Page4">
                <Frame Source="/WpfApp1;component/Test/Page4.xaml"/>
            </TabItem>
        </TabControl>
    </Grid>
</Window>
<Frame Source="/WpfApp1;component/Pages/Page1.xaml"/> Refers to the page to which the current option points
2. Add page
Right click on the folder
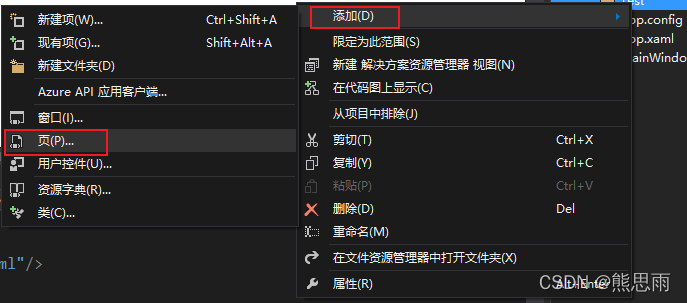
When I'm done , as follows

In this study , You can add some buttons to the page ,lable And so on. , Used to distinguish .
In fact, it is also possible to use an ordinary interface here , Just minimize the size of the form , Maximize and close buttons Get rid of , as follows

3. function

WPF introduction -3 Scroll bar
main interface
Use Microsoft's official case , Don't write any code
<Window x:Class="WpfApplication1.MainWindow"
        xmlns="http://schemas.microsoft.com/winfx/2006/xaml/presentation"
        xmlns:x="http://schemas.microsoft.com/winfx/2006/xaml"
        Title="MainWindow" Height="350" Width="800" Loaded="Window_Loaded">
    <Grid>
        <ScrollViewer HorizontalScrollBarVisibility="Auto">
            <StackPanel VerticalAlignment="Top" HorizontalAlignment="Left">
                <TextBlock TextWrapping="Wrap" Margin="0,0,0,20"> Please adjust  Rectangle  Component size , The size of the form has been exceeded , Scroll bars will appear </TextBlock>
                <Rectangle Fill="Green" Width="1500" Height="500"></Rectangle>
            </StackPanel>
        </ScrollViewer>
    </Grid>
</Window>
ScrollViewer: Scroll bar assembly
StackPanel: Stack panel , Child element out of range , Be hidden , Can be nested
Rectangle: Draw a rectangle
function

WPF LiveCharts Charting
One 、 New projects
Create a new project LiveChartBindingDemo, With this name , You can copy and paste the following code completely and directly , It doesn't have to be modified .
introduce LiveCharts plug-in unit , stay NuGet Just install the platform by yourself , My version is 0.9.7, The editor used for the picture is Visual Studio 2013

Two 、 Code
1.MainWindowViewModel
using LiveCharts;
using LiveCharts.Wpf;
using System;
using System.Collections.Generic;

namespace LiveChartBindingDemo
{
    public class MainWindowViewModel
    {
        SeriesCollection lineSeriesCollection = new SeriesCollection();
        SeriesCollection colunmSeriesCollection = new SeriesCollection();
        SeriesCollection pieSeriesCollection = new SeriesCollection();
        List<string> _lineXLabels = new List<string>();
        List<string> _columnXLabels = new List<string>();

        public MainWindowViewModel()
        {
            GetLineSeriesData();
            GetColunmSeriesData();
            GetPieSeriesData();
        }

        #region  attribute
        /// <summary>
        ///  Line graph set
        /// </summary>
        public SeriesCollection LineSeriesCollection
        {
            get
            {
                return lineSeriesCollection;
            }

            set
            {
                lineSeriesCollection = value;
            }
        }

        /// <summary>
        ///  Histogram set
        /// </summary>
        public SeriesCollection ColunmSeriesCollection
        {
            get
            {
                return colunmSeriesCollection;
            }

            set
            {
                colunmSeriesCollection = value;
            }
        }

        /// <summary>
        ///  Pie chart set
        /// </summary>
        public SeriesCollection PieSeriesCollection
        {
            get
            {
                return pieSeriesCollection;
            }

            set
            {
                pieSeriesCollection = value;
            }
        }

        /// <summary>
        ///  Broken line diagram X coordinate
        /// </summary>
        public List<string> LineXLabels
        {
            get
            {
                return _lineXLabels;
            }

            set
            {
                _lineXLabels = value;
            }
        }

        /// <summary>
        ///  Histogram X coordinate
        /// </summary>
        public List<string> ColumnXLabels
        {
            get
            {
                return _columnXLabels;
            }

            set
            {
                _columnXLabels = value;
            }
        }
        #endregion

        #region  Method
        void GetLineSeriesData()
        {
            List<string> titles = new List<string> { " Apple ", " Banana ", " pear " };
            List<List<double>> values = new List<List<double>>
            {
                new List<double> { 30, 40, 60 },
                new List<double> { 20, 10, 50 },
                new List<double> { 10, 50, 30 }
            };
            List<string> _dates = new List<string>();
            _dates = GetCurrentMonthDates();
            for (int i = 0; i < titles.Count; i++)
            {
                LineSeries lineseries = new LineSeries();
                lineseries.DataLabels = true;
                lineseries.Title = titles[i];
                lineseries.Values = new ChartValues<double>(values[i]);
                LineXLabels.Add(_dates[i]);
                LineSeriesCollection.Add(lineseries);
            }
        }

        void GetColunmSeriesData()
        {
            List<string> titles = new List<string> { "Edge", "Chrome", "Firefox", "Other" };
            List<double> columnValues = new List<double> { 10, 70, 15, 5 };

            for (int i = 0; i < titles.Count; i++)
            {
                ColumnXLabels.Add(titles[i]);
            }
            ColumnSeries colunmseries = new ColumnSeries();
            colunmseries.DataLabels = true;
            colunmseries.Title = " Share ";
            colunmseries.Values = new ChartValues<double>(columnValues);
            ColunmSeriesCollection.Add(colunmseries);

        }

        void GetPieSeriesData()
        {
            List<string> titles = new List<string> { "C#", "Java", "Python" };
            List<double> pieValues = new List<double> { 60, 30, 10 };
            ChartValues<double> chartvalue = new ChartValues<double>();
            for (int i = 0; i < titles.Count; i++)
            {
                chartvalue = new ChartValues<double>();
                chartvalue.Add(pieValues[i]);
                PieSeries series = new PieSeries();
                series.DataLabels = true;
                series.Title = titles[i];
                series.Values = chartvalue;
                PieSeriesCollection.Add(series);
            }
        }

        void ThreeColumnData()
        {
            List<string> titles = new List<string> { " Apple ", " Banana ", " pear " };
            // Three columns of sample data
            List<List<double>> threeColunmValues = new List<List<double>>
            {
                new List<double> { 30, 40, 60 },
                new List<double> { 20, 10, 50 },
                new List<double> { 10, 50, 30 }
            };


            for (int i = 0; i < titles.Count; i++)
            {
                ColumnSeries colunmseries = new ColumnSeries();
                colunmseries.DataLabels = true;
                colunmseries.Title = titles[i];
                colunmseries.Values = new ChartValues<double>(threeColunmValues[i]);

                ColunmSeriesCollection.Add(colunmseries);
            }
        }

        /// <summary>
        ///  Get the daily date of the current month
        /// </summary>
        /// <returns> Date set </returns>
        List<string> GetCurrentMonthDates()
        {
            List<string> dates = new List<string>();
            DateTime dt = DateTime.Now;
            int year = dt.Year;
            int mouth = dt.Month;
            int days = DateTime.DaysInMonth(year, mouth);
            // The first day of this month
            DateTime dt_First = dt.AddDays(1 - (dt.Day));
            dates.Add(String.Format("{0:d}", dt_First.Date));

            for (int i = 1; i < days; i++)
            {
                DateTime temp = dt_First.AddDays(i);
                dates.Add(String.Format("{0:d}", temp.Date));
            }
            return dates;
        }
        #endregion
    }
}
2. The front-end code MainWindow.xaml
<Window x:Class="LiveChartBindingDemo.MainWindow"
        xmlns="http://schemas.microsoft.com/winfx/2006/xaml/presentation"
        xmlns:x="http://schemas.microsoft.com/winfx/2006/xaml"
        xmlns:d="http://schemas.microsoft.com/expression/blend/2008"
        xmlns:lvc="clr-namespace:LiveCharts.Wpf;assembly=LiveCharts.Wpf"
        xmlns:mc="http://schemas.openxmlformats.org/markup-compatibility/2006"
        xmlns:local="clr-namespace:LiveChartBindingDemo"
        mc:Ignorable="d"
        Title="MainWindow"
        Height="720"
        Width="1280">
    <UniformGrid>
        <lvc:CartesianChart Series="{Binding LineSeriesCollection}"
                            LegendLocation="Right">
            <lvc:CartesianChart.AxisY>
                <lvc:Axis></lvc:Axis>
            </lvc:CartesianChart.AxisY>
            <lvc:CartesianChart.AxisX>
                <lvc:Axis Labels="{Binding LineXLabels}"></lvc:Axis>
            </lvc:CartesianChart.AxisX>
        </lvc:CartesianChart>
        <lvc:CartesianChart Series="{Binding ColunmSeriesCollection}" LegendLocation="Right">
            <lvc:CartesianChart.AxisX>
                <lvc:Axis Labels="{Binding ColumnXLabels}"></lvc:Axis>
            </lvc:CartesianChart.AxisX>
            <lvc:CartesianChart.AxisY>
                <lvc:Axis></lvc:Axis>
            </lvc:CartesianChart.AxisY>
        </lvc:CartesianChart>
        <lvc:PieChart LegendLocation="Bottom" Series="{Binding PieSeriesCollection}" DataClick="Chart_OnDataClick" Hoverable="False">
            <lvc:PieChart.DataTooltip>
                <lvc:DefaultTooltip BulletSize="10"></lvc:DefaultTooltip>
            </lvc:PieChart.DataTooltip>
        </lvc:PieChart>
    </UniformGrid>
</Window>
3. Back end code MainWindow.xaml.cs
using LiveCharts;
using LiveCharts.Wpf;
using System.Windows;

namespace LiveChartBindingDemo
{
    /// <summary>
    /// MainWindow.xaml  Interaction logic of
    /// </summary>
    public partial class MainWindow : Window
    {
        MainWindowViewModel mainWindowViewModel = new MainWindowViewModel();
        public MainWindow()
        {
            InitializeComponent();
            this.DataContext = mainWindowViewModel;
        }

        private void Chart_OnDataClick(object sender, ChartPoint chartpoint)
        {
            var chart = (LiveCharts.Wpf.PieChart)chartpoint.ChartView;

            //clear selected slice.
            foreach (PieSeries series in chart.Series)
                series.PushOut = 0;

            var selectedSeries = (PieSeries)chartpoint.SeriesView;
            selectedSeries.PushOut = 8;
        }
    }
}
The above is all the complete code , The project structure is as follows :

3、 ... and 、 function

WPF Percentage calculator
Designed a gadget , The interface is as follows :

xaml
<Window x:Class="WpfApplication1.MainWindow"
        xmlns="http://schemas.microsoft.com/winfx/2006/xaml/presentation"
        xmlns:x="http://schemas.microsoft.com/winfx/2006/xaml"
        ResizeMode ="CanMinimize" WindowStartupLocation="CenterScreen"
        Title=" Percentage calculator " Height="200" Width="300" Loaded="Window_Loaded">
    <Grid>
        <Label Content=" Total quantity :" HorizontalAlignment="Left" VerticalAlignment="Top" Margin="36,21,0,0" />
        <Label Content=" Your number :" HorizontalAlignment="Left" VerticalAlignment="Top" Margin="36,51,0,0"/>
        <Label Content=" result :" HorizontalAlignment="Left" VerticalAlignment="Top" Margin="36,76,0,0"/>
        <Label Name="Label_Result" Content="" HorizontalAlignment="Left" VerticalAlignment="Top" Margin="110,76,0,0"/>

        <TextBox Name="TextBox_AllNum" Width="120" Height="23" Margin="110,25,0,0" TextWrapping="Wrap" Text="" HorizontalAlignment="Left" VerticalAlignment="Top" />
        <TextBox Name="TextBox_YourNum" Width="120" Height="23" Margin="110,53,0,0" TextWrapping="Wrap" Text="" HorizontalAlignment="Left" VerticalAlignment="Top" />

        <Button Content=" Calculation " HorizontalAlignment="Left" Margin="110,127,0,0" VerticalAlignment="Top" Width="75" Click="Button_Click"/>
    </Grid>
</Window>
Background code :
using System;
using System.Windows;

namespace WpfApplication1
{
    public partial class MainWindow : Window
    {
        public MainWindow()
        {
            InitializeComponent();
        }

        private void Window_Loaded(object sender, RoutedEventArgs e)
        {

        }

        private void Button_Click(object sender, RoutedEventArgs e)
        {
            // Total quantity
            string s_allNum = this.TextBox_AllNum.Text;
            // Your number
            string s_yourNum = this.TextBox_YourNum.Text;

            if (string.IsNullOrEmpty(s_allNum) || string.IsNullOrEmpty(s_yourNum))
            {
                MessageBox.Show(" Input box cannot be empty ");
                return;
            }

            double allNum = 0;
            double yourNum = 0;

            if (!double.TryParse(s_allNum, out allNum))
            {
                MessageBox.Show(" Total quantity   Input box   The input is not a number ");
                return;
            }
            if (!double.TryParse(s_yourNum, out yourNum))
            {
                MessageBox.Show(" Your number   Input box   The input is not a number ");
                return;
            }
            if (yourNum > allNum)
            {
                MessageBox.Show(" Your number   Not greater than   total ");
                return;
            }

            double result = (yourNum / allNum) * 100;
            this.Label_Result.Content = string.Format("{0}%", Math.Round(result, 4));
        }
    }
}
effect :


WPF obtain DataGrid Control to select the value of a column in the current row
Start with a new project , The interface is as follows :

This project is based on the example I wrote before , link : Click the jump
In fact, the original project can also be ignored , How to get DataGrid The value in is the focus of this chapter ,
stay DataGrid Add a button below , The click event of the button is as follows :
private void Button_Click(object sender, RoutedEventArgs e)
{
    string value = GetSelectedRow(MyDataGrid, "Name");
    Console.WriteLine(value);
}
Encapsulate and get the click line , The method of the value of a column
        /// <summary>
        ///  obtain DataGrid Control to select the value of a column in the current row
        /// </summary>
        /// <param name="dataGrid">DataGrid Control </param>
        /// <param name="readName"> Column name </param>
        /// <returns> Select the value of the row and column , If the parameter is wrong, it returns null</returns>
        public string GetSelectedRow(DataGrid dataGrid, string readName)
        {
            if (dataGrid == null)
            {
                Console.WriteLine("dataGrid  Can't be empty ");
                return null;
            }
            if (string.IsNullOrEmpty(readName))
            {
                Console.WriteLine("readName Can't be empty ");
                return null;
            }
            if (dataGrid.SelectedItems.Count == 0)
            {
                Console.WriteLine("dataGrid No data selected ");
                return null;
            }
            if (dataGrid.SelectedItems.Count > 1)
            {
                Console.WriteLine(" Selecting multiple rows is not supported , Read a data ");
                return null;
            }

            DataRowView dataRowView = dataGrid.SelectedCells[0].Item as DataRowView;
            if (dataRowView.Row.Table.Columns.Contains(readName))
                return dataRowView[readName].ToString();

            return null;
        }
function :
Select a row first , Then click test , Successfully obtained value


end
边栏推荐
- VBA 上传图片
- C语言贪吃蛇-链表和指针练习
- 【使用工具条绘图】
- 我的创作纪念日-从心出发
- Fill in the questionnaire and receive the prize | we sincerely invite you to fill in the Google play academy activity survey questionnaire
- unity透明通道的小技巧
- 31. Opinion-based Relational Pivoting forCross-domain Aspect Term Extraction 阅读笔记
- [ostep] 04 virtualized CPU - process scheduling strategy
- GOM login configuration free version generate graphic tutorial
- 嵌入式开发:调试嵌入式软件的技巧
猜你喜欢


![[untitled]](/img/50/7aa01f1d8657700a11cbc26290804a.png)


![[draw with toolbar]](/img/d4/9cb06599f9a8fe5f8149cb7870c103.png)

随机推荐
unity透明通道的小技巧
【文件上传漏洞-06】分布式配置文件攻击实验—以upload-labs-4为例
Basic knowledge about memory chips
Mysql-03 database operation
智能家居行业发展,密切关注边缘计算和小程序容器技术
Unity学习笔记–无限地图
Joint entity and event extraction model based on multi task deep learning
手持振弦采集仪VH03各种接口使用说明
What is the problem of the time series database that has been developed for 5 years?
Job 7.25 sorting and searching
敏捷开发与DevOps的对比
Research on prediction of user churn in online health community based on user portrait
【使用工具条绘图】
[1.2. return and risk of investment]
Use of URL download resources
As the "first city" in Central China, Changsha's "talent attraction" has changed from competition to leadership
在检测分割中一些轻量级网络模型(自己学习的笔记分享)
Matlab solution of [analysis of variance]
低功耗多通道WFAS1431无线数据采集采发仪使用流程说明
注解和反射