当前位置:网站首页>Introduction and use of ftrace tool
Introduction and use of ftrace tool
2022-07-03 00:28:00 【Crazy banana Nicky】
1. What is? ftrace
ftrace (Function Tracer) It's a response to Linux Kernel trace framework . Although its original name was Function Tracer, From ftrace The ability to record information about various function calls executed by the kernel runtime , but ftrace The tracking capability of the covers a wider range of internal kernel operations .
Through various tracking plug-ins ,ftrace You can target different static trace points , For example, scheduling events 、 interrupt 、 Memory mapping I/O、CPU Power state transition , And operations related to file systems and virtualization . Besides , You can also dynamically track kernel function calls , By using globs Limit it to a subset of functions , You can also generate call graphs and provide stack usage reports . meanwhile ,ftrace It can be used to measure Linux Various delays in the kernel , For example, disable interrupt or preemptive time .
By enabling CONFIG_FUNCTION_TRACER Kernel configuration options , You can build an enabled ftrace Of Linux kernel . And ftrace The entire runtime interaction of is through inclusion in a specific mount debugfs Read and write virtual files in the file system ; therefore ,ftrace No special user space utilities are required to operate . However , There are additional user space utilities , Record for data 、 Analysis and visualization provide more advanced functions ;
2. Kernel configuration
because ftrace Tools have been ported to Linux In the system , The kernel is generally configured by default debugfs, But what is needed tracer By default, the tracker may only provide nop, If you need anything else tracer , Need extra configuration menuconfig, As shown below :
I only configure function , function_graph these two items. tracer For testing . If you need something else tracer, It can be researched and used by yourself .
Kernel Hacking -> Compile-time checks and compiler options —>Debug Filesystem
Kernel Hacking -> Tracers:
Kernel Function Tracer (FUNCTION_TRACER)
Enable/disable ftrace dynamically (DYNAMIC_FTRACE)
Trace max stack (STACK_TRACER)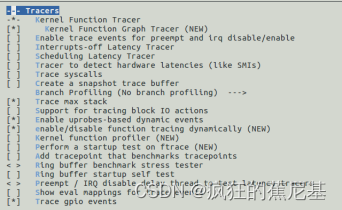
3.ftrace Use
3.1trancer Command sequence
When the kernel starts , Users can access /sys/kernel/debug/tracing Directory view currently supported trance command .README The document provides a brief instruction , It shows ftrace Sequence of operation commands .
[email protected]:/sys/kernel/debug/tracing# ls
available_events            printk_formats       stack_trace_filter
available_filter_functions  README               timestamp_mode
available_tracers           saved_cmdlines       trace
buffer_size_kb              saved_cmdlines_size  trace_clock
buffer_total_size_kb        saved_tgids          trace_marker
current_tracer              set_event            trace_marker_raw
dyn_ftrace_total_info       set_event_pid        trace_options
enabled_functions           set_ftrace_filter    trace_pipe
events                      set_ftrace_notrace   tracing_cpumask
free_buffer                 set_ftrace_pid       tracing_on
instances                   set_graph_function   tracing_thresh
max_graph_depth             set_graph_notrace    uprobe_events
options                     stack_max_size       uprobe_profile
per_cpu                     stack_trace
- current_tracer:
This is used to set or display the configured current tracer. - available_tracers:
Used to obtain the support provided by the kernel tracer. Here's a list of tracer You can echo their names to current_tracer To configure the . - tracing_on:
This will set or display whether to enable pair tracer Write ring buffer . In this document echo 0 To disable tracer, or echo 1 Enabled tracer. Be careful , This only disables writing to the circular buffer , Tracking overhead can still occur . - trace:
This document will be tracked in a good way for people log preserved . Be careful , In the reading ( open ) When this document , Tracing is temporarily disabled .
-set_ftrace_filter/set_ftrace_notrace:
When compiling the kernel, dynamic ftrace ( Choose CONFIG_DYNAMIC_FTRACE Options ) After use . The former is used to display the functions specified to be tracked , The latter has the opposite effect , Used to specify functions that are not tracked . If a function name appears in both files , Then the execution status of this function will not Tracked . These files also support simple forms of expressions with wildcards , In this way, multiple objective functions can be specified at one time with one expression ; The specific use will be described in subsequent articles . Be careful , To write these two texts The function name of the file must be in the file available_filter_functions see . By default, all kernel functions can be tracked , file set_ftrace_notrace The value of is null . - set_graph_function:
Set the function to clearly show the call relationship , The displayed information structure is similar to C The language code , In this way, it will be more intuitive when analyzing the kernel operation process . In the use of function_graph When using the tracker ; The default is to generate call relation sequence for all functions , You can write this file to specify the functions that need special attention . - Other:
The above only introduces a few commonly used tracer, You can view relevant documents if necessary .
- ftrace User manual :kernel-src/Documentation/trace/ftrace.txt
- ftrace Design document :kernel-src/Documentation/trace/ftrace-design.txt
3.2 View currently supported tracer
[email protected]:/sys/kernel/debug/tracing# cat available_tracers
hwlt blk mmiotrace function_graph wakeup_dl wakeup_rt wakeup function nop
3.3 see / Set the currently running tracer
[email protected]:/sys/kernel/debug/tracing# cat current_tracer
nop

 The default is nop, We can set the currently running tracer. as follows
[email protected]:/sys/kernel/debug/tracing# cat current_tracer
nop
[email protected]:/sys/kernel/debug/tracing# echo function_graph > current_tracer
[email protected]:/sys/kernel/debug/tracing# cat current_tracer
function_graph
3.4 Turn on / close tracer
sysctl kernel.ftrace_enabled=1
sysctl kernel.ftrace_enabled=0
3.5 Pause / continue
echo 0 > tracing_on
echo 1 > tracing_on
3.6 View the collected results
cat trace
Here, the results will be displayed to the terminal in the form of text , I personally like to save it to a file by redirection , Then use other editing tools , Such as UE To view the analysis .
cat trace >> MyTracer.txt
It can also be in the form of pipes , Or regular expressions to capture the information you want .
4. Call the instance
Before using , First the debugfs Mount to the user folder .
mkdir /debug
mount -t debugfs nodev /debug
cd /debug/tracing
4.1 function
**# View currently supported traceer
# cat available_tracers
hwlat blk mmiotrace function_graph wakeup_dl wakeup_rt wakeup function nop
#  Displays the currently running tracer
# cat current_tracer
nop
#  Set up tracer:function
# echo function > current_tracer
# cat current_tracer
function
#  stop it tacer  And empty trace
# echo 0 > tracing_on
# echo 0 > trace
# cat trace


 tracer: function

 entries-in-buffer/entries-written: 0/0   #P:2

                              _-----=> irqs-off
                             / _----=> need-resched
                            | / _---=> hardirq/softirq
                            || / _--=> preempt-depth
                            ||| /     delay
           TASK-PID   CPU# |||| TIMESTAMP FUNCTION
              | |       |   ||||       |         |
#  perform tracer, Capture sleep  Kernel action ,  stop it tracer
# echo 1 > tracing_on && sleep 1 && echo 0 > tracing_on
#  Read trcer,  Show only before 50 That's ok
# cat trace | head -n 50
 tracer: function

#entries-in-buffer/entries-written: 84487/98407 #P:2

                              _-----=> irqs-off
                             / _----=> need-resched
                            | / _---=> hardirq/softirq
                            || / _--=> preempt-depth
                            ||| /     delay
           TASK-PID   CPU# |||| TIMESTAMP FUNCTION
              | |       |   ||||       |         |
          <idle>-0     [000] dn..  6715.669331: smp_reschedule_interrupt <-reschedule_interrupt
          <idle>-0     [000] dn..  6715.669331: scheduler_ipi <-smp_reschedule_interrupt
          <idle>-0     [000] .N..  6715.669332: rcu_idle_exit <-do_idle
          <idle>-0     [000] dN..  6715.669332: rcu_dynticks_eqs_exit <-rcu_idle_exit
          <idle>-0     [000] .N..  6715.669332: arch_cpu_idle_exit <-do_idle
          <idle>-0     [000] .N..  6715.669332: tick_nohz_idle_exit <-do_idle
          <idle>-0     [000] dN..  6715.669332: ktime_get <-tick_nohz_idle_exit
          <idle>-0     [000] dN..  6715.669333: update_ts_time_stats <-tick_nohz_idle_exit
          <idle>-0     [000] dN..  6715.669333: nr_iowait_cpu <-update_ts_time_stats
          <idle>-0     [000] dN..  6715.669333: cpu_load_update_nohz_stop <-tick_nohz_idle_exit
          <idle>-0     [000] dN..  6715.669333: _raw_spin_lock <-cpu_load_update_nohz_stop
          <idle>-0     [000] dN..  6715.669333: update_rq_clock <-cpu_load_update_nohz_stop
          <idle>-0     [000] dN..  6715.669333: cpu_load_update <-cpu_load_update_nohz_stop
          <idle>-0     [000] dN..  6715.669333: sched_avg_update <-cpu_load_update
          <idle>-0     [000] dN..  6715.669334: timer_clear_idle <-tick_nohz_idle_exit
          <idle>-0     [000] dN..  6715.669334: calc_load_nohz_stop <-tick_nohz_idle_exit
          <idle>-0     [000] dN..  6715.669334: hrtimer_cancel <-tick_nohz_idle_exit
          <idle>-0     [000] dN..  6715.669334: hrtimer_try_to_cancel <-hrtimer_cancel
          <idle>-0     [000] dN..  6715.669334: hrtimer_active <-hrtimer_try_to_cancel
          <idle>-0     [000] dN..  6715.669334: lock_hrtimer_base.isra.19 <-hrtimer_try_to_cancel
          <idle>-0     [000] dN..  6715.669334: _raw_spin_lock_irqsave <-lock_hrtimer_base.isra.19
          <idle>-0     [000] dN..  6715.669334: __remove_hrtimer <-hrtimer_try_to_cancel
          <idle>-0     [000] dN..  6715.669335: _raw_spin_unlock_irqrestore <-hrtimer_try_to_cancel
          <idle>-0     [000] dN..  6715.669335: hrtimer_forward <-tick_nohz_idle_exit
          <idle>-0     [000] dN..  6715.669335: hrtimer_start_range_ns <-tick_nohz_idle_exit
          <idle>-0     [000] dN..  6715.669335: lock_hrtimer_base.isra.19 <-hrtimer_start_range_ns
          <idle>-0     [000] dN..  6715.669335: _raw_spin_lock_irqsave <-lock_hrtimer_base.isra.19
          <idle>-0     [000] dN..  6715.669335: enqueue_hrtimer <-hrtimer_start_range_ns
          <idle>-0     [000] dN..  6715.669336: tick_program_event <-hrtimer_start_range_ns
          <idle>-0     [000] dN..  6715.669336: clockevents_program_event <-tick_program_event
          <idle>-0     [000] dN..  6715.669336: ktime_get <-clockevents_program_event
          <idle>-0     [000] dN..  6715.669336: lapic_next_deadline <-clockevents_program_event
          <idle>-0     [000] dN..  6715.669339: _raw_spin_unlock_irqrestore <-hrtimer_start_range_ns
          <idle>-0     [000] dN..  6715.669339: account_idle_ticks <-tick_nohz_idle_exit
          <idle>-0     [000] .N..  6715.669339: sched_ttwu_pending <-do_idle
          <idle>-0     [000] .N..  6715.669340: schedule_idle <-do_idle
          <idle>-0     [000] dN..  6715.669340: rcu_note_context_switch <-__schedule
          <idle>-0     [000] dN..  6715.669340: _raw_spin_lock <-__schedule
          <idle>-0     [000] dN..  6715.669340: update_rq_clock <-__schedule
# **
trace The format of the information given in the document is very clear .
First , Field “tracer:” Gives the name of the tracker currently used , Here for function tracker . Then there is the format of tracking information record ,TASK The field corresponds to the name of the task ,PID Field gives the process of the task ID, Field CPU# Represents the function that runs the tracked function CPU Number , Here you can see idle The process is running in 0 Number CPU On , Its process ID yes 0 ; Field TIMESTAMP It's a time stamp , The format for “.”, Indicates the timestamp corresponding to the execution of the function ;FUNCTION One column gives the tracked function , The caller of the function passes the symbol “<-” mark , In this way, we can observe the function call relationship .
4.2 function_graph
# echo function_graph > current_tracer
# echo 0 > tracing_on && echo 0 > trace
# echo 1 > tracing_on && sleep 1 && echo 0 > tracing_on
# cat trace | head -n 500
 tracer: function_graph

 CPU  DURATION                  FUNCTION CALLS
 |     |   |                     |   |   |   |
   0)               |                      _cond_resched() {

   0)   0.118 us    |                        rcu_all_qs();
   0)   0.488 us    |                      }
   0)   0.707 us    |                    } /* wait_for_unix_gc */
   0)               |                    security_socket_getpeersec_dgram() {

   0)   0.104 us    |                      apparmor_socket_getpeersec_dgram();
   0)   0.351 us    |                    }
   0)               |                    sock_alloc_send_pskb() {

   0)               |                      alloc_skb_with_frags() {

   0)               |                        __alloc_skb() {

   0)               |                          kmem_cache_alloc_node() {

   0)               |                            _cond_resched() {

   0)   0.110 us    |                              rcu_all_qs();
   0)   0.314 us    |                            }
   0)   0.537 us    |                          }
   0)               |                          __kmalloc_reserve.isra.43() {

   0)               |                            __kmalloc_node_track_caller() {

   0)   0.108 us    |                              kmalloc_slab();
   0)               |                              _cond_resched() {

   0)   0.119 us    |                                rcu_all_qs();
   0)   0.325 us    |                              }
   0)   0.766 us    |                            }
   0)   0.980 us    |                          }
   0)   0.119 us    |                          ksize();
   0)   2.068 us    |                        }
   0)   2.302 us    |                      }
   0)   0.118 us    |                      skb_set_owner_w();
   0)   2.734 us    |                    }
   0)   0.110 us    |                    unix_scm_to_skb();
   0)   0.105 us    |                    skb_put();
   0)               |                    skb_copy_datagram_from_iter() {

   0)               |                      __check_object_size() {

   0)   0.114 us    |                        check_stack_object();
   0)   0.126 us    |                        __virt_addr_valid();
   0)   0.122 us    |                        __check_heap_object();
   0)   0.783 us    |                      }
   0)   1.040 us    |                    }
   0)   0.109 us    |                    _raw_spin_lock();
   0)   0.116 us    |                    maybe_add_creds();
   0)               |                    skb_queue_tail() {

   0)   0.118 us    |                      _raw_spin_lock_irqsave();
   0)   0.125 us    |                      _raw_spin_unlock_irqrestore();
   0)   0.563 us    |                    }
   0)               |                    sock_def_readable() {

   0)               |                      __wake_up_sync_key() {

   0)               |                        __wake_up_common_lock() {

   0)   0.118 us    |                          _raw_spin_lock_irqsave();
   0)               |                          __wake_up_common() {

   0)               |                            ep_poll_callback() {

   0)   0.113 us    |                              _raw_spin_lock_irqsave();
   0)   0.118 us    |                              _raw_spin_unlock_irqrestore();
   0)   0.601 us    |                            }
   0)   0.856 us    |                          }
   0)   0.118 us    |                          _raw_spin_unlock_irqrestore();
   0)   1.521 us    |                        }
   0)   1.723 us    |                      }
   0)   1.935 us    |                    }
   0)   0.110 us    |                    put_pid();
   0)   9.173 us    |                  } /* unix_stream_sendmsg */
   0) + 10.304 us   |                } /* sock_sendmsg */
   0) + 10.535 us   |              } /* sock_write_iter */
   0) + 10.781 us   |            } /* do_iter_readv_writev */
   0)   0.110 us    |            __fsnotify_parent();
   0)   0.122 us    |            fsnotify();
   0) + 12.727 us   |          } /* do_iter_write */
   0)   0.112 us    |          kfree();
   0) + 13.928 us   |        } /* vfs_writev */
   0)   0.105 us    |        fput();
   0) + 15.088 us   |      } /* do_writev */
   0) + 15.307 us   |    } /* SyS_writev */
   0) + 15.573 us   |  } /* do_syscall_64 */
   0)               |  do_syscall_64() {

   0)               |    SyS_poll() {

   0)               |      do_sys_poll() {

   0)               |        __check_object_size() {

   0)   0.122 us    |          check_stack_object();
   0)   0.344 us    |        }
   0)               |        __fdget() {

   0)               |          __fget_light() {

   0)   0.117 us    |            __fget();
   0)   0.330 us    |          }
   0)   0.547 us    |        }
   0)               |        sock_poll() {

   0)               |          unix_poll() {

   0)               |            __pollwait() {

   0)               |              add_wait_queue() {

   0)   0.117 us    |                _raw_spin_lock_irqsave();
   0)   0.114 us    |                _raw_spin_unlock_irqrestore();
   0)   0.779 us    |              }
   0)   0.989 us    |            }
   0)   1.230 us    |          }
   0)   1.475 us    |        }
   0)   0.111 us    |        fput();
   0)               |        poll_schedule_timeout() {

   0)               |          schedule_hrtimeout_range() {

   0)               |            schedule_hrtimeout_range_clock() {

   0)               |              schedule() {

   0)   0.107 us    |                rcu_note_context_switch();
   0)   0.110 us    |                _raw_spin_lock();
   0)   0.121 us    |                update_rq_clock();
   0)               |                deactivate_task() {

   0)               |                  dequeue_task_fair() {

   0)               |                    dequeue_entity() {

   0)               |                      update_curr() {

   0)   0.119 us    |                        update_min_vruntime();
   0)   0.140 us    |                        cpuacct_charge();
   0)   0.617 us    |                      }
   0)   0.108 us    |                      __update_load_avg_se.isra.38();
   0)   0.114 us    |                      clear_buddies();
   0)   0.111 us    |                      account_entity_dequeue();
   0)   0.107 us    |                      update_cfs_group();
   0)   0.108 us    |                      update_min_vruntime();
   0)   1.930 us    |                    }
   0)               |                    dequeue_entity() {

   0)               |                      update_curr() {

   0)   0.123 us    |                        __calc_delta();
   0)   0.110 us    |                        update_min_vruntime();
   0)   0.581 us    |                      }
   0)   0.129 us    |                      __update_load_avg_se.isra.38();
   0)   0.108 us    |                      clear_buddies();
   0)   0.119 us    |                      account_entity_dequeue();
   0)               |                      update_cfs_group() {

   0)   0.128 us    |                        reweight_entity();
   0)   0.375 us    |                      }
   0)   0.119 us    |                      update_min_vruntime();
   0)   2.189 us    |                    }
   0)   0.111 us    |                    hrtick_update();
   0)   4.680 us    |                  }
   0)   4.934 us    |                }
   0)               |                pick_next_task_fair() {

   0)   0.110 us    |                  check_cfs_rq_runtime();
   0)               |                  pick_next_entity() {

   0)   0.109 us    |                    clear_buddies();
   0)   0.345 us    |                  }
   0)               |                  pick_next_entity() {

   0)   0.110 us    |                    clear_buddies();
   0)   0.315 us    |                  }
   0)               |                  put_prev_entity() {

   0)   0.108 us    |                    check_cfs_rq_runtime();
   0)   0.332 us    |                  }
   0)               |                  set_next_entity() {

   0)   0.126 us    |                    __update_load_avg_se.isra.38();
   0)   0.349 us    |                  }
   0)               |                  put_prev_entity() {

   0)   0.104 us    |                    check_cfs_rq_runtime();
   0)   0.319 us    |                  }
   0)               |                  set_next_entity() {

   0)   0.131 us    |                    __update_load_avg_se.isra.38();
   0)   0.353 us    |                  }
   0)   3.002 us    |                }
   0)               |                switch_mm_irqs_off() {

   0)   0.207 us    |                  load_new_mm_cr3();
   0)   0.500 us    |                }
function_graph Tracker can provide similar C Function call relationship information of code . By writing files set_graph_function You can display the functions that specify the call relationship to be generated , By default, function call diagrams will be generated for all traceable kernel functions .
The function graph tracker tracks the entry and exit of functions , This is useful for tracking its execution time . Function execution time exceeds 10 Microsecond marks a “+” Number , exceed 1000 Microseconds are marked as a “!” Number . adopt echo function_graph > current_tracer You can enable the function graph tracker .
CPU Field gives the CPU Number , In this case, all are 1 Number CPU.
DURATION Field gives the length of time the function is executed , With us In units of .
FUNCTION CALLS Then the called function is given , And shows the call process . Be careful ,
For functions that do not call other functions , The corresponding line is “;” ending , And the corresponding DURATION Field gives its run time .
For functions that call other functions , Then in its “}” The corresponding line gives the run time , This time is an accumulated value , Including the execution time of the function called internally .DURATION The duration given by the field is not accurate , It also includes execution ftrace The time spent by your own code , Therefore, the result of accumulating the internal function duration in the example will be inconsistent with the execution duration of the corresponding peripheral calling function ; However, through this field, you can still roughly understand the running cost of the function in time .
4. Script example
#!/bin/sh
dir=/sys/kernel/debug/tracing
sysctl kernel.ftrace_enabled=1
echo function_graph > ${
    dir}/current_tracer
echo 1 > ${
    dir}/tracing_on#
sleep 1
echo 0 > ${
    dir}/tracing_on
cat ${
    dir}/trace > ~/mytrace.txt
#!/bin/sh
echo "format nvme..."
mkfs.fat /dev/nvme0n1p1
echo "mount nvme to /mnt"
mount /dev/nvme0n1p1 /mnt/
dir=/sys/kernel/debug/tracing
sysctl kernel.ftrace_enabled=1
echo "SSD Write..."
echo nop > ${
    dir}/current_tracer
echo function_graph > ${
    dir}/current_tracer
echo 1 > ${
    dir}/tracing_on
dd if=/dev/zero of=/mnt/zero.bin bs=1M count=512
echo 0 > ${
    dir}/tracing_on
cat ${
    dir}/trace > ~/SSD_Write.txt
echo "SSD Read..."
echo nop > ${
    dir}/current_tracer
echo function_graph > ${
    dir}/current_tracer
echo 1 > ${
    dir}/tracing_on
dd if=/mnt/zero.bin of=/dev/null bs=1M count=512
echo 0 > ${
    dir}/tracing_on
cat ${
    dir}/trace > ~/SSD_Read.txt
边栏推荐
猜你喜欢
MySQL 23 classic interview hanging interviewer

What are the projects of metauniverse and what are the companies of metauniverse

MySQL advanced learning notes (III)
![[shutter] Introduction to the official example of shutter Gallery (learning example | email application | retail application | wealth management application | travel application | news application | a](/img/f2/f3b8899aa774dd32006c5928d370f1.gif)
[shutter] Introduction to the official example of shutter Gallery (learning example | email application | retail application | wealth management application | travel application | news application | a
![[MCU project training] eight way answering machine](/img/a3/6a50619cd16269bf485a4a273677aa.jpg)
[MCU project training] eight way answering machine

JS interviewer wants to know how much you understand call, apply, bind no regrets series
CMake基本使用

Where can I find the English literature of the thesis (except HowNet)?

Automated defect analysis in electron microscopic images-论文阅读笔记

What are the recommended thesis translation software?
随机推荐
Multiprocess programming (II): Pipeline
Confluence的PDF导出中文文档异常显示问题解决
NC24325 [USACO 2012 Mar S]Flowerpot
百数不断创新,打造自由的低代码办公工具
【Pulsar文档】概念和架构/Concepts and Architecture
详解用OpenCV的轮廓检测函数findContours()得到的轮廓拓扑结构(hiararchy)矩阵的意义、以及怎样用轮廓拓扑结构矩阵绘制轮廓拓扑结构图
Where can I check the foreign literature of economics?
程序分析与优化 - 9 附录 XLA的缓冲区指派
setInterval定时器在ie不生效原因之一:回调的是箭头函数
Andorid gets the system title bar height
JVM foundation review
[MCU project training] eight way answering machine
可下载《2022年中国数字化办公市场研究报告》详解1768亿元市场
ftrace工具的介绍及使用
Architecture: load balancing
Bypass AV with golang
Interface difference test - diffy tool
130 pages of PPT from the brick boss introduces the new features of Apache spark 3.2 & 3.3 in depth
Xcode real machine debugging
[shutter] open the third-party shutter project