当前位置:网站首页>Data analysis method - user group analysis
Data analysis method - user group analysis
2022-06-23 01:51:00 【LS96】
List of articles
Data analysis method —— User group analysis
Summary of content
One 、 Introduction to group analysis method
- Group analysis method is to group data according to a certain characteristic , A method of drawing conclusions and providing guidance through group comparison .
- The user data is classified according to gender characteristics , It can be divided into boys and girls ; Take the user registration time as the feature , It can be grouped according to the month of registration .
- Group analysis is often used to analyze user retention / Loss problem , Or the overdue repayment of users in the financial industry , Analysis methods such as grouping by month are common .
- The main purpose of group analysis is to analyze the changes of similar groups over time , The core is comparison 、 Analyze the behavior differences of users in different time groups in the same period , Also called simultaneous group analysis .
- The three steps of group analysis :
1、 The data packet
2、 Hypothesis testing , Put forward hypothesis to test the problem
3、 Correlation analysis , Compare the correlations between different assumptions
This blog follows step one ( The data packet ) Mainly
Two 、 Background and purpose of the project
An e-commerce platform has a batch of user consumption records , Including user information , Order information , amount of money , Order date, etc . It is hoped that through group analysis , View the change trend of user retention rate , Analyze the behavior differences of users in different time groups in the same period , It plays a basic role in formulating strategies for different user groups .
3、 ... and 、python Practice
(1) Data import
- Normal operation : Import the required pandas、numpy library , This data is stored in the database , Then import sqlalchemy library
- Use sqlalchemy library , Call database
import pandas as pd
import numpy as np
import sqlalchemy

#  Reading data
engine = sqlalchemy.create_engine('mysql+pymysql://**********@localhost:3306/froghd')
sql_cmd = "select * from groups_data"
#  perform sql sentence , get data
df = pd.read_sql(sql=sql_cmd, con=engine)
# Data presentation
df.head()
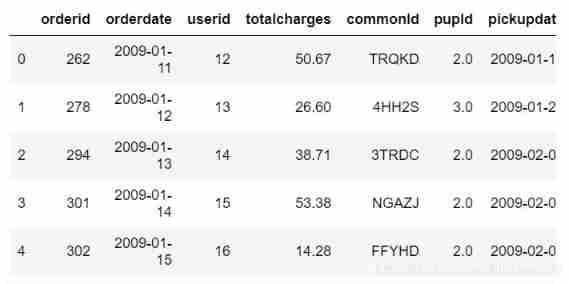
- The data set is shown in the figure above , We mainly count the number of users (userid)、 Order quantity (orderid)、 Order date (orderdate) And the total amount (totalcharges)
(2) Data processing
- One
- This group analysis is mainly aimed at analyzing the retention rate of new users every month , Therefore, it is necessary to sort out data on a monthly basis .
- The date of the order in the data set is accurate to , We need to omit it to month ( Use here strftime Function to extract )
#  Generate a new field , User order month
df["orderperiod"] = df.orderdate.apply(lambda x:x.strftime("%Y-%m"))

- Two
- Group analysis is for months , First, determine the number of new users per month , Therefore, it is necessary to determine the earliest purchase date for each user , It's also Logo of user group
- The subsequent analysis is aimed at time series , Therefore, the date of each user's purchase also needs
- Therefore, the user information (userid) It is better to base the grouping on , But if directly groupby Words , The rest of the information needs to be aggregated , If the consumption date is aggregated, there will be missing dates , Therefore, we can't directly treat userid grouping
- The main idea is to splice the earliest consumption date of each user with each consumption date
- (1) Consider putting user information (userid) As an index , Then group the indexes
- (2) Add a list of users' earliest purchase date ( User groups )
- (3) Then reset the index column , Split the grouped data into independent data
#  Set up userid Index
df.set_index("userid",inplace=True)
#  there level=0 Indicates that the first level index is userid, And after each grouping, many dataframe
#  According to the earliest period of each user's order , Generate user groups
df["cohortgroup"]=df.groupby(level=0)["orderdate"].min().apply(lambda x:x.strftime("%Y-%m"))
df.reset_index(inplace=True)
df.head()
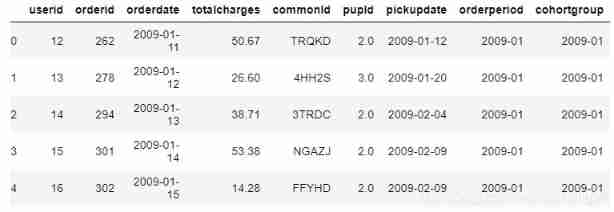
- 3、 ... and
- It can be seen that each user has two times behind each consumption record , One is the time of this consumption , One is the user's earliest consumption time
- And then to user groups and dissipate Grouping
#  Group by user group and month fields
grouped = df.groupby(["cohortgroup","orderperiod"])
#  Find the number of users in each month under each user group 、 Order quantity 、 Purchase amount
cohorts = grouped.agg({
    "userid":pd.Series.nunique,
                      "orderid":pd.Series.nunique,
                      "totalcharges":np.sum})
#  rename
cohorts.rename(columns={
    "userid":"totalusers",
                       "orderid":"totalorders"},inplace=True)
cohorts.head()

Four
Then you can simplify the label of the data in each user group
For each user group groupby And label
#  Change the date field for each group to continue buying
def cohort_period(df):
    #  Number the date of first purchase , The second purchase is 2, The third purchase is 3
    df["cohortperiod"] = np.arange(len(df)) + 1

    return df

#  Pay attention to is apply What comes in later is one by one dataframe
cohorts = cohorts.groupby(level=0).apply(cohort_period)

cohorts.head()

(3) Calculation of user group retention rate
- The key to the calculation of user group retention rate : Initial number per user group , Divide the retention of each subsequent month by the initial quantity , Its The initial number is the user group ( The earliest date ) Number of users in the same group as the date in the group
- One
- The index can be simplified for the previously simplified data
- adjustment groupby Index method :
-(1) First the groupby Data disassembly group DataFrame data ; utilize reset_index
-(2) Reset the index column ; utilize set_index([ ])
#  Get the number of users in each group
#  Reset index
cohorts.reset_index(inplace=True)
cohorts.set_index(["cohortgroup","cohortperiod"],inplace=True)
cohorts.head()

- Two
- Count the initial number of each user group : User groups ( The earliest date ) Number of users in the same group as the date in the group
#  Get the number of users in each group , Is the amount of user data on the first day , Used as the denominator of retention rate
cohort_group_size = cohorts["totalusers"].groupby(level=0).first()
cohort_group_size.head()

- 3、 ... and
- Adjust the data ,groupby The data is rotated , Time series along the horizontal axis , utilize unstack function
#  Calculate the retention for each group
# unstack  It's a index Turn into column
#unstack() The sequence number in indicates the column name to be displayed
cohorts["totalusers"].unstack(0).head()

- Four
- Retention rate calculation , Divided by the initial quantity of each month
#  Calculation retention
user_retention = cohorts["totalusers"].unstack(0).divide(cohort_group_size,axis=1)
user_retention.head()
# The writing here is not unique , have access to apply collocation lambda function

(4) Visualization of user group retention
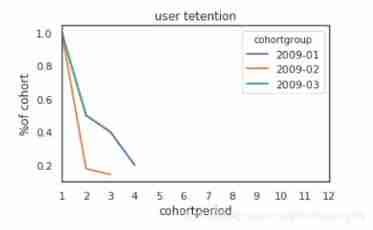
- One
- Broken line diagram
#  Line chart shows
import matplotlib.pyplot as plt
import matplotlib as mpl
pd.set_option("max_columns",50)
mpl.rcParams["lines.linewidth"] = 2
%matplotlib inline
user_retention[["2009-01","2009-02","2009-03"]].plot(figsize=(5,3))
plt.title("user tetention")
plt.xticks(np.arange(1,12.1,1))
plt.xlim(1,12)
plt.ylabel("%of cohort")
- Two
- Heat map
#  Heat map display
import seaborn as sns
sns.set(style="white")

plt.figure(figsize=(8,4))
plt.title("co:user retention")
sns.heatmap(user_retention.T,mask=user_retention.T.isnull(),annot=True,fmt=".0%")

Four 、 summary
This time, the main purpose is to understand the user group analysis method and python Code operation is the main thing
User group analysis is to group and summarize users according to certain characteristics , Some of them are similar Data boxes ; but The main application is to analyze the time series of users in different periods , Observe the retention rate , New and old user behavior, etc
python Implement user group analysis in time , We need to pay attention to the following points :
(1) The foothold is the user , Users need to be groupby, But to Integrate the earliest consumption date and each consumption date of each user , Therefore, it is necessary to User information is set to index So as to ensure the integrity of the data ;
(2) After integrating the two times of each user , Just started user groups ( Same starting time ) analysis , On the groupby grouping ;
(3) The denominator of retention rate is for each group Starting number of users = User information at the same timeAfter the user group is broken down , Lay a foundation for subsequent hypothesis testing and correlation analysis .
边栏推荐
- 3D printing microstructure
- 1. Mx6u bare metal program (4) - GPIO module
- Bubble sort - double for implementation
- [cmake command notes]target_ compile_ options
- Debian10 configuring rsyslog+loganalyzer log server
- Pat class A - 1013 battle over cities
- Unit of RMB in words
- [learning notes] roll back Mo team
- [ZOJ] P3228 Searching the String
- Operator part
猜你喜欢

Rebirth -- millimeter wave radar and some things I have to say

Ch340 and PL2303 installation (with link)

1. Mx6u bare metal program (4) - GPIO module

4. functions and inline functions with default values for formal parameters

1. Mx6u bare metal program (6) - timer

Arm assembly syntax

The devil cold rice # 099 the devil said to travel to the West; The nature of the boss; Answer the midlife crisis again; Specialty selection

Array part

Charles garbled code problem solving

8. destruct, construct, deep copy, shallow copy, assignment operator overload
随机推荐
7.new, delete, OOP, this pointer
Vscade personalization: let a cute girl knock the code with you
Binary String
Detailed explanation of clip attribute parameters
1. introduction to MySQL database connection pool function technology points
Three methods for solving Fibonacci sequence feibonacci (seeking rabbit) - program design
Initial structure
"Initial C language" (Part 1)
SYSTEMd summary
Browser independent way to detect when image has been loaded
"First knowledge of C language" (Part 3)
[hdu] P7079 Pty loves lines
Pat class a 1016 phone bills (time difference)
165. cat climbing
Epoll introduction and principle explanation
3D printing microstructure
[hdu] P6964 I love counting
SQL programming task03 job - more complex query
Analysis of current mainstream video coding technology | community essay solicitation
Questions not written in the monthly contest