当前位置:网站首页>[Brillouin phenomenon] Study on simultaneous measurement system of Brillouin temperature and strain distribution in optical fiber
[Brillouin phenomenon] Study on simultaneous measurement system of Brillouin temperature and strain distribution in optical fiber
2022-06-29 03:51:00 【FPGA and MATLAB】
1. Software version
matlab2013b
2. System Overview
The research status of Brillouin distributed optical fiber sensing technology is summarized in detail ; The dependence of Brillouin frequency shift and intensity on fiber temperature and strain is studied theoretically and experimentally ; A distributed Brillouin optical fiber sensing system with heterodyne detection is designed, which can measure temperature and strain simultaneously , Light emission to it 、 Light reception 、 Data processing and other subsystems are analyzed in detail ; With electro-optic modulator (EOM) Based on the performance test , The system parameters are optimized , Realized 10 km Optical fiber 、10 m Measurement of optical time domain reflection waveform with spatial resolution ; The SNR of the designed system is deduced and calculated (SNR)、 Temperature and strain resolution 、 Dynamic range 、 Measurement time and other indicators ; Put forward the idea of Golay The idea of applying complementary sequences to Brillouin sensing systems , The simulation results show that , use Golay Complementary sequence driven EOM And correlation detection technology has greatly improved the signal-to-noise ratio and temperature and strain resolution of the system .
Brillouin scattering is a scattering phenomenon that occurs when light propagates in inhomogeneous media , Its frequency and intensity change with respect to the incident light , The variation of Brillouin scattering relative to the frequency of incident light is called Brillouin frequency shift . Brillouin frequency shift and intensity are related to sound velocity in optical fiber materials , The sound velocity will be affected by the thermo optic and elasto optic properties of optical fiber materials , The thermo optic effect and elasto optic effect in optical fiber are related to the refractive index of optical fiber material 、 Young's modulus 、 Poisson's ratio is related to density , Therefore, the change of temperature and strain in optical fiber will cause the change of Brillouin frequency shift and intensity . In this chapter, the refractive index of optical fiber materials is analyzed theoretically 、 Young's modulus 、 Poisson's ratio and density versus fiber temperature and strain , The dependence of Brillouin frequency shift and intensity on temperature and strain is studied theoretically and experimentally .
When the optical signal passes through the medium , Some of them will deviate from the original propagation direction and scatter into space . Scattered light at intensity 、 Direction 、 The polarization state and even the spectrum may be different from the incident light . The characteristics of light scattering and the composition of the medium 、 structure 、 There is a close relationship between the uniformity and the change of state . In a nutshell , The cause of light scattering can be regarded as the optical inhomogeneity or refractive index inhomogeneity of the medium , It makes the local area in the medium form the scattering center . There are many reasons for medium inhomogeneity , It can be divided into several scattering forms with different mechanisms . Brillouin scattering is caused by sound waves or acoustic subwaves . Raman scattering is caused by vibrational or optical acoustic wavelets inside molecules . The view of quantum theory shows that , Light scattering is composed of photons and microscopic particles ( atom 、 molecular 、 Electrons and phonons ) Caused by a collision , The result of the collision makes the incident photon scatter into a scattered photon with different energy or direction from the incident photon , Accordingly, the energy and momentum of micro particles change , And follow the law of conservation of energy and momentum .
3. Part of the source code
clc;
clear;
close all;
warning off;
% The relation between Brillouin frequency shift and temperature and strain is
%v0 : Incident light frequency
%lmdap : Wavelength of incident light in vacuum
%n(e,T) : Refractive index
%E(e,T) : Young's modulus
%k(e,T) : Poisson's ratio
%p(e,T) : Core density
%VB(e,T) = 2*v0*n(e,T) * sqrt( ((1-k(e,T))*(E(e,T)))/((1 + k(e,T))*(1-2*k(e,T))*(p(e,T))) )/lmdap;
To = 20;% initial temperature
T = [20:1:40];% Temperature variation range
lmdap = 1550;% Wavelength of incident light in vacuum
v0 = 9.853e8;% Incident light frequency
% According to the requirements of the paper , Simulation considering the case of no strain
% Define the variables
% Core density
p = zeros(1,length(T));
beta = zeros(1,length(T));
% Refractive index
n = zeros(1,length(T));
% Young's modulus
E = zeros(1,length(T));
% Poisson's ratio
k = zeros(1,length(T));
ind = 0;
for i = 1:length(T)
% Core density
% beta = (0.37 + 7.34*(T(i)-To)/10000)/1000000;
% p(i) = M/(pi*ro*ro*lo*(1+beta)^3);%ro Is the fiber radius ,lo Is the fiber length
p(i) = 2200.17 - 4.04*T(i)/1000;
% Refractive index
n(i) = 1.45 + 2.12*T(i)/100000;
% Young's modulus
E(i) = (7.25+1.35*T(i)/1000)*(10000000000);
% Poisson's ratio
k(i) = 0.17 + 4.515*T(i)/100000;
% Brillouin frequency shift
VB(i) = 2*v0*n(i) * sqrt( ((1-k(i))*(E(i)))/((1 + k(i))*(1-2*k(i))*(p(i))) )/lmdap;
end
% The above is the Brillouin frequency shift obtained from the Brillouin frequency shift formula
% The two methods are compared
figure;
subplot(221):plot(T,p,'b-*') ;title(' Core density - Temperature curve ');
subplot(222):plot(T,n,'b-*') ;title(' Refractive index - Temperature curve ');
subplot(223):plot(T,E,'b-*') ;title(' Young's modulus - Temperature curve ');
subplot(224):plot(T,k,'b-*') ;title(' Poisson's ratio - Temperature curve ');
figure;
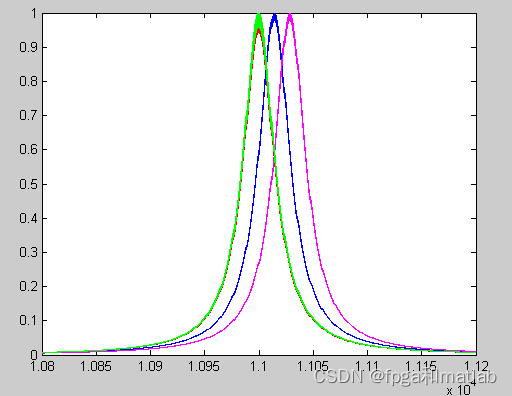
plot(T,VB,'b-*');title(' Brillouin frequency shift - Temperature curve ');
% The above simulation verifies the linear relationship between Brillouin frequency shift and temperature
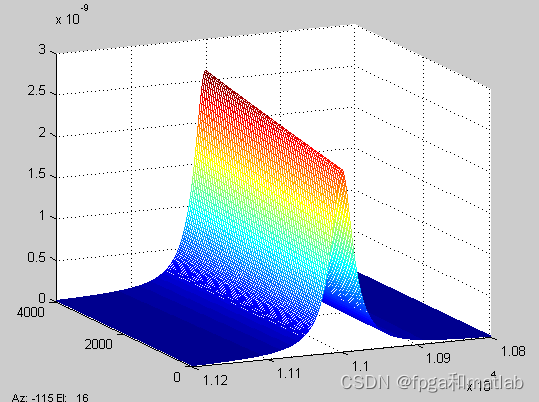
% According to the formula and calculation, the following VB Value to plot Brillouin frequency shift — temperature , distance 3D chart
% According to the formula and calculation, the following VB Value to plot Brillouin frequency shift — temperature , distance 3D chart
% According to the formula and calculation, the following VB Value to plot Brillouin frequency shift — temperature , distance 3D chart
% There will be , All parameters related to temperature change are calculated by formula
%%%%%%%%%%%%%%%%%%%%%%%% The following parameters are set as adjustable parameters %%%%%%%%%%%%%%%%%%%%%%%%%%%%%
To = 20; % initial temperature
dis = 0:50:4000;% Define the distance
T = 20*ones(1,length(dis));% Temperature variation range
if_change = 1;% Whether to set the mutation point
if if_change == 1
% Set the temperature better
s1 = 30;
e1 = 40;
s2 = 50;
e2 = 60;
T(s1:e1)= 30;
T(s2:e2)= 40;
else
T = T;
end
% Set the 3D display area
f = [10.8e9:1e6:11.2e9]/1e6;% Set the frequency range to be displayed , It can be set at will , In order to save computation, interpolation , Remove the frequency 1000000
%%%%%%%%%%%%%%%%%%%%%%%%%%%%%%%%%%%%%%%%%%%%%%%%%%%%%%%%%%%%%%%%%%%%%%%%%%%
% Core density
p = zeros(1,length(T));
beta = zeros(1,length(T));
% Refractive index
n = zeros(1,length(T));
% Young's modulus
E = zeros(1,length(T));
% Poisson's ratio
k = zeros(1,length(T));
ind = 0;
for i = 1:length(T)
% Core density
% beta = (0.37 + 7.34*(T(i)-To)/10000)/1000000;
% p(i) = M/(pi*ro*ro*lo*(1+beta)^3);%ro Is the fiber radius ,lo Is the fiber length
p(i) = 2200.17 - 4.04*T(i)/1000;
% Refractive index
n(i) = 1.45 + 2.12*T(i)/100000;
% Young's modulus
E(i) = (7.25+1.35*T(i)/1000)*(10000000000);
% Poisson's ratio
k(i) = 0.17 + 4.515*T(i)/100000;
% Brillouin frequency shift
VB2(i) = 2*v0*n(i) * sqrt( ((1-k(i))*(E(i)))/((1 + k(i))*(1-2*k(i))*(p(i))) )/lmdap;
end
% The Brillouin frequency shift with different transmission distance is obtained
% Set the 3D display area
f = [10.8e3:1:11.2e3];% Set the frequency range to be displayed , It can be set at will , In order to save computation, interpolation , Remove the frequency 1000000
% Find the abrupt change of temperature
A = 6.4e-11; % Sectional area
L = max(dis);% distance
Pcw0 = 4e-6; % Incident light power
a = 0.046e-3;% Critical pump power
g = 5e-11; % Brillouin gain peak
figure;
for i=1:length(T)
% Section 1
if if_change == 1
if i >= 1 & i <= s1 -1
d = dis(1:s1-1);
end
if i >= s1 & i <= e1
d = dis(s1:e1);
end
if i >= e1+1 & i <= s2-1
d = dis(e1+1:s2-1);
end
if i >= s2 & i<= e2
d = dis(s2:e2);
end
if i >= e2+1 & i<= length(T)
d = dis(e2+1:length(T));
end
else
d = dis;
end
[F,D] = meshgrid(f,d);
% The relation between Brillouin strength and temperature is :
Psp_L = (2.04 + 0.007*T(i))/1000000000;
P = Psp_L*exp(a*D).*exp(+(g/A)*Pcw0*(exp(-a*D)-exp(-a*L))/a);
fB = VB2(i)/(1e6);% Center frequency at normal temperature , According to the above set of formulas, we can get
fBi = 35;% bandwidth
Q = 1./(1+((F-fB)/(fBi/2)).^2);
I = P.*Q;
mesh(D,F,I);
hold on
shading interp;
alpha(0.75);
clear D F I d Psp_L P fB fBi Q
end
4. Simulation conclusion


Go through the above steps , The linear relationship between Brillouin frequency shift and temperature can be verified .
Other theories are basically the two papers you provided , So there is no further description here . here , We mainly derive and calculate the results of several parameters varying with temperature , Other parameters independent of the temperature are given directly .
When there is a temperature change , The simulation results are as follows :

When there is no temperature difference .
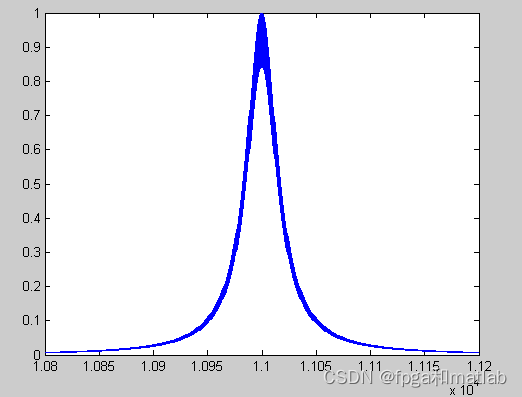
A24-2
边栏推荐
- Seura 2 test code summary
- An annotation elegant implementation of interface data desensitization
- The efficiency of 20 idea divine plug-ins has been increased by 30 times, and it is necessary to write code
- 基于xlsx的B+树索引实现
- [tcaplusdb knowledge base] view tcapdir directory server
- PHP实现 mqtt通信
- 谁家的加密密钥,写死在代码里?(说的就是你)
- MobileOne: 移动端仅需1ms的高性能骨干
- 88. (cesium chapter) cesium aggregation diagram
- [dynamic planning] change exchange
猜你喜欢

【TcaplusDB知识库】TcaplusDB-tcapsvrmgr工具介绍(一)

leetcode - 295. Median data flow
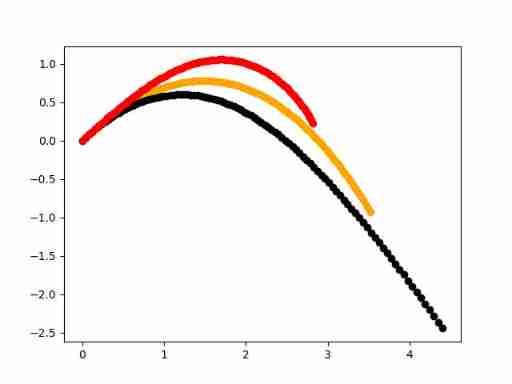
Influence of air resistance on the trajectory of table tennis

【TcaplusDB知识库】查看tcapdir目录服务器

leetcode:304. 2D area and retrieval - matrix immutable

Four distributed session solutions

Microsecond TCP timestamp

Common methods of JS date and time

Preliminary construction of SSM project environment

Whose encryption key is written in the code? (that's you)
随机推荐
leetcode:304. 2D area and retrieval - matrix immutable
An annotation elegant implementation of interface data desensitization
Mobileone: the mobile terminal only needs 1ms of high-performance backbone
【TcaplusDB知识库】修改业务修改集群cluster
leetcode:304. 二维区域和检索 - 矩阵不可变
Basic concepts of graph theory
Adelaidet (detectron2) & abcnet environment configuration
Draft competition process of Intelligent Vision Group
【TcaplusDB知识库】TcaplusDB-tcapsvrmgr工具介绍(一)
[tcapulusdb knowledge base] Introduction to tcapulusdb table data caching
[ruoyi] ztree initialization
seekbar 自定义图片上下左右显示不全 / bitmapToDrawable / bitmapToDrawable互转 / paddingStart/paddingEnd /thumbOffset
[Ubuntu] [MySQL] Ubuntu installs mysql, but the compilation error is mysql h: No such file or directory
20款IDEA 神级插件 效率提升 30 倍,写代码必备
高性能限流器 Guava RateLimiter
Data collection and management [3]
4种分布式session解决方案
Implementing mqtt communication with PHP
Open source demo| you draw and I guess -- make your life more interesting
凌晨三点学习的你,感到迷茫了吗?