Preface :
*️ <font color =black size=3> Author's brief introduction : A bowl of soybean paste *️ What brings happiness to everyone is aja me ! <font color =red size=3> 、 Shanglan village programming expert !<font color =grew size=3> motto : Success is not only in the future , It's from the moment you decide to do it , It's accumulated over time .🧙 <font color =clue size=3> Due to the limited knowledge reserve , If there is a problem in the article , Please correct !thanks!<font color =black size=3> If you like aja's article, you can give it to Sanlian Or often come to see a sauce lying 🥺
Series index :

Preface
A sauce's private teaching ! To see is to earn !*️
Compared with the previous experiment, the knowledge points of this experiment are significantly increased , Everyone must practice more by themselves
This time, I hope you can achieve the following achievements :
1. Learn and master the use of charts and graphs , Understand the difference ;2. master Express VI Technology to quickly and easily build a professional testing system ;3. Learn and master LabVIEW Documents in I/O operation .
If you need source code, click this link :
One 、 The experimental requirements
== requirement :== Design a signal generator , So that it can have a variety of waveform display forms ( such as , Sine wave 、 Triangle wave 、 Custom waveform, etc ), At the same time, the waveform frequency 、 Adjust parameters such as amplitude . The maximum value of the waveform signal can be calculated 、 Minimum and average . It can save and read various waveform data .
Beautiful interface is required !
A sauce designed front panel :

Two 、 Operation steps
Experimental principle :
Experimental principle :(1)LabVIEW Contains many graphical display controls : Waveform chart 、 Waveform 、XY chart 、 Intensity diagram / Chart 、 Digital oscillogram 、 Three dimensional graphic oscillogram and oscillogram —— Display data with constant sampling rate . Waveforms usually collect data into an array first , Then draw the data into the graph ( Draw block by block ); The waveform chart adds new data points to the displayed data points to form a historical record ( Draw point by point ).XY chart —— Display data with non-uniform sampling rate and data of multivalued function . Intensity diagram / Chart —— Display the value of the third dimension in color on the two-dimensional diagram , Display three-dimensional data on a two-dimensional diagram . Digital oscillogram —— Display data in the form of pulses or groups of digital lines . Three dimensional graphics —— On the front panel ActiveX Display three-dimensional data on the three-dimensional diagram of the object .(2)abVIEW The readable and writable file formats mainly include : text file 、 Binary 、 Data record file .(3)LabVIEW Medium “ file I/O” The sub selection board has multiple file operation functions ( Such as writing / Read spreadsheet file 、 write in / Read text file 、 write in / Read binary 、 write in / Read data record file, etc ), Reasonable selection will realize new construction 、 open 、 close 、 read / Write 、 Delete 、 Copy 、 Move and other file operations .
The design idea of a sauce :

Follow the sauce step by step !

Waveform generation
First, the module of waveform generation is realized .
The waveform generation module is opened according to the following steps :

Next, we create an enumeration constant . set an option : Sine wave 、 Triangle wave 、 Custom waveform, etc :

Right click to set properties :

Then establish a conditional structure , Connect the enumeration constant to the branch selector .
Next, we will show the schematic diagram of each waveform generation one by one .
== white Gaussian noise :==

== Sine wave :==

== square wave :==

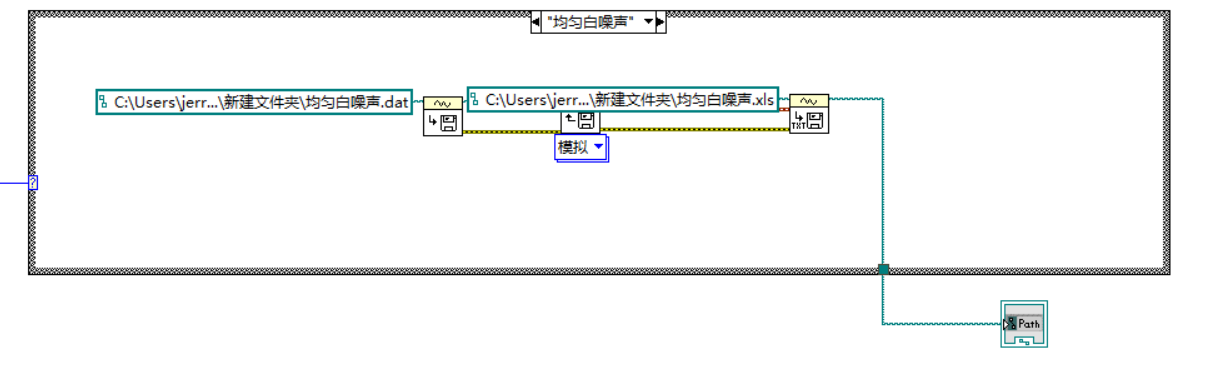
== Uniform white noise :==

== Sawtooth wave :==

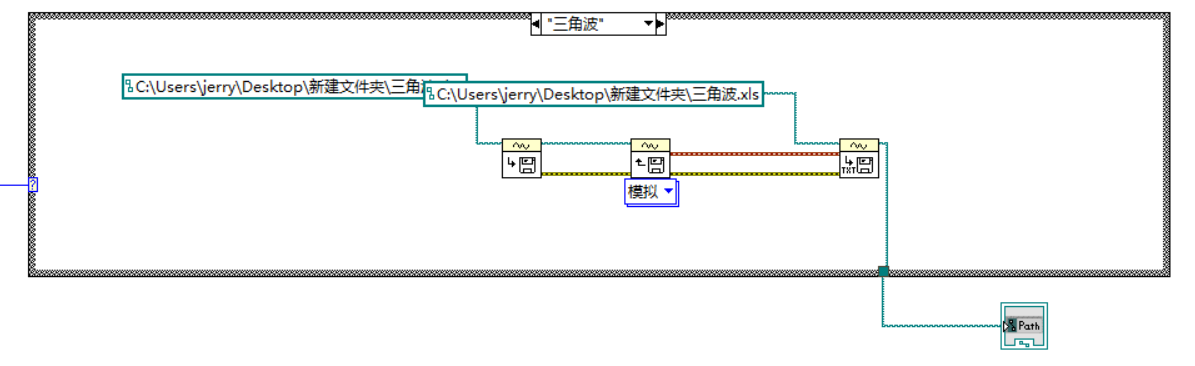
== Triangle wave :==

== Custom formula :==

Parameter display
Next, display parameters 🧒
The control we use here is == Statistics ==, His opening method is as follows :

Then connect according to the following figure :

Waveform display
Create a waveform chart after the window after the waveform generation in the first step to realize the image :

We need to add a program stop button , Connect to cycle condition .

So far, the waveform creation and display have been completed !
file save
Next we save the file !
First introduce the basic steps :

Just follow this order , You can save the waveform .
The location of these controls is :

We use conditional structure to save waveform files , Select the above enumeration constant as the branch selection condition .
Schematic diagram is as follows :
== white Gaussian noise :==

== Custom formula :==

== Sawtooth wave :==

== Sine wave :==

== square wave :==

== Uniform white noise :==
== Triangle wave :==
Innovation and interface
A sauce's innovation time !
Look at the interface designed by ajiang :

summary
End of the flower !

If you like this article or feel helpful , Give a sauce == Three companies support == Well !
原网站版权声明
本文为[InfoQ]所创,转载请带上原文链接,感谢
https://yzsam.com/2022/201/202207191352470795.html