当前位置:网站首页>Cartographer learning record: cartographer Map 3D visualization configuration (self recording dataset version)
Cartographer learning record: cartographer Map 3D visualization configuration (self recording dataset version)
2022-06-11 04:42:00 【Ordinary people unwilling to be ordinary】
stay Last one Yes Cartographer After the visual configuration of the official data set , This blog will share with you how to use your own recorded data packets to map 3D visualization . Because I haven't used to blogging before , I didn't record the process of building the platform and recording the dataset , I will write it again sometime later , I will continue to update this series !
One 、 Introduction to the experimental platform
use WHEELTEC The 4WD high configuration version independently hangs the off-road outdoor car as a mobile platform , collocation QUANERGY Of M8 Series laser (24V Power supply ) and WHEELTEC Of N100 type IMU Carry out the outdoor drawing test of the campus , The recording topic name is /points2 Laser data and /imu Of IMU data , Form a package named 2022-01-14-outdoor.bag Data set of , A blog will be updated later to introduce how to set up an environment to record your own data sets .
Two 、 establish launch File for offline mapping
Here we create a system called my_demo_offline.launch file , The details are as follows :
<!--my_demo_offline-->

<launch>
  <param name="/use_sim_time" value="true" />

  <node name="cartographer_node" pkg="cartographer_ros" type="cartographer_node" output="screen" respawn="true" >
  </node>

  <node name="cartographer_start_trajectory" pkg="cartographer_ros" type="cartographer_start_trajectory"
       output="screen" respawn="true">
  </node>

  <node name="cartographer_occupancy_grid_node" pkg="cartographer_ros" type="cartographer_occupancy_grid_node" args="-resolution 0.05 -publish_period_sec 10.0" respawn="true"/>

  <node name="playbag" pkg="rosbag" type="play"
      args="--clock $(arg bag_filename)" />
</launch>
<param name="/use_sim_time" value="true" /> Medium true Value indicates offline mapping , If yes, change to false It means real-time online mapping , Like my real-time online mapping launch This is the document :
<!--my_demo-->

<launch>
  <param name="/use_sim_time" value="false" />

  <node name="cartographer_node" pkg="cartographer_ros" type="cartographer_node" output="screen" respawn="true" >
  </node>

  <node name="cartographer_start_trajectory" pkg="cartographer_ros" type="cartographer_start_trajectory"
       output="screen" respawn="true">
  </node>

  <node name="cartographer_occupancy_grid_node" pkg="cartographer_ros" type="cartographer_occupancy_grid_node" args="-resolution 0.05 -publish_period_sec 10.0" respawn="true"/>
</launch>
Therefore, the terminal instruction to enable offline mapping is :
roslaunch cartographer_ros my_demo_offline.launch bag_filename:=/home/jin/laser_dataset_own/2022-01-14-outdoor.bagbag_filename Later, change to the path where your data set is stored + file name , I put it here home In the catalog laser_dataset_own Under the folder .
After the map is created, the command to save the map is , utilize cartographer_ros Services provided to save pbstream file :
rosservice call /finish_trajectory "trajectory_id: 0"

rosservice call /write_state "filename: '2022-01-14-outdoor.bag.pbstream'                                                                   include_unfinished_submaps: false"
I am here to save my name as “2022-01-14-outdoor.bag.pbstream” The file of , It is recommended that you standardize the naming method when making projects , So as to bring convenience in management in the future . Data sets are generally unified into dates + The form of the subject , Let's make a reference for you .
3、 ... and 、 establish launch、urdf、lua File to save point cloud data .
In my last blog, I introduced in detail how to save point cloud data , No more details here , I will mainly talk about how to integrate the assets_writer_backpack_3d.launch Change the file to your own according to your actual needs launch file , as well as launch Involved in the document urdf and lua file .
Let's put launch Comparison diagram of documents :

On the left is your own assets_writer_pointcloud_3d.launch file , On the right is the official document , The main changes you can see are lua File path, file name and urdf Path file name of .
Here is lua Comparison diagram of documents :

Again , On the left is your own assets_writer_pointcloud_3d.lua file , Because in the official data set 3D Laser data is divided into horizontal and vertical topics , my QUANERGY Of M8 The series laser transmission is named laser Laser data , So what I changed is to cut the original two parts into one .
Here is urdf Comparison diagram of documents :


Similarly, the left side is your own pointcloud_3d.urdf file ,urdf Files are mainly configuration imu And the laser base_link Transformation , I installed the laser and IMU Put together , In addition, the coordinate axis shall unify the direction according to the provisions of the respective instructions , Therefore, set the translation and rotation configurations to 0. The picture above is for you to have a clear and comparative understanding , Now I put my launch、urdf and lua file .
assets_writer_pointcloud_3d.launch
<!--
  Copyright 2016 The Cartographer Authors

  Licensed under the Apache License, Version 2.0 (the "License");
  you may not use this file except in compliance with the License.
  You may obtain a copy of the License at

       http://www.apache.org/licenses/LICENSE-2.0

  Unless required by applicable law or agreed to in writing, software
  distributed under the License is distributed on an "AS IS" BASIS,
  WITHOUT WARRANTIES OR CONDITIONS OF ANY KIND, either express or implied.
  See the License for the specific language governing permissions and
  limitations under the License.
-->

<launch>
  <node name="cartographer_assets_writer" pkg="cartographer_ros" required="true"
      type="cartographer_assets_writer" args="
          -configuration_directory /home/jin/config/slam_config
          -configuration_basename assets_writer_pointcloud_3d.lua
          -urdf_filename $(find cartographer_ros)/urdf/pointcloud_3d.urdf
          -bag_filenames $(arg bag_filenames)
          -pose_graph_filename $(arg pose_graph_filename)"
      output="screen">
  </node>
</launch>
pointcloud_3d.urdf
<!-- pointcloud_map -->

<robot name="cartographer_backpack_3d">
  <material name="orange">
    <color rgba="1.0 0.5 0.2 1" />
  </material>
  <material name="gray">
    <color rgba="0.2 0.2 0.2 1" />
  </material>

  <link name="imu_link">
    <visual>
      <origin xyz="0.0 0.0 0.0" />
      <geometry>
        <box size="0.06 0.04 0.02" />
      </geometry>
      <material name="orange" />
    </visual>
  </link>

  <link name="laser">
    <visual>
      <origin xyz="0.0 0.0 0.0" />
      <geometry>
        <cylinder length="0.07" radius="0.05" />
      </geometry>
      <material name="gray" />
    </visual>
  </link>

  <link name="base_link" />

  <joint name="imu_link_joint" type="fixed">
    <parent link="base_link" />
    <child link="imu_link" />
    <origin xyz="0 0 0" rpy="0 0 0" />
  </joint>

  <joint name="laser_link_joint" type="fixed">
    <parent link="base_link" />
    <child link="laser" />
    <origin xyz="0 0 0" rpy="0 0 0" />
  </joint>
</robot>
assets_writer_pointcloud_3d.lua
-- pointcloud_map

VOXEL_SIZE = 5e-2

include "transform.lua"

options = {
  tracking_frame = "base_link",
  pipeline = {
    {
      action = "min_max_range_filter",
      min_range = 1.,
      max_range = 60.,
    },
    {
      action = "dump_num_points",
    },
    {
      action = "fixed_ratio_sampler",
      sampling_ratio = 0.01,
    },

    -- Gray X-Rays. These only use geometry to color pixels.
    {
      action = "write_xray_image",
      voxel_size = VOXEL_SIZE,
      filename = "xray_yz_all",
      transform = YZ_TRANSFORM,
    },
    {
      action = "write_xray_image",
      voxel_size = VOXEL_SIZE,
      filename = "xray_xy_all",
      transform = XY_TRANSFORM,
    },
    {
      action = "write_xray_image",
      voxel_size = VOXEL_SIZE,
      filename = "xray_xz_all",
      transform = XZ_TRANSFORM,
    },

    -- Now we recolor our points by frame and write another batch of X-Rays. It
    -- is visible in them what was seen by the horizontal and the vertical
    -- laser.
    {
      action = "color_points",
      frame_id = "laser",
      color = { 255., 0., 0. },
    },

    {
      action = "write_xray_image",
      voxel_size = VOXEL_SIZE,
      filename = "xray_yz_all_color",
      transform = YZ_TRANSFORM,
    },
    {
      action = "write_xray_image",
      voxel_size = VOXEL_SIZE,
      filename = "xray_xy_all_color",
      transform = XY_TRANSFORM,
    },
    {
      action = "write_xray_image",
      voxel_size = VOXEL_SIZE,
      filename = "xray_xz_all_color",
      transform = XZ_TRANSFORM,
    },
    {
      action = "write_ply",
      filename = "points.ply"
    },

  }
}

return options
Finally, it is enabled assets_writer_pointcloud_3d.launch File generation .ply file , The terminal instructions are as follows :
roslaunch cartographer_ros assets_writer_pointcloud_3d.launch bag_filenames:=/home/jin/laser_dataset_own/2022-01-14-outdoor.bag pose_graph_filename:=/home/jin/laser_dataset_own/2022-01-14-outdoor.bag.pbstreamStep four , Point cloud visualization
Mode one :
utilize pcl_ply2pcd take ply Format conversion to pcd Format to view , That is, input the following command at the terminal :
pcl_ply2pcd 2022-01-14-outdoor.bag_points.ply 2022-01-14-outdoor.pcdsee pcd The command of format diagram is as follows :
pcl_viewer 2022-01-14-outdoor.pcdPCD The format is shown below , A little simplified , If you want to see the detailed suggestions, use mode 2 .

Mode two :
utilize sdl_viewer To view the , The specific configuration can be seen in my Last blog , There is a very detailed introduction . Now let's show the effect picture , After the actual operation, you can follow PCD Format for comparison , What is tall what is low , You can tell at a glance . Of course , My drawing is still preliminary , There are still many areas that need to be optimized , This is the follow-up work arrangement , come on. !

边栏推荐
- Holiday Homework
- International qihuo: what are the risks of Zhengda master account
- CRMEB/V4.4标准版打通版商城源码小程序公众号H5+App商城源码
- DL deep learning experiment management script
- PCB ground wire design_ Single point grounding_ Bobbin line bold
- Production of unity scalable map
- Implementation of unity transport mechanism
- hiredis 判断主节点
- codesys 獲取系統時間
- RGB image histogram equalization and visualization matlab code
猜你喜欢

PostgreSQL数据库复制——后台一等公民进程WalReceiver 收发逻辑
Problems in compiling core source cw32f030c8t6 with keil5

决策树(Hunt、ID3、C4.5、CART)

Emlog new navigation source code / with user center

USB转232 转TTL概述

Unity 传送机制的实现
![[customview] glide+bitmaptransformation picture upper and lower border wave processing (wavetransformation)](/img/20/6ded07851466d6ef5e5d5a296e3aed.png)
[customview] glide+bitmaptransformation picture upper and lower border wave processing (wavetransformation)
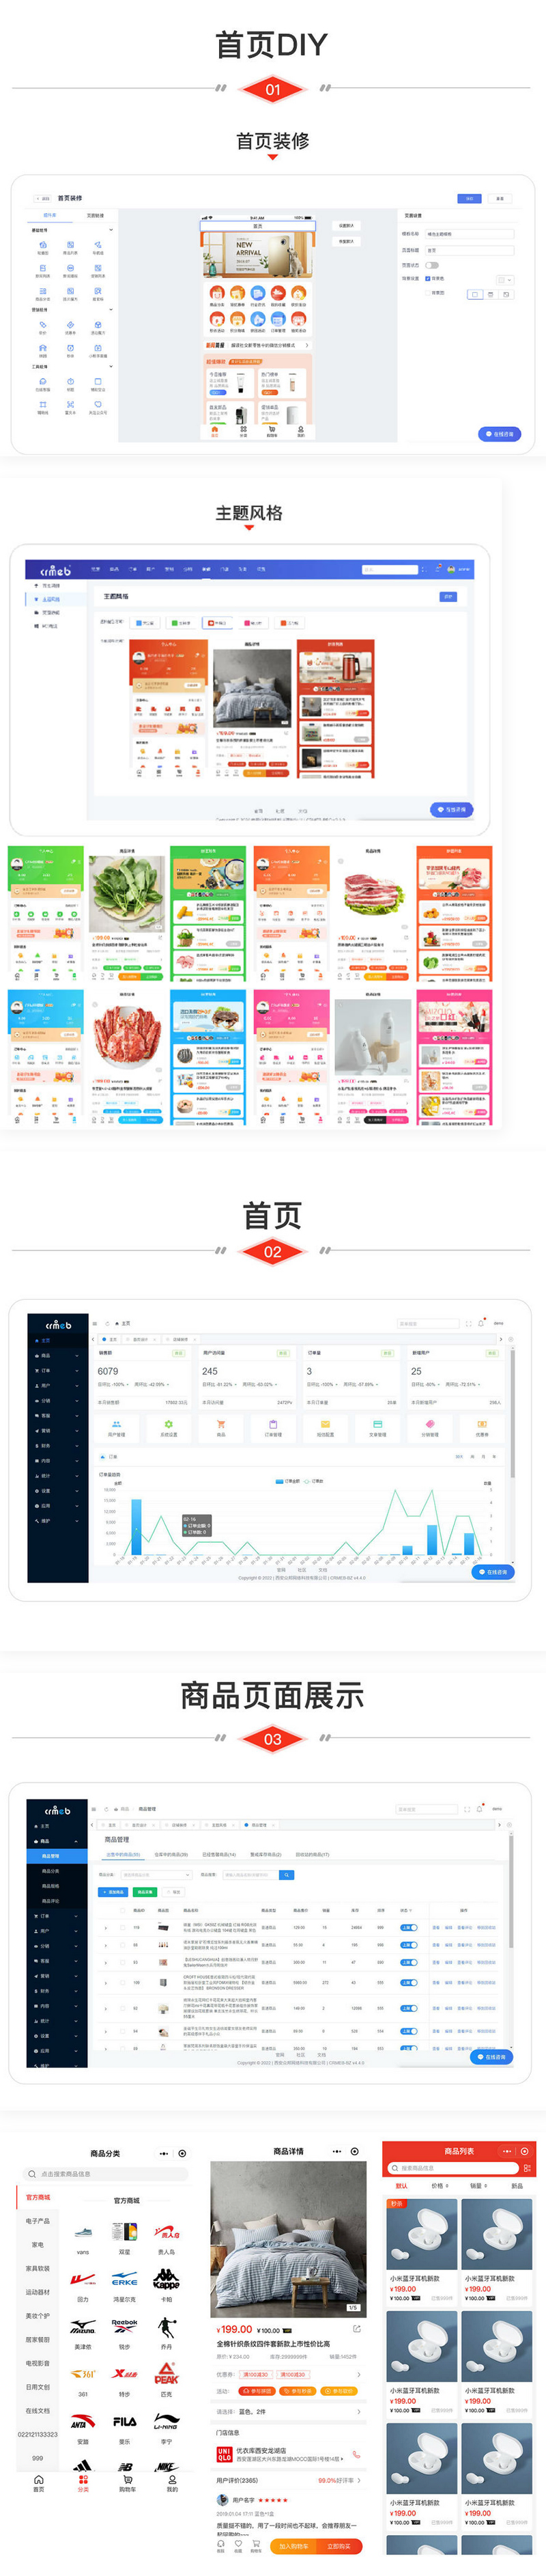
Crmeb/v4.4 Standard Version open version mall source code applet official account h5+app mall source code

Exness: Liquidity Series - order Block, Unbalanced (II)
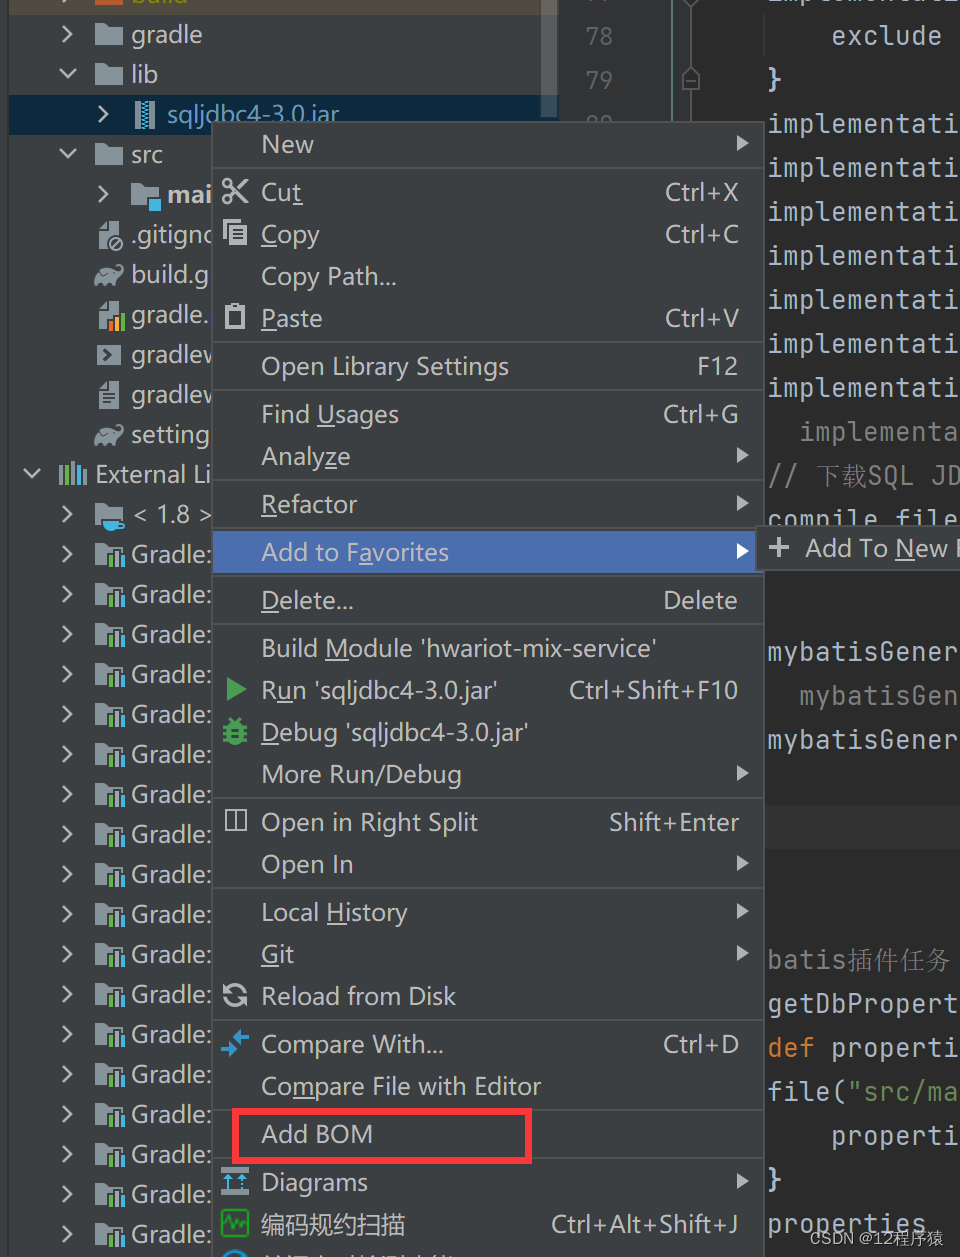
How the idea gradle project imports local jar packages
随机推荐
免费数据 | 新库上线 | CnOpenData全国文物商店及拍卖企业数据
CONDA switching
正大国际:真正会在琪貨投资都都应该知道
Holiday Homework
Unity 物品模型旋转展示
Feature engineering feature dimension reduction
An adaptive chat site - anonymous online chat room PHP source code
Leetcode question brushing series - mode 2 (datastructure linked list) - 24 (m): swap nodes in pairs exchange nodes in the linked list
How to calculate the handling charge of international futures gold?
Crmeb/v4.4 Standard Version open version mall source code applet official account h5+app mall source code
idea gradle项目 如何导入 本地jar 包
Unity 遮挡剔除
The live broadcast helped Hangzhou e-commerce Unicorn impact the listing, and the ledger system restructured the new pattern of e-commerce transactions
Legend has it that setting shader attributes with shader ID can improve efficiency:)
International qihuo: what are the risks of Zhengda master account
The 4th small class discussion class on fundamentals of information and communication
Split all words into single words and delete the product thesaurus suitable for the company
图的最短路径问题 详细分解版
codesys 获取系统时间
SAVING AND LOADING A GENERAL CHECKPOINT IN PYTORCH