当前位置:网站首页>R语言corrplot相关热图美化实例分析
R语言corrplot相关热图美化实例分析
2022-06-24 18:50:00 【亿速云】
R语言corrplot相关热图美化实例分析
这篇文章主要介绍“R语言corrplot相关热图美化实例分析”的相关知识,小编通过实际案例向大家展示操作过程,操作方法简单快捷,实用性强,希望这篇“R语言corrplot相关热图美化实例分析”文章能帮助大家解决问题。
介绍
R corrplot包 提供了一个在相关矩阵上的可视化探索工具,该工具支持自动变量重新排序,以帮助检测变量之间的隐藏模式。
corrplot 非常易于使用,并在可视化方法、图形布局、颜色、图例、文本标签等方面提供了丰富的绘图选项。它还提供 p 值和置信区间,以帮助用户确定相关性的统计显著性。
corrplot()有大约50个参数,但最常见的参数只有几个。在大多数场景中,我们可以得到一个只有一行代码的相关矩阵图。
1.加载包
library(corrplot)
2.加载数据
mtcars
3.绘图
corrplot(M, method = 'number')

#order排序方法original(默认),特征向量角度排序AOE,第一个主成分顺序FPC,分层聚类排序hclust,按照字母排序alphabetcorrplot(M, method = 'color', order = 'hclust')
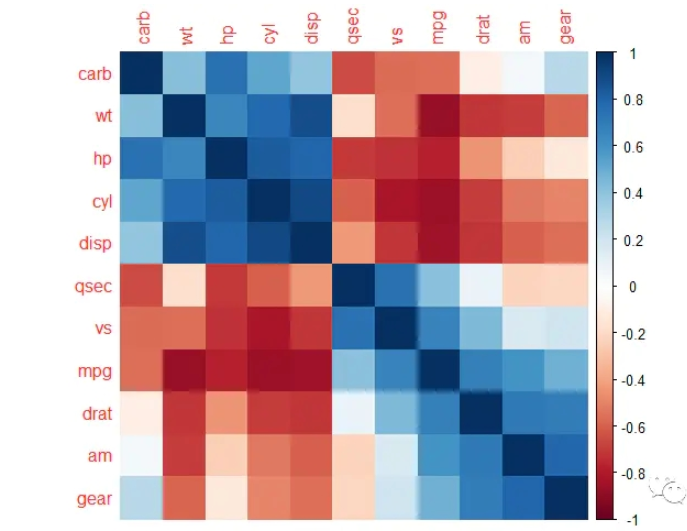
#形状默认circle,除此之外还有square,ellipse,number,pie,shade,colorcorrplot(M,method="circle")

corrplot(M,method="square")

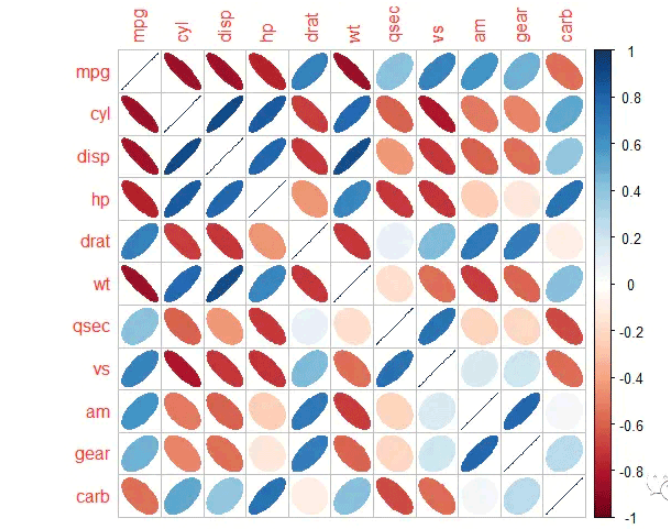
corrplot(M,method="ellipse")
corrplot(M,method="pie")

#diag = FALSE,不显示中间为1的格子corrplot(M,method="square",diag = FALSE)

#type仅仅显示下部分相关性,除此之外还有参数full,uppercorrplot(M, method = 'square', order = 'FPC', type = 'lower', diag = FALSE)

corrplot(M, method = 'ellipse', order = 'FPC', type = 'upper', diag = FALSE)

#数字和图混合corrplot.mixed(M, order = 'AOE')

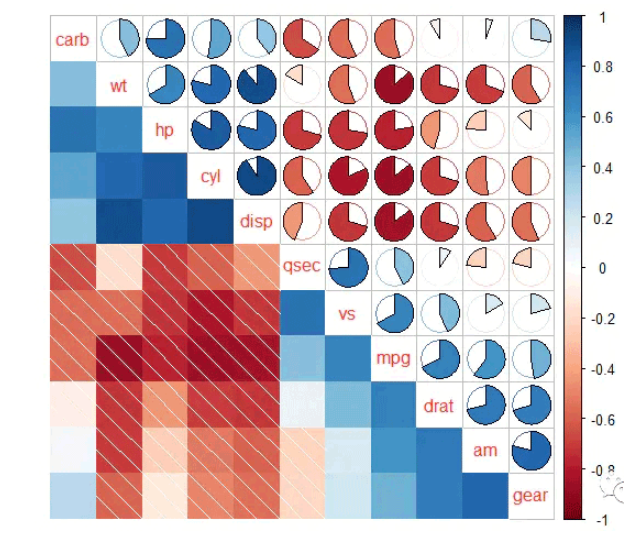
#混合上部饼图,下部阴影corrplot.mixed(M, lower = 'shade', upper = 'pie', order = 'hclust')
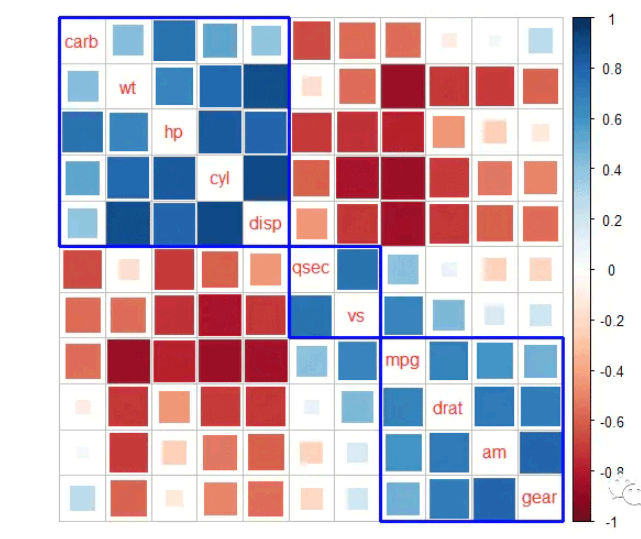
#分层聚类,标出2个clustercorrplot(M, order = 'hclust', addrect = 2)
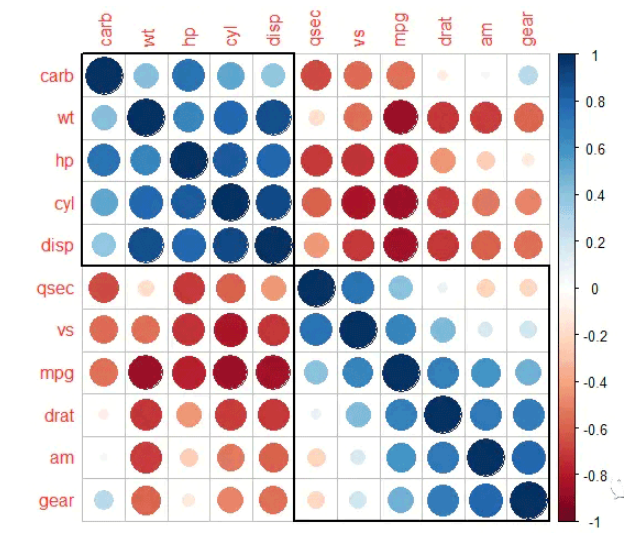
#定义圈出的cluster,以及圈出线的颜色和线条corrplot(M, method = 'square', diag = FALSE, order = 'hclust', addrect = 3, rect.col = 'blue', rect.lwd = 3, tl.pos = 'd')
4.个性化设置聚类方法
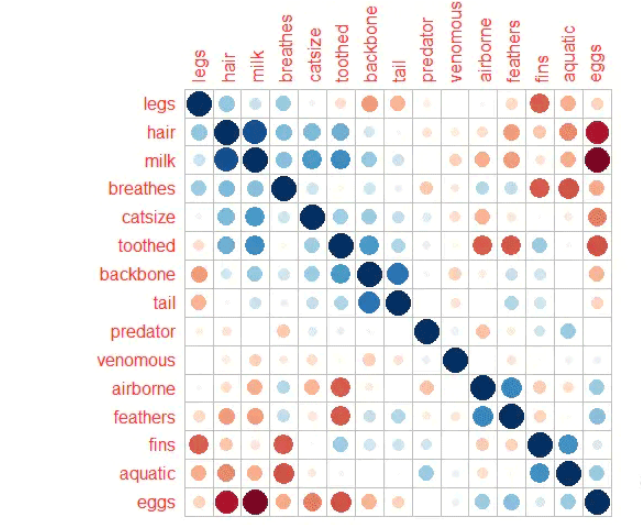
install.packages("seriation")library(seriation)list_seriation_methods('matrix')list_seriation_methods('dist')data(Zoo)Z = cor(Zoo[, -c(15, 17)])dist2order = function(corr, method, ...) { d_corr = as.dist(1 - corr) s = seriate(d_corr, method = method, ...) i = get_order(s) return(i)}# Fast Optimal Leaf Ordering for Hierarchical Clusteringi = dist2order(Z, 'OLO')corrplot(Z[i, i], cl.pos = 'n')
# Quadratic Assignment Problemi = dist2order(Z, 'QAP_2SUM')corrplot(Z[i, i], cl.pos = 'n')
# Multidimensional Scalingi = dist2order(Z, 'MDS_nonmetric')corrplot(Z[i, i], cl.pos = 'n')

5.个性化添加矩阵
library(magrittr)#方法1i = dist2order(Z, 'R2E')corrplot(Z[i, i], cl.pos = 'n') %>% corrRect(c(1, 9, 15))

#方法2corrplot(Z, order = 'AOE') %>% corrRect(name = c('tail', 'airborne', 'venomous', 'predator'))
#方法3直接指定r = rbind(c('eggs', 'catsize', 'airborne', 'milk'), c('catsize', 'eggs', 'milk', 'airborne'))corrplot(Z, order = 'hclust') %>% corrRect(namesMat = r)
6.颜色设置
COL1(sequential = c("Oranges", "Purples", "Reds", "Blues", "Greens", "Greys", "OrRd", "YlOrRd", "YlOrBr", "YlGn"), n = 200)COL2(diverging = c("RdBu", "BrBG", "PiYG", "PRGn", "PuOr", "RdYlBu"), n = 200)#cl.*参数常用于颜色图例:cl.pos颜色标签的位置('r'type='upper''full''b'type='lower''n'),cl.ratio颜色图例的宽度建议0.1~0.2#tl.*参数常用于文本图例:tl.pos用于文本标签的位置,tl.cex文本大小,tl.srt文本的旋转corrplot(M, order = 'AOE', col = COL2('RdBu', 10))
corrplot(M, order = 'AOE', addCoef.col = 'black', tl.pos = 'd', cl.pos = 'r', col = COL2('PiYG'))
corrplot(M, method = 'square', order = 'AOE', addCoef.col = 'black', tl.pos = 'd', cl.pos = 'r', col = COL2('BrBG'))
corrplot(M, order = 'AOE', cl.pos = 'b', tl.pos = 'd',col = COL2('PRGn'), diag = FALSE)
corrplot(M, type = 'lower', order = 'hclust', tl.col = 'black', cl.ratio = 0.2, tl.srt = 45, col = COL2('PuOr', 10))
corrplot(M, order = 'AOE', cl.pos = 'n', tl.pos = 'n', col = c('white', 'black'), bg = 'gold2')
关于“R语言corrplot相关热图美化实例分析”的内容就介绍到这里了,感谢大家的阅读。如果想了解更多行业相关的知识,可以关注亿速云行业资讯频道,小编每天都会为大家更新不同的知识点。
边栏推荐
- The cdc+mysql connector joins the date and time field from the dimension table by +8:00. Could you tell me which one is hosted by Alibaba cloud
- Why is nodejs so fast?
- Microservice system design - sub service project construction
- Interview algorithm - string question summary
- How to create a linear model prediction interval in R and visualize it
- UnityShader 世界坐标不随模型变化
- Make track map
- 建立自己的网站(8)
- The group offsets of the Kafka of the Flink SQL. If the specified groupid is not mentioned
- What type of datetime in the CDC SQL table should be replaced
猜你喜欢
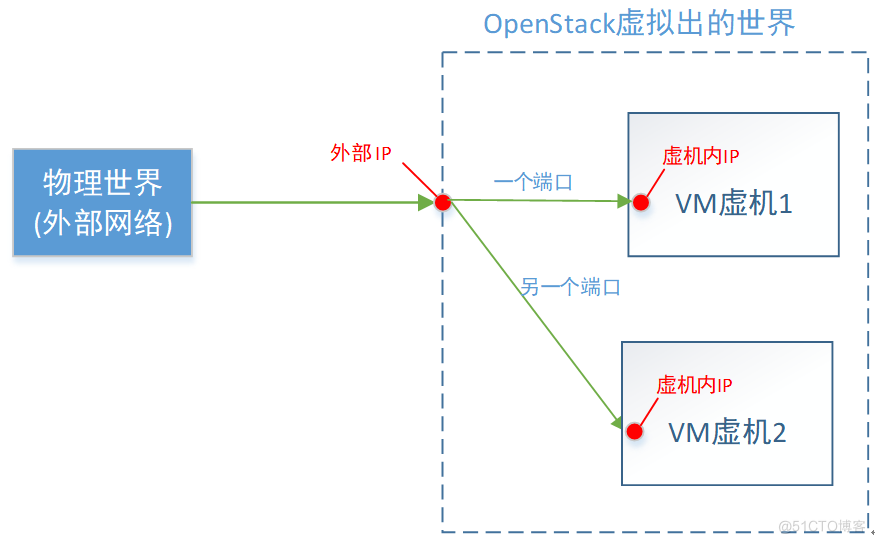
Understanding openstack network

Volcano becomes spark default batch scheduler
![subject may not be empty [subject-empty]](/img/6b/9b57a7ed3ab086036cb6dfe0b31de4.png)
subject may not be empty [subject-empty]

Starring develops httpjson access point + Database

Why is nodejs so fast?

Freeswitch使用originate转dialplan

1: Mosaic of 100W basic geographic information data

three.js创建的基础框架

Vite+web3: referenceerror: process is not defined

建立自己的网站(8)
随机推荐
Self taught C special data type
Volcano成Spark默认batch调度器
Value passing and reference passing of value types and reference types in CSharp
Generate the last login user account report of the computer through SCCM SQL
制造业项目MDM主数据项目实施心得
Vite+web3: referenceerror: process is not defined
Introduction and tutorial of SAS planet software
R语言 4.1.0软件安装包和安装教程
香港服务器租用错误可能导致严重后果
ls 常用参数
西北工业大学遭黑客攻击?双因素认证改变局面!
一文理解OpenStack网络
NFT pledge liquidity mining system development technology
R language 4.1.0 software installation package and installation tutorial
Conception de systèmes de micro - services - construction de sous - services
Interpreting harmonyos application and service ecology
Application scenarios of channel of go question bank · 11
实时渲染:实时、离线、云渲染、混合渲染的区别
佛祖保佑 永无BUG
Microservice system design - sub service project construction