当前位置:网站首页>JS array splicing "suggested collection"
JS array splicing "suggested collection"
2022-06-27 09:41:00 【Full stack programmer webmaster】
Hello everyone , I meet you again , I'm your friend, Quan Jun .
js Array splicing method of
Method 1 :concat Method splicing ( Returns a new array )
var a1 = [1,2,3,4,5];
var a2 = [‘a’,’b’,’c’];
var newa = a1.concat(a2);
Result Type :object
concat Method : Used to connect two or more arrays , Generate a new array ,concat The following array is the element of the array when operating , Not an array
Method 2 :join Method splicing ( Returns a new array )
var a1 = [1,2,3,4,5];
var a2 = [‘a’,’b’,’c’];
var newa = a1.join()+’,’+a2.join();
Return results :1,2,3,4,5,a,b,c
Result Type :string
join Method : Put all the elements of the array into a string , And then connect these strings , Insert... Between two elements separator String .separator stay join() Comma when no delimiter is added (‘,’), stay join(‘.’) When adding a delimiter, use the provided symbol to split .
Method 3 : combination apply perhaps call Use
var a1 = [1,2,3,4,5];
var a2 = [‘a’,’b’,’c’];
a1.push.apply(a1,a2);
Result Type :object
apply Method : Write methods for different objects , take a1 Of push Methods used in a1 On , receive a2( An array type ) Parameters
var a1 = [1,2,3,4,5];
var a2 = [‘a’,’b’,’c’];
a1.push.call(a1,…a2);
Result Type :object
call Method : A method that calls an object , Replace the current object with another object , The parameters of an object are parameter sequences
explain :
call([thisObj[,arg1[, arg2[, [,.argN]]]]])
Parameters
1)thisObj optional . The object that will be used as the current object .
2)arg1, arg2, , argN optional . Method parameter sequence to be passed .
Method four :es6 The extension operator of
var a1 = [1,2,3,4,5];
var a2 = [‘a’,’b’,’c’];
a1.push(…a2)
Result Type :object
Extension operator : like rest Inverse operation of parameter , Convert an array into a comma separated sequence of parameters , Mainly used for function calls .
Method five : Traversal array
var a1 = [1,2,3,4,5];
var a2 = [‘a’,’b’,’c’];
a2.forEach((item) => {a1.push(item); })
Result Type :object
Publisher : Full stack programmer stack length , Reprint please indicate the source :https://javaforall.cn/133635.html Link to the original text :https://javaforall.cn
边栏推荐
- Brief introduction to SSL encryption process
- R语言plotly可视化:可视化多个数据集归一化直方图(historgram)并在直方图中添加密度曲线kde、设置不同的直方图使用不同的分箱大小(bin size)、在直方图的底部边缘添加边缘轴须图
- 快捷键 bug,可复现(貌似 bug 才是需要的功能 [滑稽.gif])
- Understand neural network structure and optimization methods
- main()的参数argc与argv
- win10为任意文件添加右键菜单
- 为智能设备提供更强安全保护 科学家研发两种新方法
- Process 0, process 1, process 2
- R language plot visualization: visualize the normalized histograms of multiple data sets, add density curve KDE to the histograms, set different histograms to use different bin sizes, and add edge whi
- Privacy computing fat offline prediction
猜你喜欢

Video file too large? Use ffmpeg to compress it losslessly

ucore lab3

The markdown plug-in of the browser cannot display the picture

C # solve the relative path problem using SQLite

提高效率 Or 增加成本,开发人员应如何理解结对编程?

Installation and usage of source insight tool
不容置疑,这是一个绝对精心制作的项目

新旧两个界面对比
Shortcut key bug, reproducible (it seems that bug is the required function [funny.Gif])
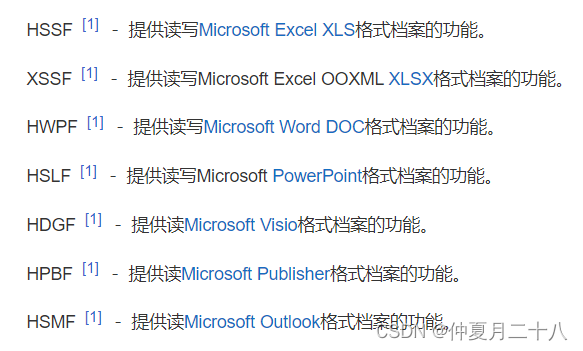
Reading and writing Apache poi
![Shortcut key bug, reproducible (it seems that bug is the required function [funny.Gif])](/img/1a/9ec6db6fccd16e54e33ace6ce073a8)
随机推荐
新旧两个界面对比
Preliminary understanding of pytorch
torch.utils.data.RandomSampler和torch.utils.data.SequentialSampler的区别
Take you to play with the camera module
Rockermq message sending mode
IO pin configuration and pinctrl drive
【生动理解】深度学习中常用的各项评价指标含义TP、FP、TN、FN、IoU、Accuracy
ucore lab4
This application failed to start because it could not find or load the QT platform plugin
.NET 中的引用程序集
R语言plotly可视化:plotly可视化二维直方图等高线图、在等高线上添加数值标签、自定义标签字体色彩、设置鼠标悬浮显示效果(Styled 2D Histogram Contour)
openpyxl表格读取实例
使用aspose-slides将ppt转pdf
一次线上移动端报表网络连接失败问题定位与解决
MySQL proficient-01 addition, deletion and modification
ucore lab5
别再用 System.currentTimeMillis() 统计耗时了,太 Low,StopWatch 好用到爆!
Design of multiple classes
Conception de plusieurs classes
R langage plotly visualisation: visualisation de plusieurs histogrammes normalisés d'ensembles de données et ajout d'une courbe de densité KDE à l'histogramme, réglage de différents histogrammes en ut