当前位置:网站首页>jmeter -- prometheus+grafana服务器性能可视化
jmeter -- prometheus+grafana服务器性能可视化
2022-07-24 18:08:00 【zyanwei2018】
1. Prometheus简介
- Prometheus是一个开源的系统监控和报警系统,用go语言开发,有各种exporter来收集服务器性能数据
2. Prometheus部署
- 添加配置文件
- 内容参照:https://github.com/prometheus/prometheus/blob/main/documentation/examples/prometheus.yml
vim prometheus.yml

# my global config
global:
  scrape_interval: 15s # Set the scrape interval to every 15 seconds. Default is every 1 minute.
  evaluation_interval: 15s # Evaluate rules every 15 seconds. The default is every 1 minute.
  # scrape_timeout is set to the global default (10s).

# Alertmanager configuration
alerting:
  alertmanagers:
    - static_configs:
        - targets:
          # - alertmanager:9093

# Load rules once and periodically evaluate them according to the global 'evaluation_interval'.
rule_files:
  # - "first_rules.yml"
  # - "second_rules.yml"

# A scrape configuration containing exactly one endpoint to scrape:
# Here it's Prometheus itself.
scrape_configs:
  # The job name is added as a label `job=<job_name>` to any timeseries scraped from this config.
  - job_name: "prometheus"

    # metrics_path defaults to '/metrics'
    # scheme defaults to 'http'.

    static_configs:
      - targets: ["localhost:9090"]
- 创建prometheus容器
docker run -d --name prometheus \
	--network grafana -p 9090:9090 \
	-v ${
    PWD}/prometheus.yml:/etc/prometheus/prometheus.yml \
	prom/prometheus:v2.16.0 --config.file=/etc/prometheus/prometheus.yml
- 查看监控状态
- 访问http://ip:9090/,选择Status–>Targets,即可查看监控的服务列表
3. node_exporter安装配置
- node_exporter安装
docker run -d --name node_exporter \
	-p 9100:9100 prom/node-exporter:v1.2.0
- 验证工具服务是否启动
- 访问http://ip:9100,验证
- prometheus配置添加被监控节点
vim prometheus.yml
scrape_configs:
  - job_name: "prometheus"
    static_configs:
      - targets: ["localhost:9090"]

  # add
  - job_name: "demo01"
    static_configs:
      - targets: ["ip:9100"] # 不能是localhost
4. grafana可视化
- 创建容器(略)
- grafana配置数据源
>+ 访问grafana,http://ip:3000,默认账号密码:admin/admin
>+ 配置数据库:Add data source-->Prometheus-->
>   + Url: http://prometheus:9090(同容器Name和Port)
>   + Scrape interval:15s
- grafana导入Dashboard
>+ Import Dashboard
>   + Grafana.com Dashboard: 11174
>   + Name: Node Exporter for Prometheus
>   + Prometheus:Prometheus
边栏推荐
- 0701~放假总结
- (mandatory) override equals must override hashcode (principle analysis)
- New can also create objects. Why do you need factory mode?
- 干货|值得收藏的三款子域名收集工具
- Still building projects from scratch? This upgraded rapid development scaffold is worth a try!
- 0630~职业素养课
- 0615~用自定义注解实现RBAC权限管理
- 继承与派生
- 如何向 google colab 快速上传文件
- Wu Enda writes: how to establish projects to adapt to AI career
猜你喜欢

Detailed explanation of ansible automatic operation and maintenance (V) the setting and use of variables in ansible, the use of jinja2 template and the encryption control of ansible
Install jumpserver

Flink operation Hudi data table

T245982 "kdoi-01" drunken flower Yin
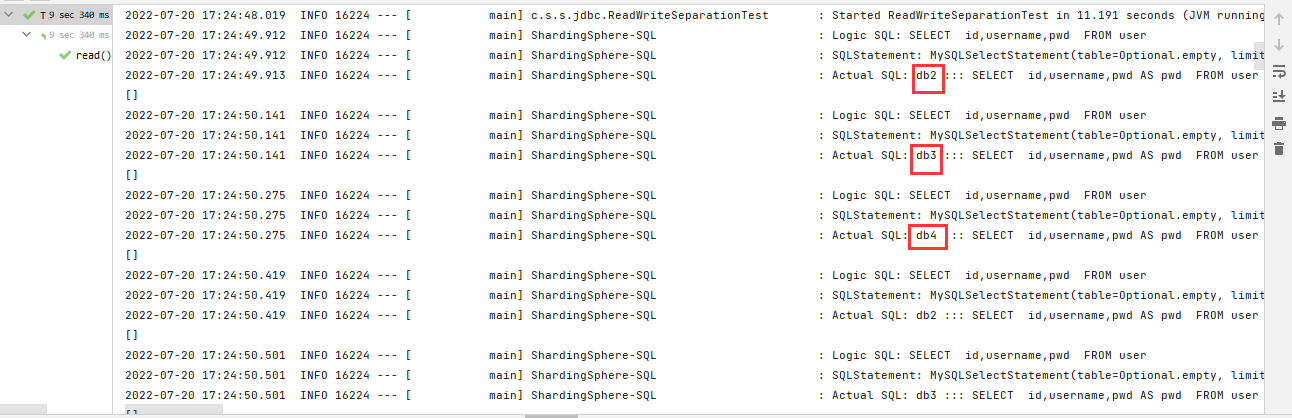
Shardingsphere database read / write separation

0625~<config>-<bus>

Opencv picture rotation

使用Prometheus+Grafana监控MySQL性能指标

Dry goods | three sub domain name collection tools worth collecting

Common methods of number and math classes
随机推荐
0627~ holiday knowledge summary
1688/阿里巴巴按关键字搜索新品数据 API 使用说明
Gan Development Series II (pggan, Singan)
[OBS] dependency Library: x264 vs Build
Use prometheus+grafana to monitor MySQL performance indicators
Goodbye Navicat! This open source database management tool has a cooler interface!
Alibaba /166 obtains the API instructions for all products in the store
【obs】视频、音频编码与rtmp发送的配合
Wu Enda writes: how to establish projects to adapt to AI career
undefined reference to H5PTopen
213. Looting II - Dynamic Planning
Mac database management software Navicat premium essentials mac
Simple test JS code
生信常用分析图形绘制02 -- 解锁火山图真谛!
C language custom type explanation - structure
PXE高效批量网络装机
What are the pitfalls from single architecture to distributed architecture?
In depth analysis of the famous Alibaba cloud log4j vulnerability
关于接口的写法 1链式判读 ?. 2方法执行 (finally)一定会执行
Int8 & int8, have you ever stumbled like this?