当前位置:网站首页>Drawing DEM with GEE gracefully
Drawing DEM with GEE gracefully
2022-06-24 19:22:00 【Geographical space of ruiduobao】
About
I read a high-quality article yesterday python Draw topographic map blog . Is like , It occurred to me GEE(Google earth engine) There are many data sources 、 Fast calculation 、 The characteristic of many calculation operators , Use GEE It should not be inferior to python.
Production process
Use GEE draw DEM Altogether 3 Step , One of the most important is the use of color palette .

(1)DEM data source
GEE Of DEM There are a lot of data , Readers can choose the appropriate data source according to their own needs . The study area is large , Lower resolution data can be selected , If the study area is small , Try to use high resolution DEM.
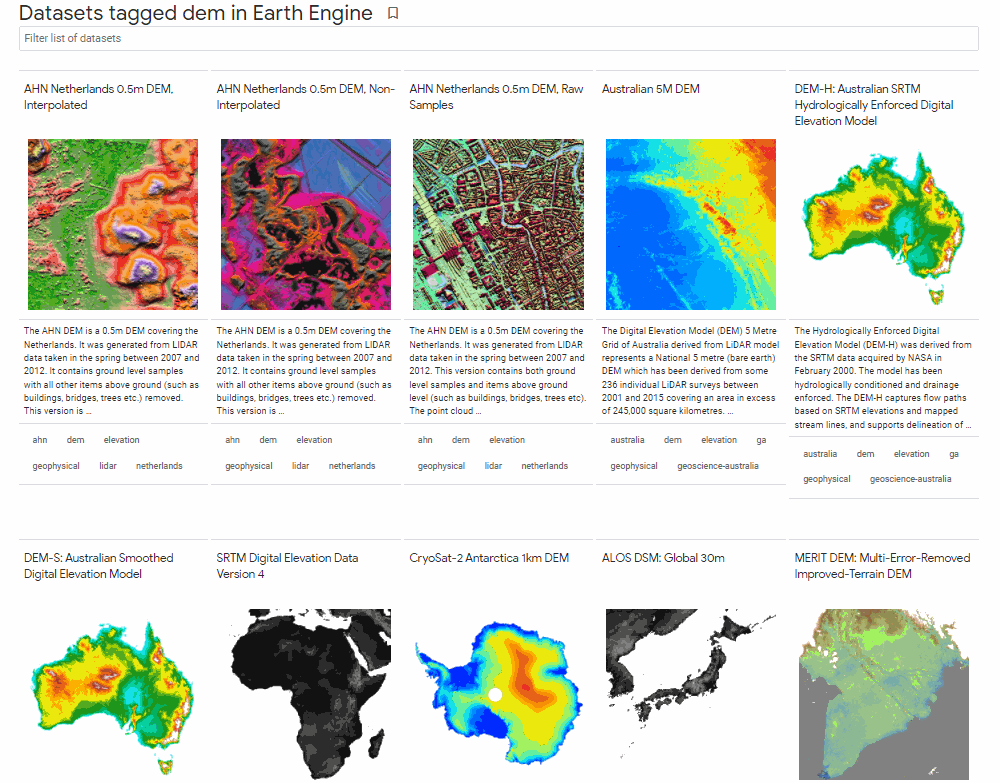
stay GEE Every data source in , There are detailed descriptions and code reference examples , For example, in the Netherlands 0.5m Resolution DEM:

Considering that the test area is my hometown Sichuan Province , Here we use the global 30m The resolution of the NASA DEM.
//  Introduce data sources   The research area chooses my hometown, Sichuan Province
var dataset = ee.Image('NASA/NASADEM_HGT/001');
var elevation = dataset.select('elevation').clip(ROI);
//  Set visualization parameters
var elevationVis = {

  min: 0,
  max: 8000,
};
// visualization
Map.addLayer(elevation, elevationVis, 'Elevation');
Map.centerObject(ROI, 7);

(2) Color scheme
After the data is loaded , The color of the data is not good-looking , This is the time palette . There are several ways , One is in GEE Manual adjustment in DEM Show :

Another is that you can refer to other people's already set color palette , Call directly , Here I recommend one GitHub Warehouse ee-palettes(https://github.com/gee-community/ee-palettes):

The warehouse collects nearly 200 color schemes , stay GEE Can be called directly :

Call this repository , Just introduce the function library , then new A palette , And fill the color scheme into the map loading function , Pay attention to setting the maximum and minimum values . Then try one by one against the color table , Find the most suitable color scheme .
// Call the palette already configured in the warehouse
var palettes = require('users/gena/packages:palettes');

var palette_bamako = palettes.crameri.bamako[10,25,50];
Map.addLayer(elevation, {
    min:0, max:8000, palette: palette_bamako},  'crameri.bamako');

var palette_rainbow = palettes.kovesi.rainbow_bgyr_35_85_c72[7];
Map.addLayer(elevation, {
    min:0, max:8000, palette: palette_rainbow},  'palette_rainbow');

var palette_misc = palettes.misc.jet[7];
Map.addLayer(elevation, {
    min:0, max:8000, palette: palette_misc},  'palette_misc');

var palette_diverging = palettes.kovesi.diverging_linear_bjy_30_90_c45[7];
Map.addLayer(elevation, {
    min:0, max:8000, palette: palette_diverging},  'palette_diverging');

In the process of color matching , You can also note that the maximum and minimum values of the palette are different from each other DEM Show the impact . The highest altitude in Sichuan Province is 7556 rice , The lowest altitude is 188 rice . However, this does not mean that our color range should follow the maximum and minimum values , Because in color matching, if the pixel value is greater than max value , Then the color is the rightmost , The value will be adjusted automatically , If we can find the best range , The internal pixels are caused by height differences The contrast is more obvious , let me put it another way , The display effect is better when using most range of values .

According to the DEM Value distribution histogram , I made the following comparisons :
// Range comparison
//0-8000m
var palette_rainbow1 = palettes.kovesi.rainbow_bgyr_35_85_c72[7];
Map.addLayer(elevation, {
    min:0, max:8000, palette: palette_rainbow1},  'palette_rainbow1');
// Maximum and minimum
var palette_rainbow2 = palettes.kovesi.rainbow_bgyr_35_85_c72[7];
Map.addLayer(elevation, {
    min:188, max:7556, palette: palette_rainbow2},  'palette_rainbow2');
// The maximum and minimum values of the horizontal axis of the histogram
var palette_rainbow3 = palettes.kovesi.rainbow_bgyr_35_85_c72[7];
Map.addLayer(elevation, {
    min:451, max:4525, palette: palette_rainbow3},  'palette_rainbow3');
// The minimum value of the horizontal axis of the histogram is the same as 6000
var palette_rainbow4 = palettes.kovesi.rainbow_bgyr_35_85_c72[7];
Map.addLayer(elevation, {
    min:451, max:6000, palette: palette_rainbow4},  'palette_rainbow4');

How to choose the right Value range of palette , It is also an elegant drawing DEM An important factor in .
(3) Mountain shadow ;
A better DEM data source 、 palette 、 After value range , We can add mountain shadows to enhance DEM Display effect of . function ee.Terrain.hillshade(input,azimuth, elevation) Is the operator that generates mountain shadow ,input by DEM,azimuth It's azimuth ,elevation Is the height angle .

A bearing is the angular direction of the sun , Is based on the north direction in 0 To 360 Measured clockwise within degrees ,90º The azimuth of is East . Height refers to the angle or slope of the light source above the horizon . The unit of height is degrees , The scope is 0( On the horizon ) To 90( On the head ) Between . We need to pay attention to hillshade The value range of is 0-255.
// Mountain shadow
var palette_hillshade = palettes.crameri.bamako[10,25,50];
var exaggeration = 20;
var hillshade = ee.Terrain.hillshade(elevation.multiply(exaggeration),270,45);
Map.addLayer(hillshade, {
    min: 0, max: 255, palette: palette_hillshade},  'palette_hillshade');

azimuth
There are azimuth angles that affect the display effect of mountain shadow :
// Different azimuth angles
var palette_hillshade = palettes.crameri.bamako[10,25,50];
var exaggeration = 20;
var hillshade_45 = ee.Terrain.hillshade(elevation.multiply(exaggeration),45,15);
Map.addLayer(hillshade_45, {
    min: 0, max: 255, palette: palette_hillshade},  'palette_hillshade_45');
var hillshade_135 = ee.Terrain.hillshade(elevation.multiply(exaggeration),135,15);
Map.addLayer(hillshade_135, {
    min: 0, max: 255, palette: palette_hillshade},  'palette_hillshade_135');
var hillshade_225 = ee.Terrain.hillshade(elevation.multiply(exaggeration),225,15);
Map.addLayer(hillshade_225, {
    min: 0, max: 255, palette: palette_hillshade},  'palette_hillshade_225');
var hillshade_315 = ee.Terrain.hillshade(elevation.multiply(exaggeration),315,15);
Map.addLayer(hillshade_315, {
    min: 0, max: 255, palette: palette_hillshade},  'palette_hillshade_315');

GEE The default bearing for is 270º , The author can choose an appropriate azimuth according to his own needs .
Height angle
Different height angles will also affect the display effect of mountain shadow :
// Different height angles
var palette_hillshade = palettes.crameri.bamako[10,25,50];
var exaggeration = 20;
var hillshade_15 = ee.Terrain.hillshade(elevation.multiply(exaggeration),270,15);
Map.addLayer(hillshade_15, {
    min: 0, max: 255, palette: palette_hillshade},  'palette_hillshade_15');
var hillshade_30 = ee.Terrain.hillshade(elevation.multiply(exaggeration),270,30);
Map.addLayer(hillshade_30, {
    min: 0, max: 255, palette: palette_hillshade},  'palette_hillshade_30');
var hillshade_45 = ee.Terrain.hillshade(elevation.multiply(exaggeration),270,45);
Map.addLayer(hillshade_45, {
    min: 0, max: 255, palette: palette_hillshade},  'palette_hillshade_45');
var hillshade_60 = ee.Terrain.hillshade(elevation.multiply(exaggeration),270,60);
Map.addLayer(hillshade_60, {
    min: 0, max: 255, palette: palette_hillshade},  'palette_hillshade_60');
var hillshade_75 = ee.Terrain.hillshade(elevation.multiply(exaggeration),270,75);
Map.addLayer(hillshade_75, {
    min: 0, max: 255, palette: palette_hillshade},  'palette_hillshade_75');
var hillshade_90 = ee.Terrain.hillshade(elevation.multiply(exaggeration),270,90);
Map.addLayer(hillshade_90, {
    min: 0, max: 255, palette: palette_hillshade},  'palette_hillshade_90');


Generally speaking , The smaller the height angle , The stronger the mountain shadow effect , The height angle is gee Default is 45°.
Code link
https://code.earthengine.google.com/2e947952a68cb01eb63a247ec4424936
At the end
Summarize the following , Use elegantly GEE draw DEM:
First of all Select the data source , Select high-resolution for small study area DEM, Large study area can choose low resolution DEM;
The second is to choose well palette , Third party libraries are recommended here ee-palettes, Then, notice the maximum value range of the palette ;
The second is making Mountain shadow , Pay attention to selecting the appropriate sun altitude and azimuth .
This article just provides a production idea , Because the author's aesthetic level is limited , Readers don't have to follow my color scheme to make topographic maps , How to look how to come .

Reference resources
Clarmy Squeak . How to use Python Draw a cool three-dimensional topographic map
边栏推荐
- subject may not be empty [subject-empty]
- TKDE2022:基于知识增强采样的对话推荐系统
- NFT双币质押流动性挖矿系统开发
- 目前是不是只cdc 监控mysql 可以拿到新增列的数据 sqlserver不行是吧
- How to use R package ggtreeextra to draw evolution tree
- The group offsets of the Kafka of the Flink SQL. If the specified groupid is not mentioned
- Huawei machine learning service speech recognition function enables applications to paint "sound" and color
- 华为机器学习服务语音识别功能,让应用绘“声”绘色
- starring开发HttpJson接入点+数据库
- The sharp sword of API management -- eolink
猜你喜欢
Sr-gnn shift robot gnns: overlapping the limitations of localized graph training data

SaltStack State状态文件配置实例

three. Basic framework created by JS

R语言 4.1.0软件安装包和安装教程
论文解读(SR-GNN)《Shift-Robust GNNs: Overcoming the Limitations of Localized Graph Training Data》

Introduction and tutorial of SAS planet software
![subject may not be empty [subject-empty]](/img/6b/9b57a7ed3ab086036cb6dfe0b31de4.png)
subject may not be empty [subject-empty]

全链路业务追踪落地实践方案
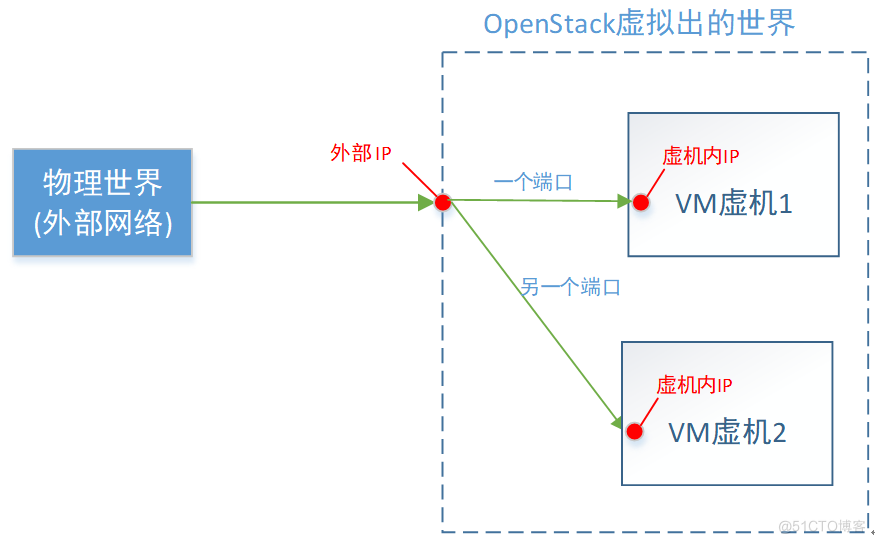
Understanding openstack network

对国产数据库厂商提几个关于SQL引擎的小需求
随机推荐
一文理解OpenStack网络
Volcano成Spark默认batch调度器
Why useevent is not good enough
Does version 2.2.0 support dynamic addition of MySQL synchronization tables
Fabric ledger data block structure analysis (I): how to analyze the smart contract transaction data in the ledger
Make track map
PingCAP 入选 2022 Gartner 云数据库“客户之声”,获评“卓越表现者”最高分
Ls common parameters
Xiaobai, let me ask you guys, is MySQL binlog extracted by CDC in strict order
一文理解OpenStack网络
假如,程序员面试的时候说真话
This is not safe
BSS应用程序云原生部署的8大挑战
应用实践 | 海量数据,秒级分析!Flink+Doris 构建实时数仓方案
NOKOV动作捕捉系统使多场协同无人机自主建造成为可能
想问下 pgsql cdc 账号同一个 多个 task 会有影响吗,我现在3个task 只有一个 有
cdc sql表里面的datetime要用什么类型替换
建立自己的网站(8)
R language 4.1.0 software installation package and installation tutorial
How to protect biological privacy in the AI era? Overview of the latest "privacy enhancement technology in biometrics" of the Autonomous University of Madrid, comprehensively detailing the biometric p