当前位置:网站首页>How to use R package ggtreeextra to draw evolution tree
How to use R package ggtreeextra to draw evolution tree
2022-06-24 19:14:00 【Yisu cloud】
How do you use it? R package ggtreeExtra Draw evolution tree
This article “ How do you use it? R package ggtreeExtra Draw evolution tree ” Most people don't quite understand the knowledge points of the article , So I made up the following summary for you , Detailed content , The steps are clear , It has certain reference value , I hope you can gain something after reading this article , Let's take a look at this article “ How do you use it? R package ggtreeExtra Draw evolution tree ” Article bar .
introduction
ggplot2 Provided geom_tile Layer can draw heat map ,ggplot2 Of geom_point perhaps ggstar Of geom_star You can draw point layers . In order to extend the ggtree Present relevant data on the outer ring of the phylogenetic tree in the point and layout , Developed ggtreeExtra Package provides a function ,geom_fruit Used to align the graph with the tree , The related charts will be aligned in different positions on the outer panel of the tree . Also developed geom_fruit_list Add multiple layers on the same external panel of the tree . Some functions are based on ggplot2 And support the use of graphical syntax .
Drawing examples
1、 Download and install ggtreeExtra package
if(!requireNamespace("remotes", quietly=TRUE)){ install.packages("remotes")}remotes::install_github("YuLab-SMU/ggtreeExtra")if (!requireNamespace("BiocManager", quietly=TRUE)) install.packages("BiocManager")BiocManager::install("ggtreeExtra")BiocManager::install("ggstar")# download "ggstar","ggplot2","ggtree","treeio","ggnewscale" package install.packages("ggstar")install.packages("ggplot2")install.packages("ggtree")install.packages("treeio")install.packages("ggnewscale")2、 Load dependent package
library(ggtreeExtra) # Set superimposed packages library(ggstar) # Provide Geometry library(ggplot2) # library(ggtree) # Draw evolution tree library(treeio)library(ggnewscale) # Create a new scale, Multiple fill perhaps color
3、 Set up the working directory
setwd("D:/R/ggtreeExtra")4、 Data sources
# Tree view data source path trfile <- system.file("extdata", "tree.nwk", package="ggtreeExtra")# Draw the data source path of point graph and histogram tippoint1 <- system.file("extdata", "tree_tippoint_bar.csv", package="ggtreeExtra")# The first layer outside the tree draws the heat map to the data source path ring1 <- system.file("extdata", "first_ring_discrete.csv", package="ggtreeExtra")# The second layer outside the tree draws the heat map to the data source path ring2 <- system.file("extdata", "second_ring_continuous.csv", package="ggtreeExtra")5、 get data
The tree file is using read . tree Imported . If there are other tree format files , have access to tree io Package to read .
tree <- read.tree(trfile)data = fortify(tree)head(data)

6、 Draw a tree view
# Visual evolutionary tree , The graph here is "fan", It can also be 'rectangular', 'dendrogram', 'slanted', 'ellipse', 'roundrect', 'circular', 'circular', 'inward_circular', 'radial', 'equal_angle', 'daylight' or 'ape'p <- ggtree(tree, layout="fan", open.angle=10, size=0.5)p

7、 Get data set plot
dat1 <- read.csv(tippoint1)knitr::kable(head(dat1))dat2 <- read.csv(ring1)knitr::kable(head(dat2))dat3 <-read.csv(ring2)knitr::kable(head(dat3))head(dat3)
dat1 Datasets are used to plot points and bars

dat2 Datasets are used to plot heat maps

dat3 Datasets are used to plot heat maps

a、 Draw a point layer
p2 <- p + geom_fruit( data=dat1, geom=geom_star, mapping=aes(y=ID, fill=Location, size=Length, starshape=Group), position="identity", starstroke=0.2 ) + scale_size_continuous( range=c(1, 3), # Size range guide=guide_legend( keywidth=0.5, # Box width 0.5 Keyheight=0.5, # Box width 0.5 override.aes=list(starshape=15), order=2 ) ) + scale_fill_manual( values=c("#F8766D", "#C49A00", "#53B400", "#00C094", "#00B6EB", "#A58AFF", "#FB61D7"), guide="none" ) + scale_starshape_manual( values=c(1, 15), guide=guide_legend( keywidth=0.5, keyheight=0.5, order=1 ) )p2
b、 Draw a hot layer
p3 <- p2 + new_scale_fill() + geom_fruit( data=dat2, geom=geom_tile, mapping=aes(y=ID, x=Pos, fill=Type),offset=0.08, # The distance between the outer layers , The default is the... Of the tree x Scope 0.03 times .pwidth=0.25 # The width of the outer layer , The default is the... Of the tree x Scope 0.2 times . ) + scale_fill_manual( values=c("#339933", "#dfac03"),guide=guide_legend(keywidth=0.5,keyheight=0.5, order=3) ) p3
c、 Draw a hot layer
p4 <- p3 + new_scale_fill() + geom_fruit( data=dat3, geom=geom_tile, mapping=aes(y=ID, x=Type2, alpha=Alpha, fill=Type2), pwidth=0.15, axis.params=list( axis="x", # Add the axis text of the layer text.angle=-45, #x Text angle of the axis hjust=0 # Adjust the horizontal position of the text axis ) ) + scale_fill_manual( values=c("#b22222", "#005500", "#0000be", "#9f1f9f"), guide=guide_legend(keywidth=0.5, keyheight=0.5, order=4) ) + scale_alpha_continuous(range=c(0, 0.4), # alpha The scope of the guide=guide_legend(keywidth=0.5, keyheight=0.5, order=5) ) p4
d、 Draw a columnar layer
p5 <- p4 + new_scale_fill() + geom_fruit( data=dat1, geom=geom_bar,mapping=aes(y=ID, x=Abundance, fill=Location), # dat 1 Of Abundance Will be mapped to x pwidth=0.4, stat="identity", orientation="y", # Axis direction axis.params=list( axis="x", # Add the axis text of the layer text.angle=-45, # The text size of the axis hjust=0 # Adjust the horizontal position of the axis text ), grid.params=list() # Add gridlines to the external bar chart ) + scale_fill_manual( values=c("#F8766D", "#C49A00", "#53B400", "#00C094", "#00B6EB", "#A58AFF", "#FB61D7"), guide=guide_legend(keywidth=0.5, keyheight=0.5, order=6) ) + theme(#legend.position=c(0.96, 0.5), # Legend location legend.background=element_rect(fill=NA), # Legend background legend.title=element_text(size=7), # Legend Title Size legend.text=element_text(size=6), # Legend text label size legend.spacing.y = unit(0.02, "cm") # Adjust the y The distance of the axis legend ) p5
That's about “ How do you use it? R package ggtreeExtra Draw evolution tree ” The content of this article , I believe we all have a certain understanding , I hope the content shared by Xiaobian will be helpful to you , If you want to know more about it , Please pay attention to the Yisu cloud industry information channel .
边栏推荐
- System design idea of time traceability
- 请问一下2.2.0版本支持动态新增mysql同步表吗
- Learn routing and data delivery
- Mqtt protocol usage of LabVIEW
- Volcano成Spark默认batch调度器
- Remote sensing Forum
- Does version 2.2.0 support dynamic addition of MySQL synchronization tables
- 上位机与MES对接的几种方式
- finkcdc支持sqlserver2008么?
- Introduction and tutorial of SAS planet software
猜你喜欢

Volcano成Spark默认batch调度器
Volcano becomes spark default batch scheduler
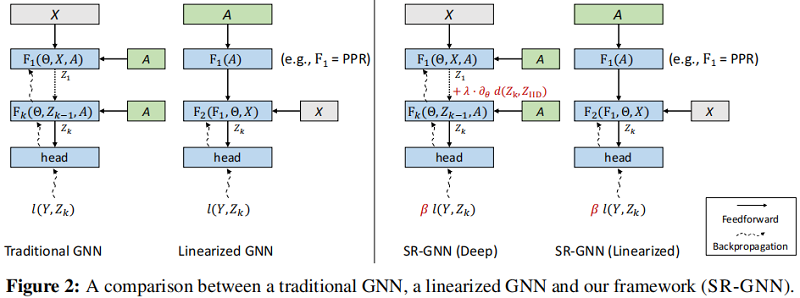
Interprétation de la thèse (SR - gnn) Shift Robust GNNS: Overcoming the Limits of Localized Graph Training Data

电源噪声分析

为什么生命科学企业都在陆续上云?
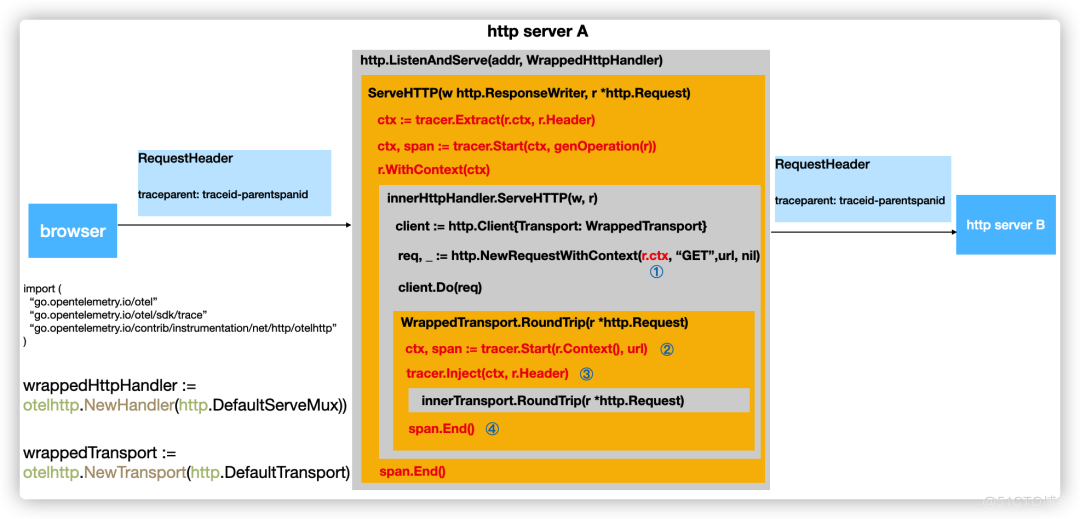
一文详解|Go 分布式链路追踪实现原理

Source code analysis of ArrayList
![[leetcode] rotation series (array, matrix, linked list, function, string)](/img/9e/079311df16fa8e28708f4e050e531f.png)
[leetcode] rotation series (array, matrix, linked list, function, string)
ArrayList源码解析

Generate the last login user account report of the computer through SCCM SQL
随机推荐
Volcano becomes spark default batch scheduler
The sharp sword of API management -- eolink
Why useevent is not good enough
NFT pledge liquidity mining system development technology
Necessary fault handling system for enterprise network administrator
Sr-gnn shift robot gnns: overlapping the limitations of localized graph training data
Real time rendering: the difference between real-time, offline, cloud rendering and hybrid rendering
Application scenarios of channel of go question bank · 11
flink-sql的kafka的这个设置,group-offsets,如果指定的groupid没有提
How to perform robust regression in R
How do programmers do we media?
Xiaobai, let me ask you guys, is MySQL binlog extracted by CDC in strict order
Introduction and download tutorial of two types of soil data
A detailed explanation of the implementation principle of go Distributed Link Tracking
Introduction, download and use of global meteorological data CRU ts from 1901 to 2020
Using alicloud RDS for SQL Server Performance insight to optimize database load - first understanding of performance insight
优维低代码:构件渲染子构件
使用阿里云RDS for SQL Server性能洞察优化数据库负载-初识性能洞察
UnityShader 世界坐标不随模型变化
Introduction and download tutorial of administrative division vector data