当前位置:网站首页>How to use dataant to monitor Apache apisex
How to use dataant to monitor Apache apisex
2022-06-28 20:30:00 【ApacheAPISIX】
Background information
Apache APISIX Is an open source cloud native API gateway , As API gateway , It's dynamic 、 real time 、 High performance and so on , Provides load balancing 、 Dynamic upstream 、 Grayscale Publishing 、 Service failure 、 Identity Authentication 、 Observability and other rich traffic management functions . You can use Apache APISIX To handle the traditional north-south flow , And the East-West flow between services , You can also think of it as K8s Ingress controller To use . Thanks to the APISIX Fully dynamic design , Configuration changes can be made at any time without restarting the service .
DataAnt The whole stack cloud monitoring system can summarize through big data and machine learning IaaS、PaaS and SaaS All operation and maintenance data of layer , Provide users with a unified visual interface . DataAnt Allows users to move seamlessly and quickly between related monitoring data sources , Without switching tools , Learn more about yourself IT The state of the system . It provides DataAnt Agent It can be monitored in real time APISIX And upload its monitoring data to DataAnt PaSS platform , Realize one-stop monitoring in the cloud .
Introduction of the principle

One 、 Collection configuration
DataAnt Agent First it will pass config.yaml The configuration of APISIX Item to initialize and register the collector . same Agent You can register multiple collectors . The collector collects APISIX After exposure to indicators , Encrypt the index data and upload it to DataAnt Cloud.
Two 、 Data visualization
DataAnt Cloud After receiving the data , The data will be stored in the time series database after preliminary monitoring information supplement and processing , And then you can go through DataAnt Of Dashboard Real-time monitoring APISIX.
3、 ... and 、 Warning notice
The data will also be distributed to alarm matching processing through messages , Then the notification aggregation is performed, and finally the alarm is sent through the configured notification mode , That is, it can receive in real time APISIX Abnormal conditions of .
Configuration Guide
First visit DataAnt Cloud, Register your account and log in to the platform .
Get it from the following network disk link DataAnt Of Agent, Upload to after downloading APISIX On the same machine and add execution permission .
Extract the link : https://pan.baidu.com/s/1fabvSiDLDh8ZRTjpzINHLg
Extraction code : 87d4
Create in current directory DataAnt Agent Required profile
./config.yaml. The detailed configuration is as follows :
tenantId: 11       #  The  ID  It's yours  DataAnt  Users of the platform  ID.
hostIp: 127.0.0.1  #  Identification of the host  IP
hostName: apisix
configs:
 - uri: http://127.0.0.1:9091  # APISIX  Ports exposed by monitoring indicators .
   type: apisix                #  Monitoring type selection  APISIX
   asName: apisix_test         #  Alias
   user: admin                 #  The user name can be omitted
- Start with the following command Agent.
./agent
After successful startup , The following data will be returned :
2022/06/21 20:50:10 {"code":200,"msg":" The request is successful ","data":null}
2022/06/21 20:50:30 {"code":200,"msg":" The request is successful ","data":null}
2022-06-21 20:51:00:000        INFO        apisix/apisix.go:25         Obtain the corresponding monitoring data , Data length 1675
2022-06-21 20:51:00:000        INFO        prometheus/prometheusCollector.go:43         Get the corresponding monitoring data and start parsing 1675
2022-06-21 20:51:00:000        INFO        prometheus/prometheusCollector.go:43         Obtain the corresponding monitoring data to complete the analysis   Number of analytical indicators 21
2022-06-21 20:51:00:000        INFO        collector/collector.go:82        apisix Amount of data collected 21
2022-06-21 20:51:00:000        INFO        runtime/asm_amd64.s:1581        apisix_test9091: Number of indicators :21
stay DataAnt Click Install integration plug-in on the platform homepage > Monitor plug-ins , choice APISIX, And click
To configureUnder theClick configuration.stay DataAnt On the platform home page, click the dashboard in the left navigation bar and create a new dashboard .
Choose the indicators you need , And drag it onto the dashboard , The indicators of configuration completion are as follows :

matters needing attention
DataAnt Agent every other 30 The data will be reported once every second , So there will be some delay .
summary
This article mainly introduces how to pass DataAnt Agent Upload APISIX The index data of DATA ANT In the monitoring system , You can use it later , Configure relevant alarm rules and alarm contacts , When the service fails , I can inform you in time .
边栏推荐
- List of domestic database directory
- 请允许当下国内ToB的「不完美」
- Lecture 30 linear algebra Lecture 4 linear equations
- RT thread thread synchronization and thread communication
- TcWind 模式设定
- [learning notes] Introduction to principal component analysis
- head、tail查看文件
- SaaS sales upgrade under the new situation | tob Master Course
- 请问同业存单是否靠谱,安全吗
- Relevant calculation of sphere, etc
猜你喜欢
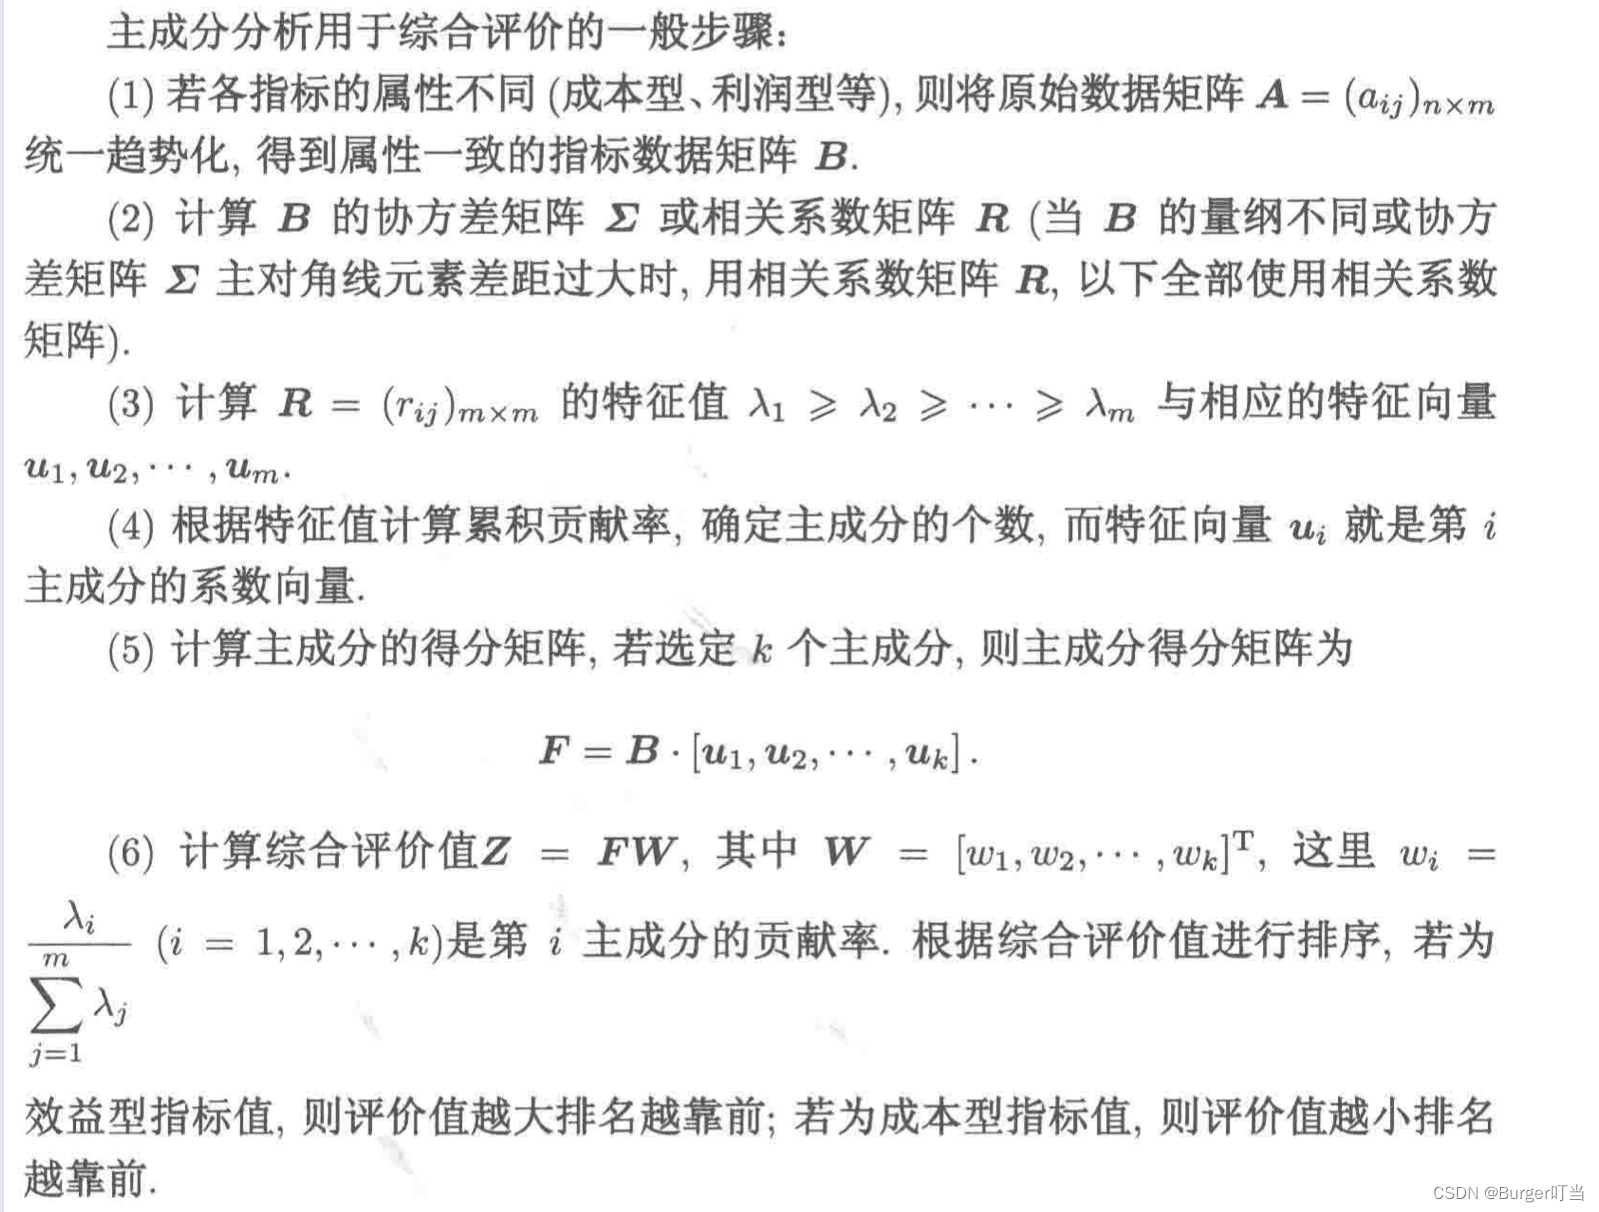
【学习笔记】主成分分析法介绍
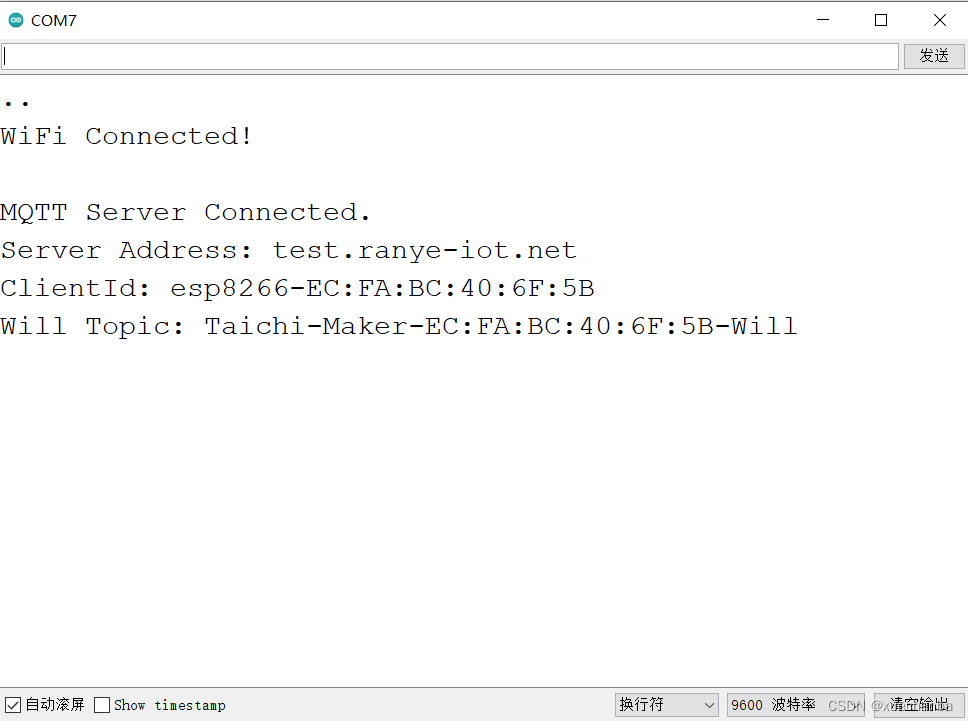
学习太极创客 — MQTT 第二章(七)ESP8266 MQTT 遗嘱应用

Learn Tai Chi maker mqtt Chapter 2 (VIII) esp8266 mqtt user password authentication
How to recover after Oracle delete accidentally deletes table data

Flatten of cnn-lstm

with torch. no_ Grad(): reason for using

Lecture 30 linear algebra Lecture 4 linear equations
![[try to hack] cobalt strike (I)](/img/2b/5d274078b7d7ebd05b7c6d9e020868.png)
[try to hack] cobalt strike (I)

Leetcode 36. Effective Sudoku (yes, once)

应用实践 | 10 亿数据秒级关联,货拉拉基于 Apache Doris 的 OLAP 体系演进(附 PPT 下载)

随机推荐
【学习笔记】主成分分析法介绍
Tcwind mode setting
ThreadLocal principle
Troubleshooting of pyinstaller failed to pack pikepdf
不同框架的绘制神经网络结构可视化
With a market value of $120billion, how did intuit, an old tax giant, do it?
two thousand three hundred and forty-two
Flask——总结
2837. The total number of teams
应用实践 | 10 亿数据秒级关联,货拉拉基于 Apache Doris 的 OLAP 体系演进(附 PPT 下载)
Compression and decompression commands
Characters and integers
UESTC (shenhengtao team) & JD AI (Mei Tao team) proposed a structured dual stream attention network for video Q & A, with performance SOTA! Better than the method based on dual video representation
LeetCode每日一题——710. 黑名单中的随机数
SaaS sales upgrade under the new situation | tob Master Course
API 网关 Apache APISIX 助力雪球双活架构演进
Real number operation
ANR分析--问题1
Understand the construction of the entire network model
TcWind 模式設定