当前位置:网站首页>太帅了!我用炫酷大屏展示爬虫数据!
太帅了!我用炫酷大屏展示爬虫数据!
2022-08-02 10:10:00 【AI科技大本营】

作者 | 派森酱
来源 | Python技术
大屏有时纯粹是为了好看,领导的说法是“花花绿绿的效果不错”。尤其放到展厅里,整面墙壁都是大屏那种,色彩十分艳丽。
我尝试了一下。不是专业的前端,所以用vue模板修改,前后端分离。
后端使用fastapi,爬取的数据存入数据库。效果图如下,点击看全屏效果
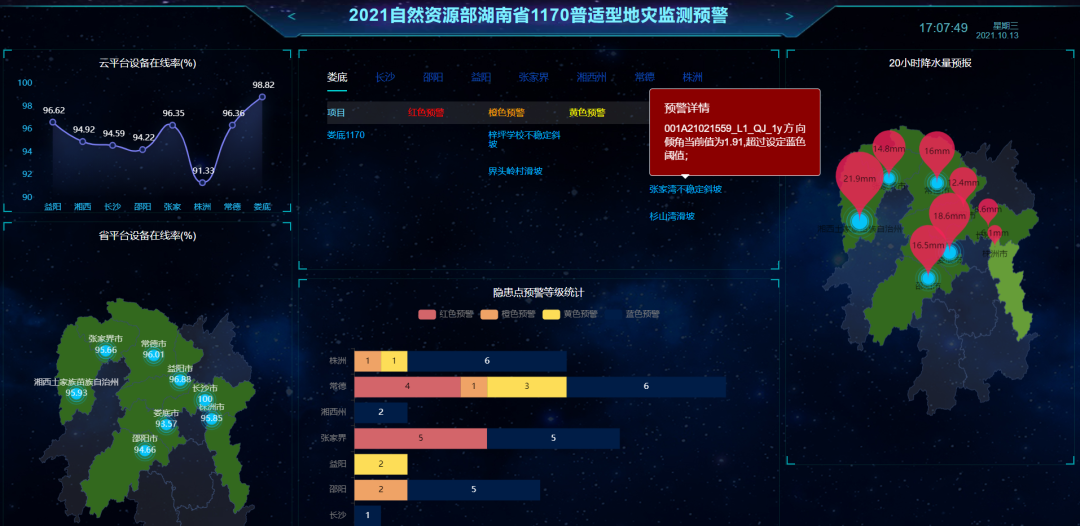
下面这张是网上下载的vue大屏,我根据它来修改的
修改内容包括:
更换背景大图,形成"暗黑"星空风格
Apache ECharts官网找适合的效果图,并修改
删除词云和中间的飞行地图等,把自己的内容排版进去

数据来源
说明
这里只介绍右边的“降水量预报”。值越大,气球越大
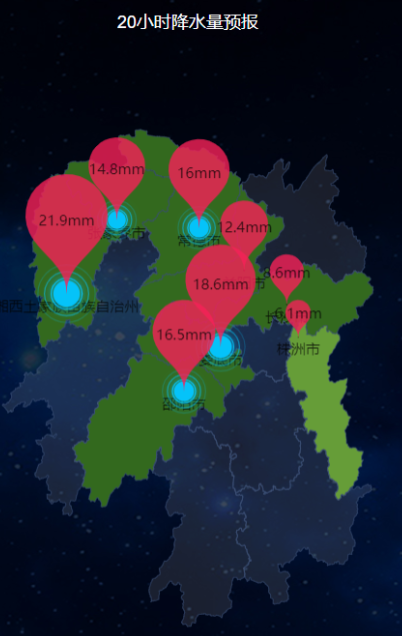
采用scrapy爬取数据
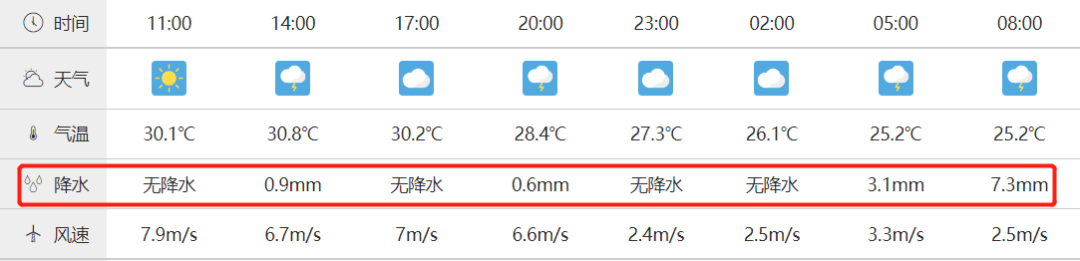
数据爬自weather.cma.cn
定义要爬的url,降水量相加得到某地未来一天的降雨量
运行过程
爬虫脚本
参考 ssw的小型文档网站
后端接口
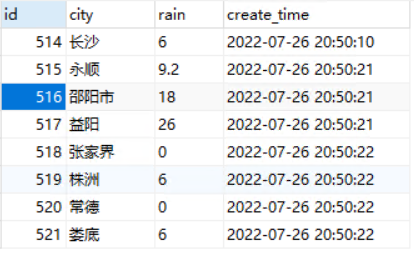
数据库的爬虫数据
fastapi
接口url:
http://localhost:5000/rain/
脚本:
from fastapi import FastAPI
from fastapi.responses import JSONResponse
import pymysql
app = FastAPI()

def conn_mysql(sql):
    dbparam = {
        'host': '127.0.0.1',
        'port': 3306,
        'user': 'root',
        'password': '1024',
        'database': 'alerts',
        'charset': 'utf8'
    }
    conn = pymysql.connect(**dbparam)
    cursor = conn.cursor()

    try:
        cursor.execute(sql)
        res = cursor.fetchall()
    except Exception as e:
        print('入库失败', e)
        conn.rollback()
    finally:
        cursor.close()
        conn.close()
        return res

def get_rains_from_db():
    sql = 'SELECT city,rain from rains'
    res = conn_mysql(sql)
    return res

@app.get('/rain')
def rain():
    res = get_rains_from_db()
    for i in res:
        city = i[0].strip()
        if (city == '益阳'):
            yys = i
        elif (city == '永顺'):
            xxz = i
        elif (city == '长沙'):
            css = i
        elif (city == '张家界'):
            zjjs = i
        elif (city == '邵阳市'):
            sys = i
        elif (city == '株洲'):
            zzs = i
        elif (city == '常德'):
            cds = i
        elif (city == '娄底'):
            ld = i
    return JSONResponse({'data': {'ld': ld, 'css': css, 'sys': sys, 'yys': yys, 'zjjs': zjjs,
                                  'xxz': xxz, 'cds': cds, 'zzs': zzs}})
前端展示
vue部分目录结构
文件已上传,下载地址
.
├── public
│   └── json
│       └── 430000.json
└── src
    ├── api
    │   ├── http.js
    │   ├── index.js
    │   └── options.js
    ├── components
    │   ├── companySummary
    │   │   └── rain.vue
    │   └── index.js
    ├── main.js
    ├── router
    │   └── index.js
    └── views
        └── alerts.vue
文件说明
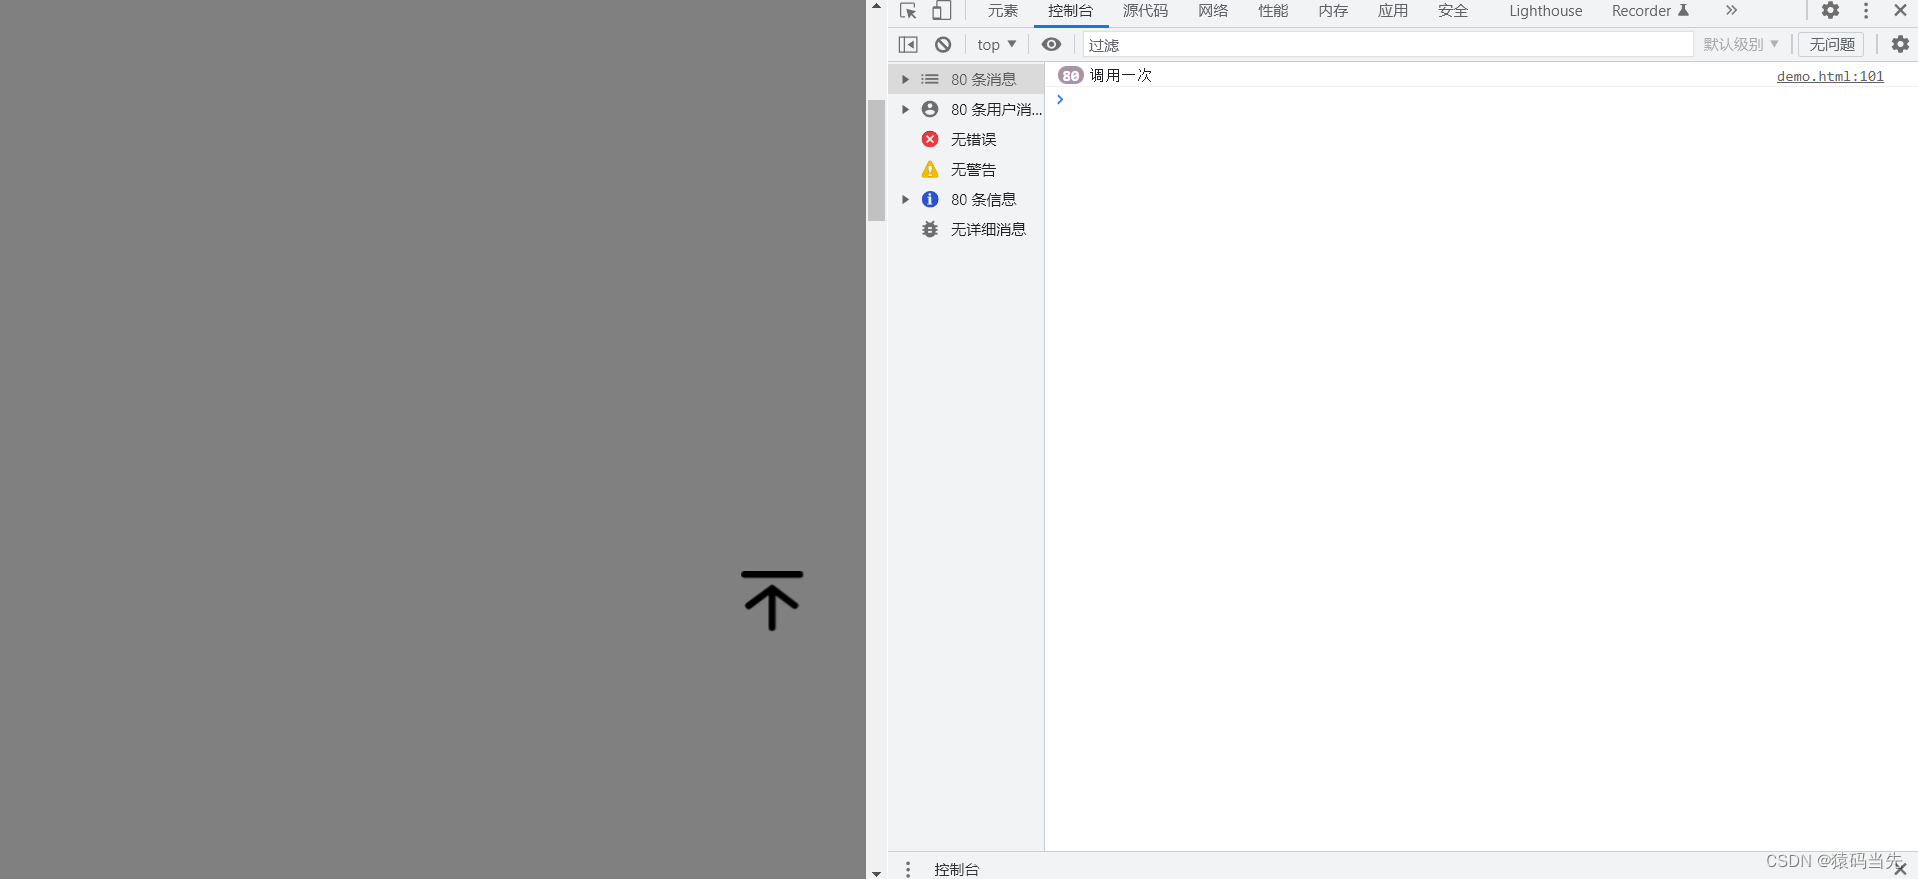
router/index.js
编写路由
const routes = [
  {
    path: '/alerts',
    name: 'alerts',
    component: () => import('@/views/alerts.vue'),
    meta: {
      title: '告警'
    }
  },
]
main.js
导入router/index.js中的路由
导入components/index.js中定义的组件,方便其它文件引用。如 在alerts.vue中写上
<rain />即可引用
import Vue from 'vue'
import router from './router'
import Vcomp from './components/index' //
Vue.use(Vcomp)
components/index.js
组件在这个文件进行汇总
import rain from './companySummary/rain' //区域雨量
const components = {
    rain, //指components/companySummary/rain.vue
}

const Vcomp = {
  ...components,
  install
};


export default Vcomp
components/companySummary/rain.vue
import {mapOptions} from '@/api/options.js'
export default {
  name: 'rain',
}
views/alerts.vue
这里引用rain.vue组件
...省略
    <div class="panel">
      <h2>20小时降水量预报</h2>
      <rain />
      <div class="panel-footer"></div>
    </div>
...省略
api/index.js
向fastapi接口发送请求
export const rainInfo = (params) => {
    return axios.get('http://localhost:5000/rain/')
}
api/options.js
向fastapi接口发送请求
mapOptions在rain.vue被引用,被apache echarts使用
$.ajax({
    type: "GET",
    url: "http://localhost:5000/rain/",
    dataType: 'json',
    async:false,
    success: function (res) {
        var xxx = [
            {name: '娄底市', value: parseFloat(res.data.ld[1])},
            {name: '长沙市', value: parseFloat(res.data.css[1])},
            {name: '邵阳市', value: parseFloat(res.data.sys[1])},
            {name: '益阳市', value: parseFloat(res.data.yys[1])},
            {name: '张家界市', value:  parseFloat(res.data.zjjs[1])},
            {name: '湘西土家族苗族自治州', value:  parseFloat(res.data.xxz[1])},
            {name: '常德市', value:  parseFloat(res.data.cds[1])},
            {name: '株洲市', value:  parseFloat(res.data.zzs[1])},
        ];
    }})
export function mapOptions(mapType) {
    var geoCoordMap = { //坐标数据
        '娄底市':[112.008497,27.728136],
        '长沙市':[112.982279,28.19409],
        '邵阳市':[111.46923,27.237842],
        '益阳市':[112.355042,28.570066],
        '张家界市':[110.479921,29.127401],
        '湘西土家族苗族自治州':[109.739735,28.314296],
        '常德市':[111.691347,29.040225],
        '株洲市':[113.151737,27.835806],
    };
    ...省略
}
总结
通过这次尝试,简单实现了大屏效果。条形图、折线图、飞行地图、词云等,还可以去Apache ECharts官网找资源加入到大屏。如果你对threejs很了解,甚至可以把它的3D效果加入进来
有些大屏用html编写,一大段一大段的代码让人失去修改的兴趣,相比来说vue更简洁、代码少、修改快。

往期回顾
分享
点收藏
点点赞
点在看边栏推荐
- 8月份的.NET Conf 活动 专注于 .NET MAUI
- Implementation of mysql connection pool
- Facebook's automated data analysis solution saves worry and effort in advertising
- 从零开始入门单片机(一):必会背景知识总结
- R语言ggpubr包的ggline函数可视化分组折线图、add参数为mean_se和dotplot可视化不同水平均值的折线图并为折线图添加误差线(se标准误差)和点阵图、自定义palette设置颜色
- QT专题:事件机制event基础篇
- R语言ggplot2可视化:使用ggpubr包的ggbarplot函数可视化水平柱状图(条形图)、使用orientation参数设置柱状图转置为条形图
- armv7与armv8的区别(v8和w12的区别)
- 程序员的浪漫七夕
- Event 对象,你很了解吗?
猜你喜欢
MySql tens of millions of paging optimization, fast insertion method of tens of millions of data

软件测试之发现和解决bug

This article takes you to understand the commonly used models and frameworks of recommender systems
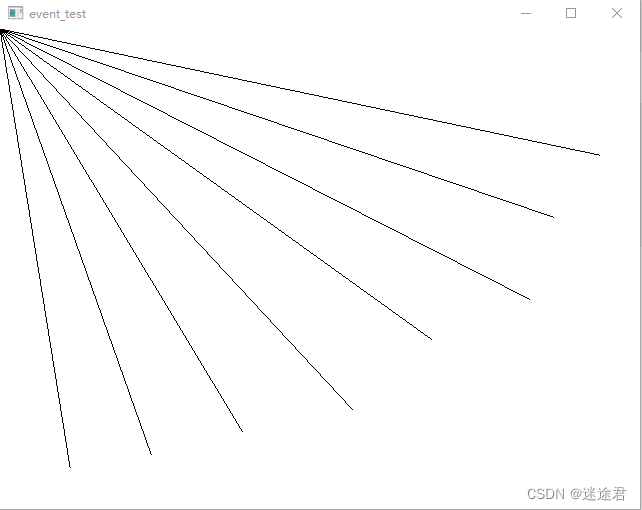
QT专题:事件机制event基础篇

Use compilation to realize special effects of love
js防抖函数和函数节流的应用场景

Supervised learning of Li Hang's "Statistical Learning Methods" Notes

日元疲软令游戏机在日本变身“理财产品”:黄牛大赚

你好,我的新名字叫“铜锁/Tongsuo”
【技术分享】OSPFv3基本原理
随机推荐
阿里CTO程立:阿里巴巴开源的历程、理念和实践
【技术分享】OSPFv3基本原理
全新荣威RX5,27寸大屏吸引人,安全、舒适一个不落
练习16-两道模拟题
sqlmap安装教程用w+r打开(sqlyog安装步骤)
8月份的.NET Conf 活动 专注于 .NET MAUI
第十七章 Excel操作
LayaBox---TypeScript---Mixins
链表的实现
The love-hate relationship between C language volatile keyword, inline assembly volatile and compiler
R language time series data arithmetic operation: use the log function to log the time series data, and use the diff function to calculate the successive difference of the logarithmic time series data
Geoffery Hinton:深度学习的下一个大事件
享年94岁,图灵奖得主、计算复杂性理论先驱Juris Hartmanis逝世
日元疲软令游戏机在日本变身“理财产品”:黄牛大赚
LayaBox---TypeScript---声明合并
Implementation of mysql connection pool
wireshark的安装教程(暖气片安装方法图解)
要长续航还是更安全?海豹与深蓝SL03对比导购
用汇编实现爱心特效【七夕来袭】
Facebook's automated data analysis solution saves worry and effort in advertising