当前位置:网站首页>Case: drawing Matplotlib dynamic graph
Case: drawing Matplotlib dynamic graph
2022-06-26 00:55:00 【Algorithm channel】
Study zhenguo The teacher's Python Class has been a week , I feel that I have learned a lot , Just yesterday, the teacher sent a message in the receiving group 100 List of dollars , I answered without hesitation , Not only can we test whether we can apply what we have learned , And make money from crawfish (50 element ~).
Development requirements
The requirements of this list , It's using Python Medium matplotlib Library to draw dynamic line graph , The requirements description is simple and easy to understand , But it also needs to be analyzed .
Matplotlib library
This library is Python One of the necessary libraries for data development , Its main function is to draw charts , And the implementation is also very simple , A few lines of code can draw a histogram 、 Broken line diagram 、 Scatter plot 、 Pie charts and other commonly used charts , Some complex data analysis charts, it can also be competent .
Share a website here : www.matplotlib.org.cn/gallery/#lines-bars-and-markers, You can see that Matplotlib Some cases of drawing , As a reference for their own development .
Core issues
Matplotlib Library to draw a static line chart is relatively simple , Given X Axis and Y The axis data set is OK , But I want to draw a dynamic line chart , We must find a way to make the drawn picture move .
In fact, this problem is not difficult to understand ,Matplotlib Drawing is to generate a picture , The principle of making it move is like animation , Constantly generate new pictures , Connect them back and forth , Just play it frame by frame .
The development process
Understand the core issues , You can start to solve the problem .
Load data
Before drawing , First get the data set to , The demand side gave a sheet excel form , You need to extract the required data set from the table .
This process is also relatively simple , Need to use Python Another library for data analysis Pandas .
Just one line of code pandas.read_excel('data.xls'), You can put the excel File loaded into memory .
Then you can operate like dict Get the data set of each column , Such as :cls = pandas.read_excel('data.xls')[' Column header name '], You'll get one <class 'pandas.core.series.Series'> object , You can directly traverse each row of data , You can also convert the format to a list type .
Draw a line
Once you have the data , You can draw , First draw a broken line , Present the existing data , Look at the effect .
import matplotlib.pyplot as plt
import data

fig, ax = plt.subplots(figsize=(16, 9), dpi=80)
ax.set_ylim(0, 35)
ax.set_xticks(range(0, len(xdata), 10))

xdata = data.times
ydata = data.dealnums
ax.plot(xdata, ydata)

fig.autofmt_xdate()
plt.show()
Simple code , The following is the line chart drawn :

Let the broken line move
What to do next , Is to make the line chart move , Keep showing new data .
To achieve this effect , You need to do two things , First, let the data move , Add new data to the data set , The second is to make the drawing move at a specified time interval .
First action , Here's how I do it , Go straight to the code :
for x, y in zip(xdata_set, ydata_set):
    xdata.append(x)
    ydata.append(y)
That is to split the original data set into a single data , Load into one by one X Axis and Y Axis data set , Realize the effect of dynamic data increase .
Second operation , The first thing I thought of , Every time the data is updated , Empty the entire canvas , Redraw the latest chart .
for x, y in zip(xdata_set, ydata_set):
    xdata.append(x)
    ydata.append(y)

    plt.clf()  #  Empty the whole figure

    #  Reestablish the coordinate axis and draw a line chart
    ax = fig.add_subplot(1, 1, 1)
    ax.plot(xdata, ydata)

    plt.pause(1) #  Sleep 1 Draw a new picture in seconds
There is one more point to pay attention to , Is to call at the beginning plt.ion() Method , Start interactive mode .
This method cannot directly save the image as a moving picture , So there's no way to show , The effect is the same as that of the following moving pictures .
New idea of dynamic diagram
After completing the requirements details according to the above ideas , I submitted the code to zhenguo teacher , The teacher not only gave affirmation and encouragement , It also provides a new idea .
That is to use Matplotlib Animation module to draw dynamic graph .
Quickly find the documents of relevant modules and methods to learn , Finally found , Just use one animation.FuncAnimation Class can meet the requirements of this list .
And this class is very convenient to use , Pass... In the build function figure object 、 Functions that update charts 、 Just initialize the function and interval parameters .
import matplotlib.animation
import matplotlib.pyplot as plt
import data

fig = plt.figure(figsize=(16, 9), dpi=70)

def draw_line(fig, x_data, y_data):
    ax = fig.add_subplot(1, 1, 1)
    ax.plot(xdata, ydata)
    return ax

def init_figure():
    #  Draw the initial chart
    xdata = data.times
    ydata = data.dealnums

    return draw_line(fig, xdata, ydata)

def update(n):
    #  Update data set  xdata  and  ydata
    xdata = data.new_times
    ydata = data.new_dealnums
    #  Clear the previous coordinate system
    plt.clf()
    #  Draw the latest line chart
    return draw_line(fit, xdata, ydata)

ani = animation.FuncAnimation(fig, update, init_func=init_figure, interval=1000)

#  Generate  gif  Move and save
ani.save('test.gif', writer='pillow')

plt.show()
The modified code is also very simple and clear , It can also save the generated dynamic graph .
Finally, improve some requirements and code details , The end result is this :
Isn't it cool !
To study the Python after , Found many interesting programming directions , Drawing development is only a small part of the macro blueprint .
Through this list , I made a breakthrough from eye meeting to hand meeting , Not only for Matplotlib Library has a deeper understanding , what's more !
The crayfish is available tonight !
边栏推荐
- SQL to retain the maximum value sorted by a field
- mongodb
- [understanding of opportunity -30]: Guiguzi - internal "chapter - empathy, stand on the other side's position and narrow the psychological distance with the other side
- 信号处理函数内必须使用可重入函数
- Comprehensive introduction to Simulink solver
- Example: use C # Net to teach you how to develop wechat official account (21) -- using wechat to pay online collection: H5 method
- Motor monitoring system based on MCGS and stm32
- Explain from a process perspective what happens to the browser after entering a URL?
- Middle order clue binary tree
- "Method not allowed", 405 problem analysis and solution
猜你喜欢

STL tutorial 5-basic concepts of STL and the use of string and vector

Analyze the five root causes of product development failure

Permission design = function permission + Data permission

86. (cesium chapter) cesium overlay surface receiving shadow effect (gltf model)
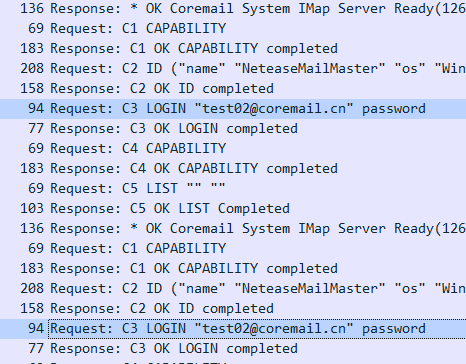
Wireshark's analysis of IMAP packet capturing

“Method Not Allowed“,405问题分析及解决

ciscn_ 2019_ en_ two

jarvisoj_ level2_ x64

How product managers control the progress of product development

STM32 uses SPI mode to drive TFT-LCD optimization code of hx8347 scheme
随机推荐
[image detection] vascular tracking and diameter estimation based on Gaussian process and Radon transform with matlab code
mtb13_ Perform extract_ blend_ Super{candidate (primaryalternate) \u unique (nullable filtering \foreign\index\granulati
Preordered clue binary tree
86. (cesium chapter) cesium overlay surface receiving shadow effect (gltf model)
【图像检测】基于高斯过程和Radon变换实现血管跟踪和直径估计附matlab代码
Graduation season | fitting the best self in continuous exploration
Flink reports error: a JNI error has occurred, please check your installation and try again
Learn to identify follow-up questions in dialogue Q & A
leetcode. 14 --- longest public prefix
ADC acquisition noise and comparison between RMS filter and Kalman filter
使用VS2022編譯Telegram桌面端(tdesktop)
. user. PHP website installation problems caused by INI files
“Method Not Allowed“,405问题分析及解决
关于HC-12无线射频模块使用
mongodb
Analyze the five root causes of product development failure
认识map
FPGA notes -- implementation of FPGA floating point operation
简单 deepclone
Login interceptor