当前位置:网站首页>[performance test] jmeter+grafana+influxdb deployment practice
[performance test] jmeter+grafana+influxdb deployment practice
2022-07-05 19:02:00 【bulabula2022】
Jmeter Configure the test results to be automatically sent to influxdb
There's a lot of information online ,jmeter Configuration is not described in detail here
If you want to Grafana More flexible display of data , Need to be right jmeter Plug in secondary development , Automatically store the test data into influxdb Time series database , stay grafana Panel customization sql Inquire about , Automatically display the desired data ,grafana The panel also needs secondary development according to the display needs
influxDB Deploy
1.linux Specify the directory to download InfluxDB
Download address :wget https://dl.influxdata.com/influxdb/releases/influxdb-1.8.4.x86_64.rpm
2. install InfluxDB:
yum localinstall influxdb-1.8.4.x86_64.rpm, Two main file locations

3. Change the service startup configuration :vim influxdb.service
1) take User and Group Value changed to root
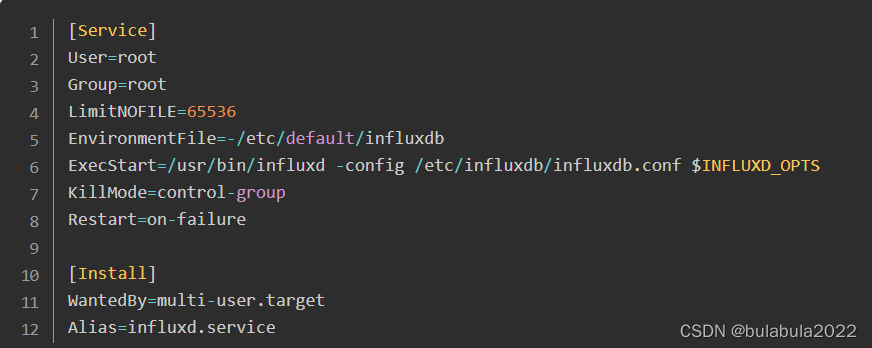
2)influxdb.service file Restart the effective service command :systemctl daemon-reload
4. modify influxDB The configuration file
Carry out orders :vi /etc/influxdb/influxdb.conf, The final modified configuration is as follows :
[[graphite]]
# Determines whether the graphite endpoint is enabled.
enabled = true
database = "jmeter" # Database name
retention-policy = ""
bind-address = ":2003" # port
protocol = "tcp"
consistency-level = "one"
……
[http]
# Determines whether HTTP endpoint is enabled.
enabled = true
# The bind address used by the HTTP service.
bind-address = ":8086"
Execute after modification :wq Save and exit
5. start-up Influxdb service
1) Temporary start up :systemctl start influxdb
2) Boot up :systemctl enable influxdb
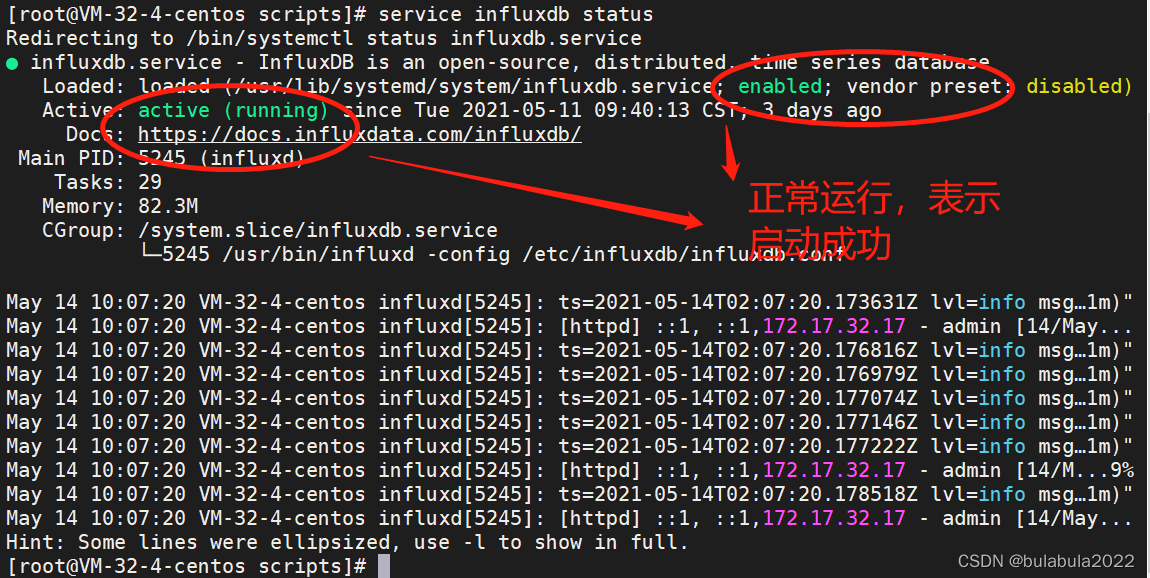
3) View running status :ps -ef | grep -i "influx" perhaps service influxdb status
4) restart :service influxdb restart
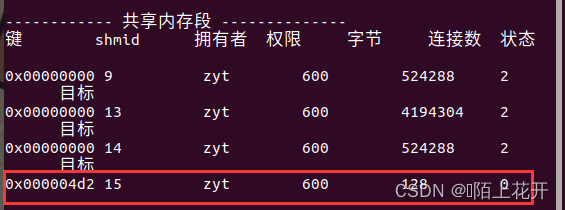
influxDB Of tcp The default listening port is 8088, perform :netstat -antp|grep 8088, The following display indicates that the port is restarted successfully

attach influxdb Some port descriptions
start-up influxdb database :
service influxdb start
stop it influxdb database :
service influxdb stop
Port specification
8083: visit web Address of the page ,8083 Is the default port ;1.4 Version this feature is deprecated , Change it to Chronograf
8086: Data writing influxdb The address of ,8086 Is the default port ;
8088: Data backup and recovery address ,8088 Is the default port ;
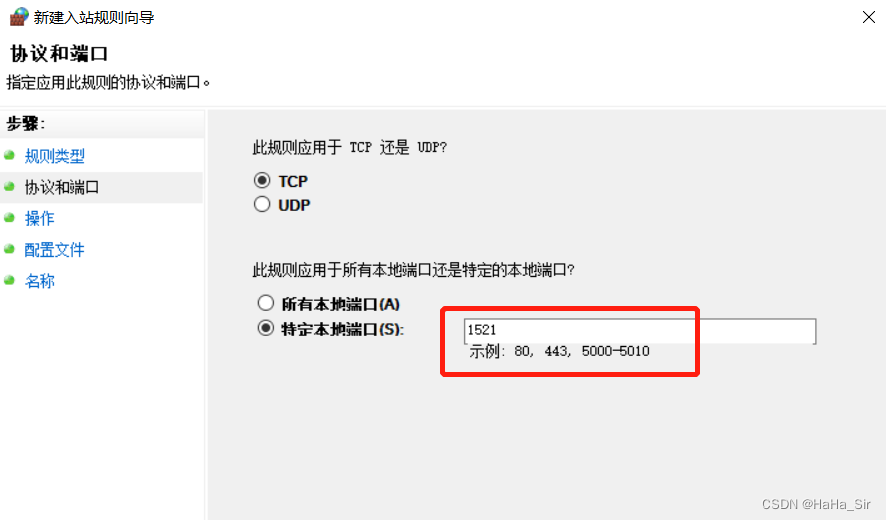
If linux Turn on the firewall , Need to open 8086 port , The order is as follows :
firewall-cmd --add-port=8086/tcp --permanent
firewall-cmd --add-port=8086/udp --permanent
firewall-cmd --reload
6. Create databases and users
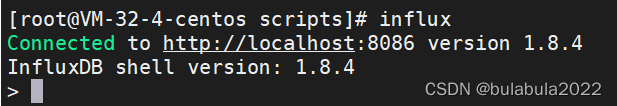
1) Get into influx command :influx
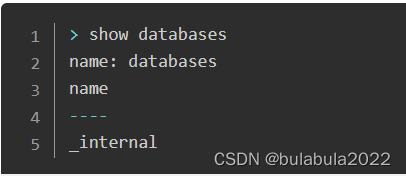
2) Display database , and mysql similar :show databases
3) Create database : CREATE DATABASE jmeter( Library name )
> CREATE DATABASE jmeter
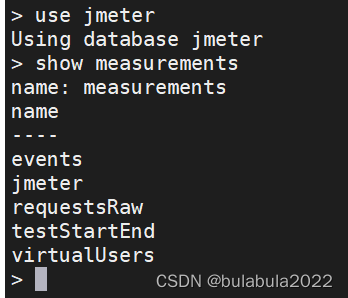
> use jmeter
> create user "admin" with password ' admin ' with all privileges
The user name and password set here need to be recorded , Later configuration JMeter and Grafana When it comes to
notes : Pay attention here ,CREATE DATABASE You have to use uppercase
Port specification :
2003 port :Jmeter The port to send data to the database , The server side also receives data through this port , Therefore, the server needs to open this 2003 port
8086 port ,Grafana or Chronograf from influxdb The port on which the database fetches data
4) Switch database :use jmeter( Library name ); Show me the table :show measurements
Grafana Deploy
Grafana It's one for Go Language development of open source data visualization tools , Can do data monitoring and data statistics , With alarm function
windows Version installation
1、 Official website download address :Download Grafana | Grafana Labs
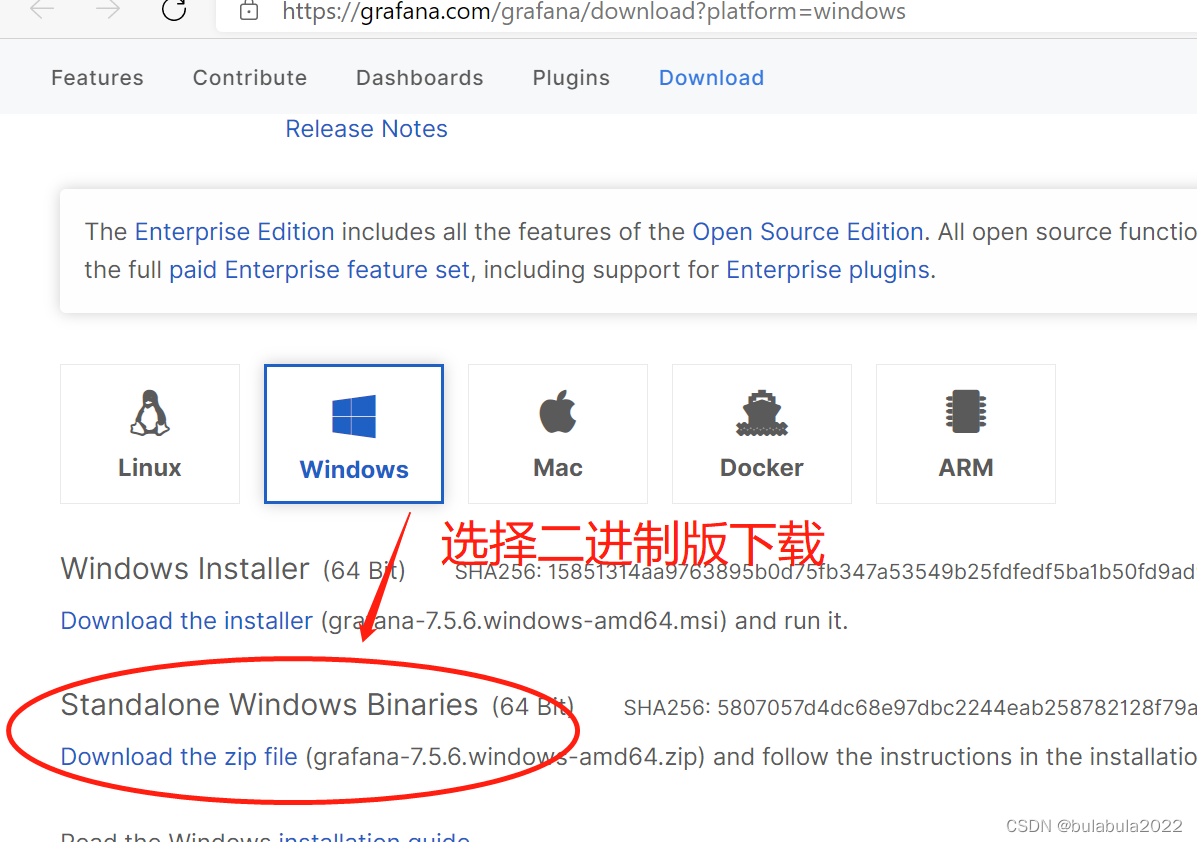
2、 Unzip it to the installation folder
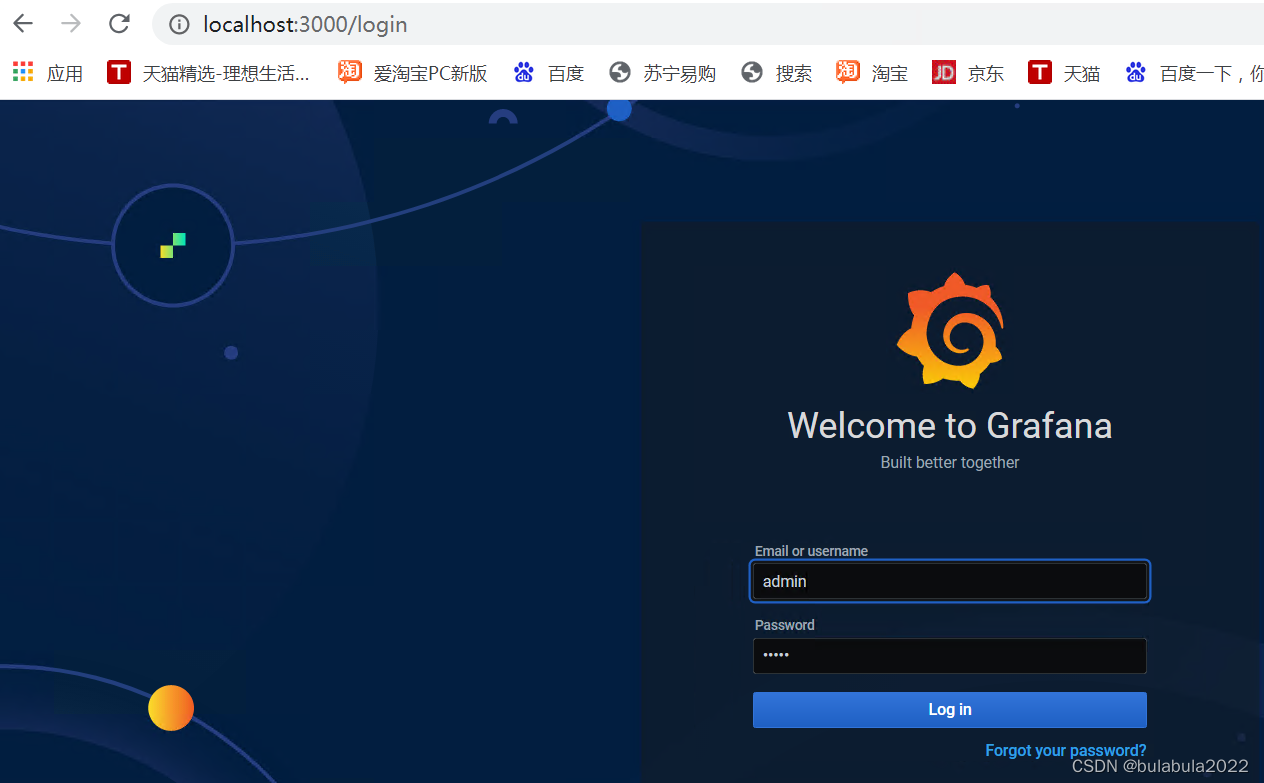
3、 start-up , Switch to Grafana In the installation directory bin Under the table of contents , double-click grafana-server.exe Start the program
4、 visit http://localhost:3000, Use admin/admin Sign in Grafana that will do , Here's the picture
Linux Version installation
1. Switch to the specified directory to download :wget https://dl.grafana.com/oss/release/grafana-7.4.3-1.x86_64.rpm
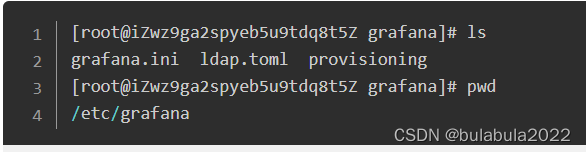
2. install :sudo yum install grafana-7.4.3-1.x86_64.rpm The configuration file grafana.ini Location
3. start-up grafana
1) Boot up
Start the service :systemctl start grafana-server
Boot up :systemctl enable grafana-server
Restart :systemctl restart grafana-server
View startup status :service grafana-server status
grafana Integrate influxdb
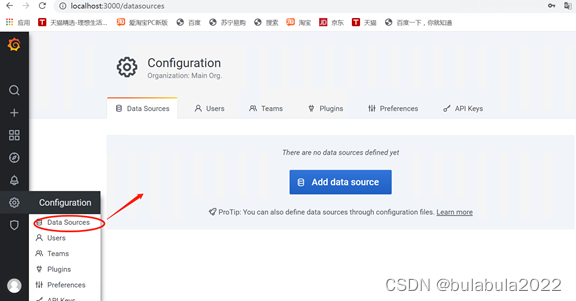
visit http://localhost:3000, Use admin/admin Sign in
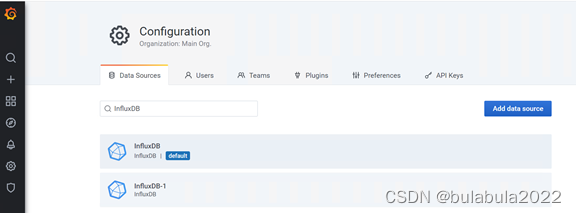
1. Add data sources :Configration –>Data Sources –> Add data source à choice InfluxDB
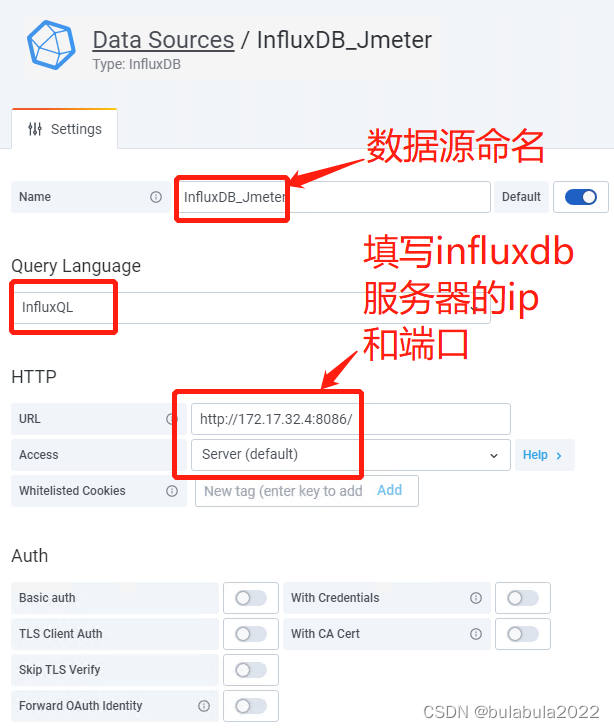
2. To configure influxdb database
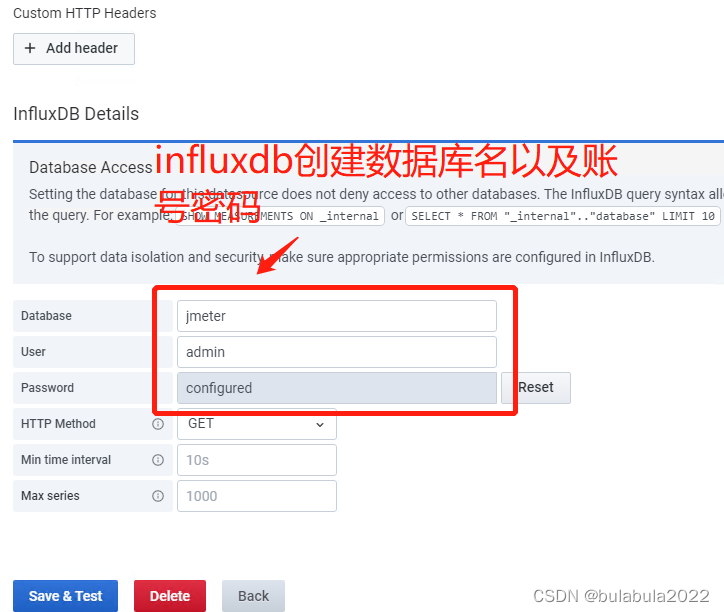
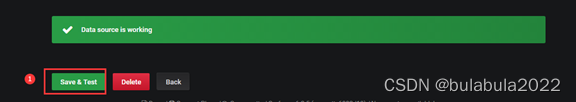
3. preservation , Show Data source is working It means that the addition is successful
More items may need to be completed
1.InfluxDB+Grafana Monitor panel configuration
Monitor panel configuration And more monitoring template optimization , In the follow-up implementation process, a kind of supplement
2.Jmeter+InfluxDB+Grafana Integration of the three , Need secondary development optimization
3.jenkins+jmeter+influxdb Continuous integrated monitoring
4.Prometheus+Grafana Integrated monitoring server (linux,wondows)
5.Prometheus+Grafana Integrated monitoring database (mysql,PostgreSQL,oracle)
6.nmon2influxdb+grafana Visual deployment of service monitoring
Secondary optimization or development , Problems to be solved
Q1:Jmeter Load Test panel -Active Users Show the number of virtual users 1 individual ( The implemented ) |
Q2:Jmeter Load Test panel -request Add fuzzy search function ( Accumulate more and more requests , Easy to search for )( The implemented ) |
Q3:Jmeter Load Test panel - Increase throughput real-time display panel ( Convenient for gradient pressure measurement TPS Model trend view )( The implemented ) |
Q4:Jmeter Load Test panel -metrics overview The display under the panel shows the real-time average throughput ( Currently, the running time is selected manually to participate in the calculation )( The implemented ) |
Q5:Jmeter Load Test panel - Add monitoring panel for server resource consumption ( The implemented ) |
Q6:Jmeter Load Test panel - Add to mysql/oracle/pg Wait for database performance monitoring data collection ( The implemented ) |
Q7:Jmeter Load Test panel - Some overview data can be drilled , View specific data details |
Q8:Jmeter Load Test panel - Add the display of pressure measurement data according to transactions ( Be right jmeter Secondary development of plug-in tools ) |
Q9:Jmeter Load Test panel - Drop down filtering function is added ( It mainly adds variables for multi-dimensional query ) |
Q9:Jmeter Load Test panel -grafana Plot configuration query variables + Multi level variable linkage + Query results are configured in combination with application scenarios ( By project , Function details have not been realized yet ) Reference resources :https://clevercode.blog.csdn.net/article/details/104324039?utm_medium=distribute.pc_relevant.none-task-blog-2%7Edefault%7EBlogCommendFromMachineLearnPai2%7Edefault-4.base&depth_1- utm_source=distribute.pc_relevant.none-task-blog-2%7Edefault%7EBlogCommendFromMachineLearnPai2%7Edefault-4.base |
grafana Historical data query optimization () |
Grafana error Log information can be viewed in real time () |
边栏推荐
- Word finds red text word finds color font word finds highlighted formatted text
- Ant group open source trusted privacy computing framework "argot": open and universal
- The main thread anr exception is caused by too many binder development threads
- A2L file parsing based on CAN bus (3)
- Shang Silicon Valley Shang preferred project tutorial release
- 尚硅谷尚优选项目教程发布
- All you want to know about clothing ERP is here
- Windows Oracle 开启远程连接 Windows Server Oracle 开启远程连接
- Common time complexity
- XML basic knowledge concept
猜你喜欢
企业级数据安全,天翼云是这样理解的
Windows Oracle 开启远程连接 Windows Server Oracle 开启远程连接
Go deep into the underlying C source code and explain the core design principles of redis
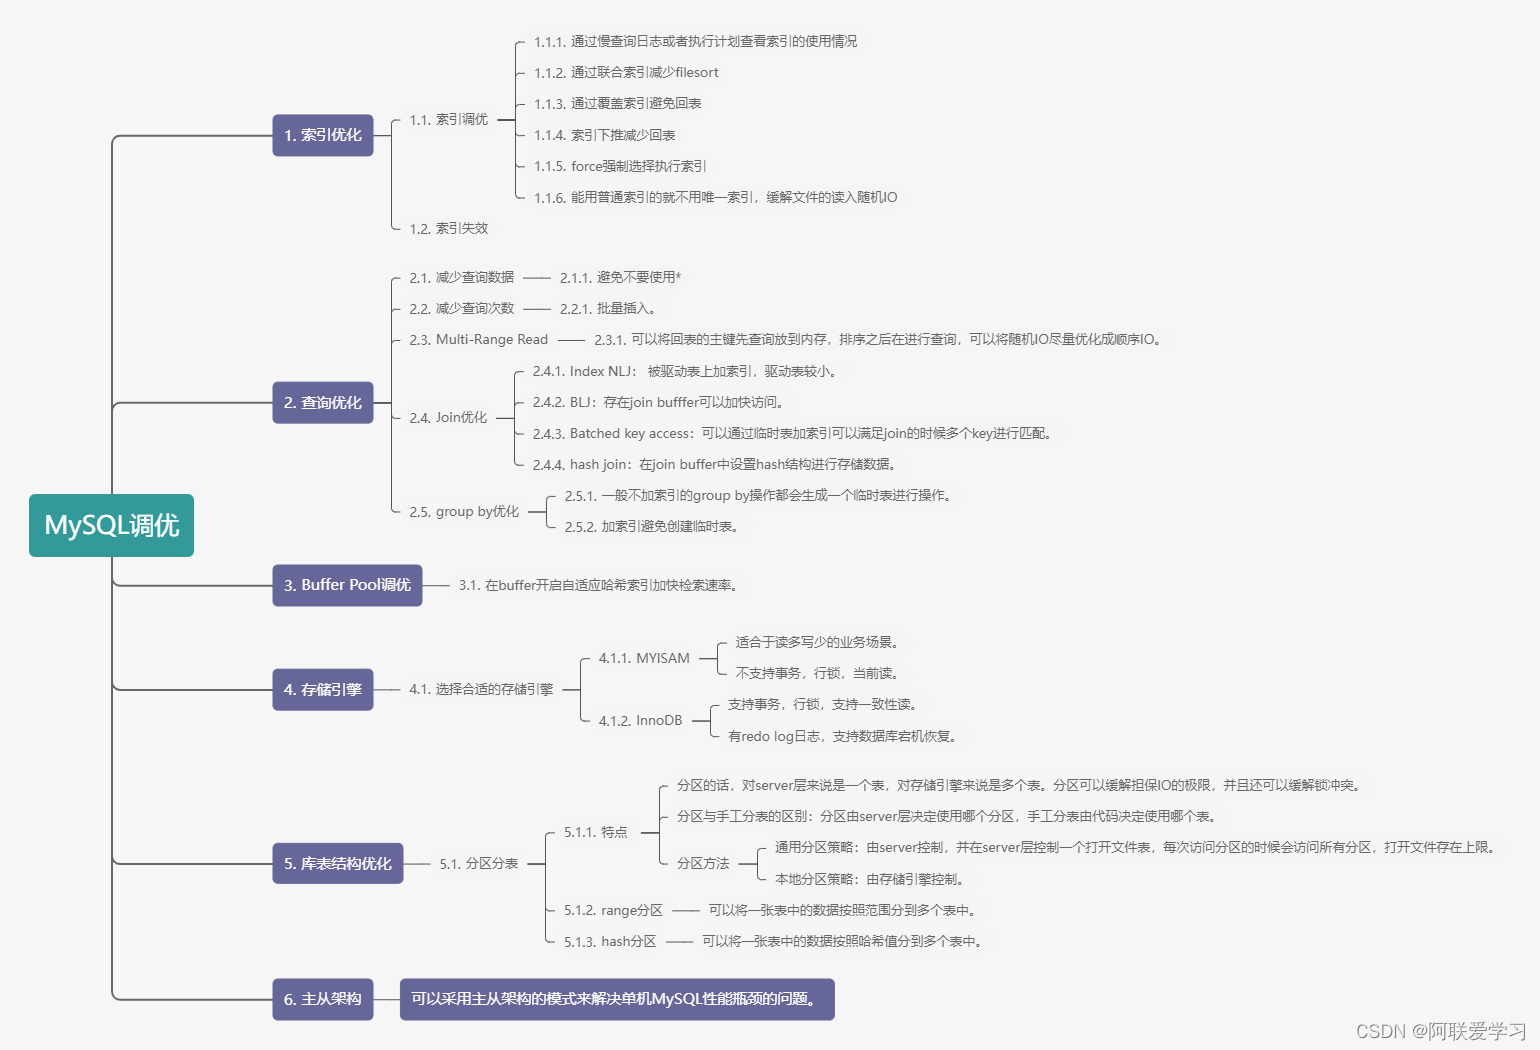
Summary of six points of MySQL optimization
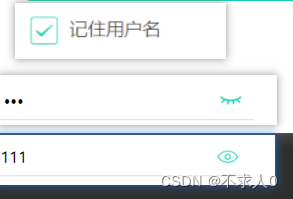
Applet modification style (placeholder, checkbox style)
5年经验Android程序员面试27天,2022程序员进阶宝典
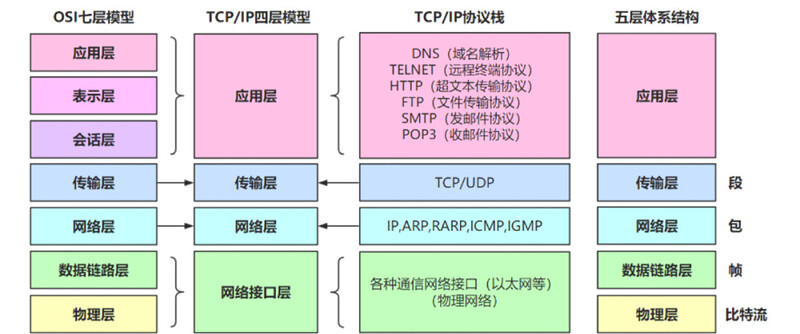
Technology sharing | common interface protocol analysis
AI open2022 | overview of recommendation systems based on heterogeneous information networks: concepts, methods, applications and resources
Interprocess communication (IPC): shared memory

How to write good code defensive programming
随机推荐
Oracle date format conversion to_ date,to_ char,to_ Timestamp mutual conversion
进程间通信(IPC):共享内存
MySQL优化六个点的总结
[detailed explanation of AUTOSAR 14 startup process]
2022最新大厂Android面试真题解析,Android开发必会技术
C final review
Rse2020/ cloud detection: accurate cloud detection of high-resolution remote sensing images based on weak supervision and deep learning
什么是文本挖掘 ?「建议收藏」
1亿单身男女撑起一个IPO,估值130亿
Use QT to traverse JSON documents and search sub objects
What is text mining? "Suggested collection"
2022最新Android面试笔试,一个安卓程序员的面试心得
Golang through pointer for Range implements the change of the value of the element in the slice
How to automatically install pythn third-party libraries
EMQX 5.0 正式发布:单集群支持 1 亿 MQTT 连接
面试官:Redis 过期删除策略和内存淘汰策略有什么区别?
Low code practice of xtransfer, a cross-border payment platform: how to integrate with other medium-sized platforms is the core
[today in history] July 5: the mother of Google was born; Two Turing Award pioneers born on the same day
决策树与随机森林
视频融合云平台EasyCVR增加多级分组,可灵活管理接入设备