当前位置:网站首页>There was a GC failure in the online go service. I was in a hurry
There was a GC failure in the online go service. I was in a hurry
2022-06-21 07:51:00 【Royal teapot】
List of articles
Preface
I have been working in the new company for half a year , There was no major problem with the online system , It's been stable . But everything can never be plain sailing , In the recent operation and maintenance monitoring group , From time to time, service health check warnings will be reported 
If one or two times can also be understood as network fluctuations . But this time , Several of our group's services have been alerted “ Roll call “, Colleagues at the upstream also report an abnormal increase in request errors in the group , Now I can't sit still … Start troubleshooting immediately .
journal / Monitoring and investigation
Usually, the upstream is abnormal , The first reaction is basically to query the error log , Observe system monitoring . The author did not find any abnormal points from the business log , But in Grafana The index monitoring found Go An instance in the service GC Abnormally high ( The following figure shows the normal state , The problematic part is not cut ), Of problem instances GC Time The highest time even reached 10s above !!
GC The time point of abnormal rise can also correspond to the alarm time , So the probability of the problem is that GC Yes .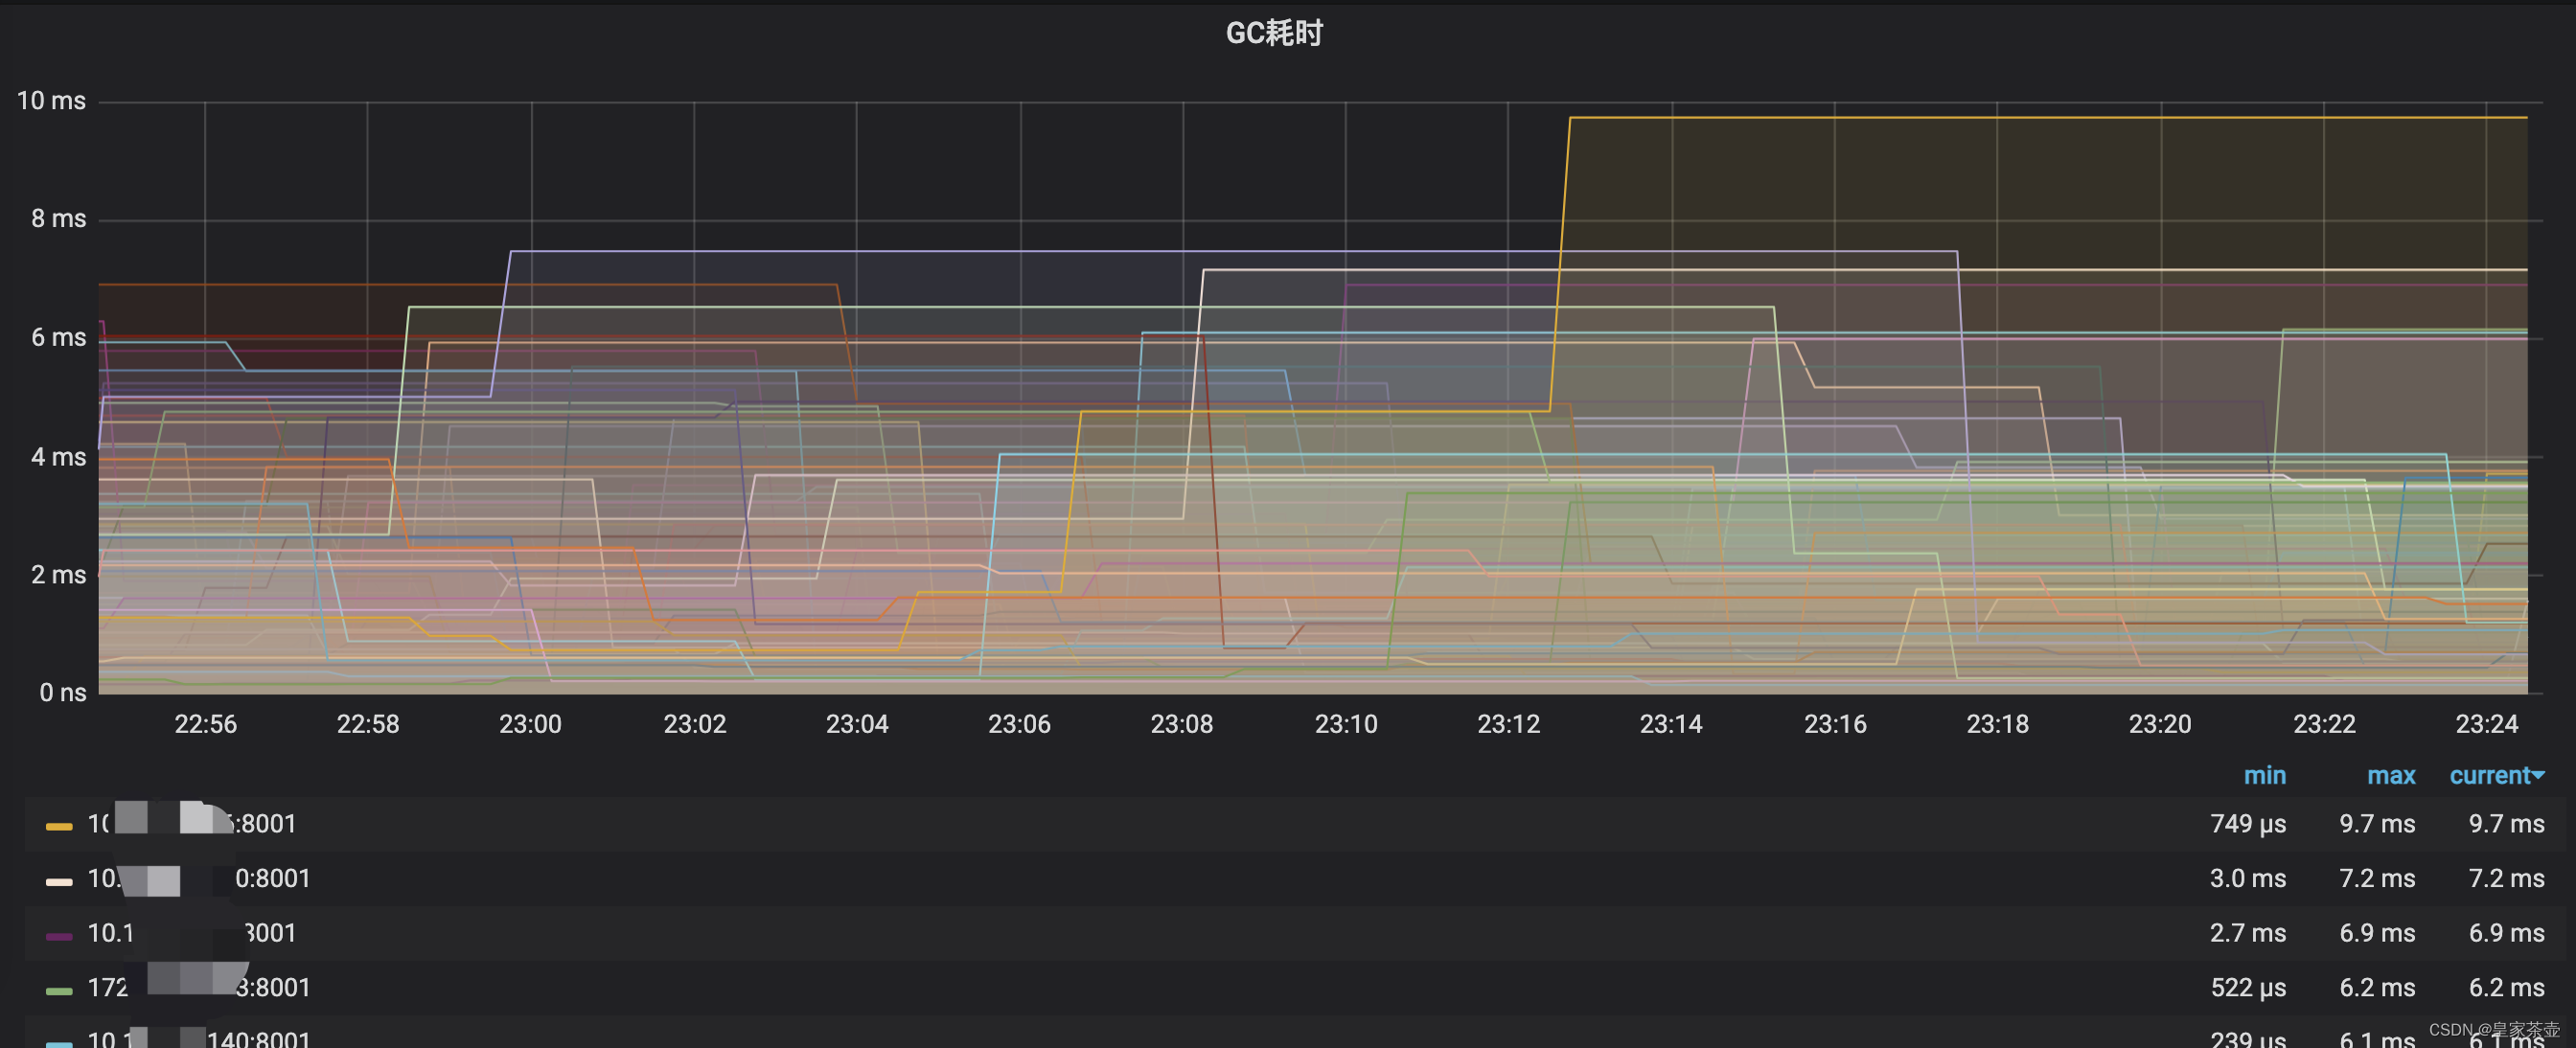
Generally speaking, project operation rarely occurs GC problem , But when it comes to , It usually gives people a headache …
GC The problem is how it affects the system
Normally ,go Service background GC Policies generally do not affect the user experience , however Go Of GC The process has a STW(stop the word) The process of , If this step gets stuck , So the problem is big ,stw seeing the name of a thing one thinks of its function , The whole system is suspended . This is why the upstream is still crazy in the work group on the big weekend @ Why . The system is suspended , The service is not responding , That's good ?
About go Service GC working principle , This article will not elaborate , Interested students can Google by themselves .
A series of countermeasures
add to GC trace
Execute the following commands in the project
export GODEBUG=gctrace=1
This command can make the program run trace Print out the information , Among them, we are more concerned about GC Information
gc 148069 @874092.011s 0%: 0.15+63+0.073 ms clock, 3.7+14/365/923+1.7 ms cpu, 1930->1957->999 MB, 1979 MB goal, 24 P
gc 148070 @874095.521s 0%: 0.13+73+0.009 ms clock, 3.2+140/401/809+0.23 ms cpu, 1948->1985->1009 MB, 1998 MB goal, 24 P
gc 148071 @874098.131s 0%: 0.14+60+0.020 ms clock, 3.4+5.2/328/856+0.49 ms cpu, 1969->1990->1007 MB, 2019 MB goal, 24 P
gc 148072 @874100.934s 0%: 0.12+56+0.028 ms clock, 3.0+8.0/335/861+0.69 ms cpu, 1965->1993->1002 MB, 2015 MB goal, 24 P
gc 148073 @874104.399s 0%: 0.11+55+0.009 ms clock, 2.7+43/315/791+0.22 ms cpu, 1954->1973->991 MB, 2004 MB goal, 24 P
gc 148074 @874107.953s 0%: 0.18+57+0.086 ms clock, 4.4+25/334/814+2.0 ms cpu, 1933->1966->1005 MB, 1983 MB goal, 24 P
Explain the printed information briefly gc 148069: This is the first 148069 Time gc.
@874092.011s: This time, gc Of markTermination After the stage is completed , distance runtime The time from Startup to now .
0%: So far ,gc Marking work ( Including two mark Stage STW And concurrent tags ) Used CPU Time accounts for the total CPU Percent of .
0.15+63+0.073 ms clock: It is divided into three parts in order ,0.15 Express mark Stage STW Time ( single P Of );63 Indicates the time used for concurrent marking ( all P Of );0.073 Express markTermination Stage STW Time ( single P Of ).
3.7+14/365/923+1.7 ms cpu: It is divided into three parts in order ,3.7 Indicates that the whole process is in mark Stage STW Pause time (0.15 * 24);14/365/923 It is divided into 3 part ,14 yes mutator assists Time taken up ,365 yes dedicated mark workers + fractional mark worker Time taken up ,923 yes idle mark workers Time taken up . These three pieces of time add up to be close to 2.9*8(P The number of );1.7 ms Indicates that the whole process is in markTermination Stage STW Pause time (0.073 * 24).
1930->1957->999 MB: It is divided into three parts in order ,1930 To begin mark Before the stage heap_live size ;1957 To begin markTermination Before the stage heap_live size ;999 Indicates the size of the marked object .
1979 MB goal: Indicates the next trigger GC The memory usage threshold for is 1979MB.
24 P: This time gc How many in all P.
After preliminary observation , We found that the process STW It's a long time , The longest is even more than thousands ms.
utilize pprof screening
Memory allocation troubleshooting
We know , The program cannot run without memory , For example, creating variables , Call function , Data calculation, etc , When the program needs memory during running, it will apply for memory . The application and management of memory are in GO Language is automatically managed , There is no need for developers to interfere too much .
Most of them in the same market GC Recycled language ,Go The virtual memory space managed by a language is generally divided into two parts : Heap memory and stack memory . Generally, the memory allocated to the stack will be acquired and released as the system runs ( Code snippets and some small local variables are allocated to stack memory ), Therefore, stack memory generally does not need to be managed , It is allocated and managed by the system , This part is not right GC It has a big impact .
Heap memory is the object we need to focus on , Most of the program's data is allocated to heap memory , Most of the program memory is also in heap memory .
Therefore, our first reaction is to see if we can find and list the program fragments with more memory applications in operation .
about Go For service , The official analysis tool pprof It can be used to do this .pprof The general usage is to check CPU Time consuming flame diagram , Memory footprint graph . Its principle is go Service runtime , Every once in a while, record the code line that the program is currently walking to , be called “ sampling ”.

pprof Flame chart ( Pictures from the Internet )
Fortunately, , At present, our project Go A debugging interface is opened in the service by default /debug/pprof/profile, By calling the interface , Sampling will be started for a period of time after calling , adopt seconds Parameter adjust sampling time , The longer the sampling time, the more accurate the data is . After sampling, a profile Documents for analysis .
If not used in the project pprof It doesn't matter , Because it was brought by the government , So it is very easy to integrate . Interested students can google the integration tutorial by themselves .
Into the container , adopt git Pull a project code ( This step is necessary , such pprof To get fine-grained time-consuming through the source code , Otherwise you can only get time-consuming information at the method level , You can't see the statement level , At the same time, you should pay attention to the source code build The binary file paths are consistent ). Execute the following command
#  Allocate memory sampling
/usr/local/go/bin/go tool pprof 'http://localhost:8000/debug/pprof/allocs'
here pprof Sample read will be performed , Then we will enter pprof Command line interface . By using top 20 command , We can see that the most memory is allocated before 20 A way 
We use list [ Method name ] To further view the memory allocation details inside the method .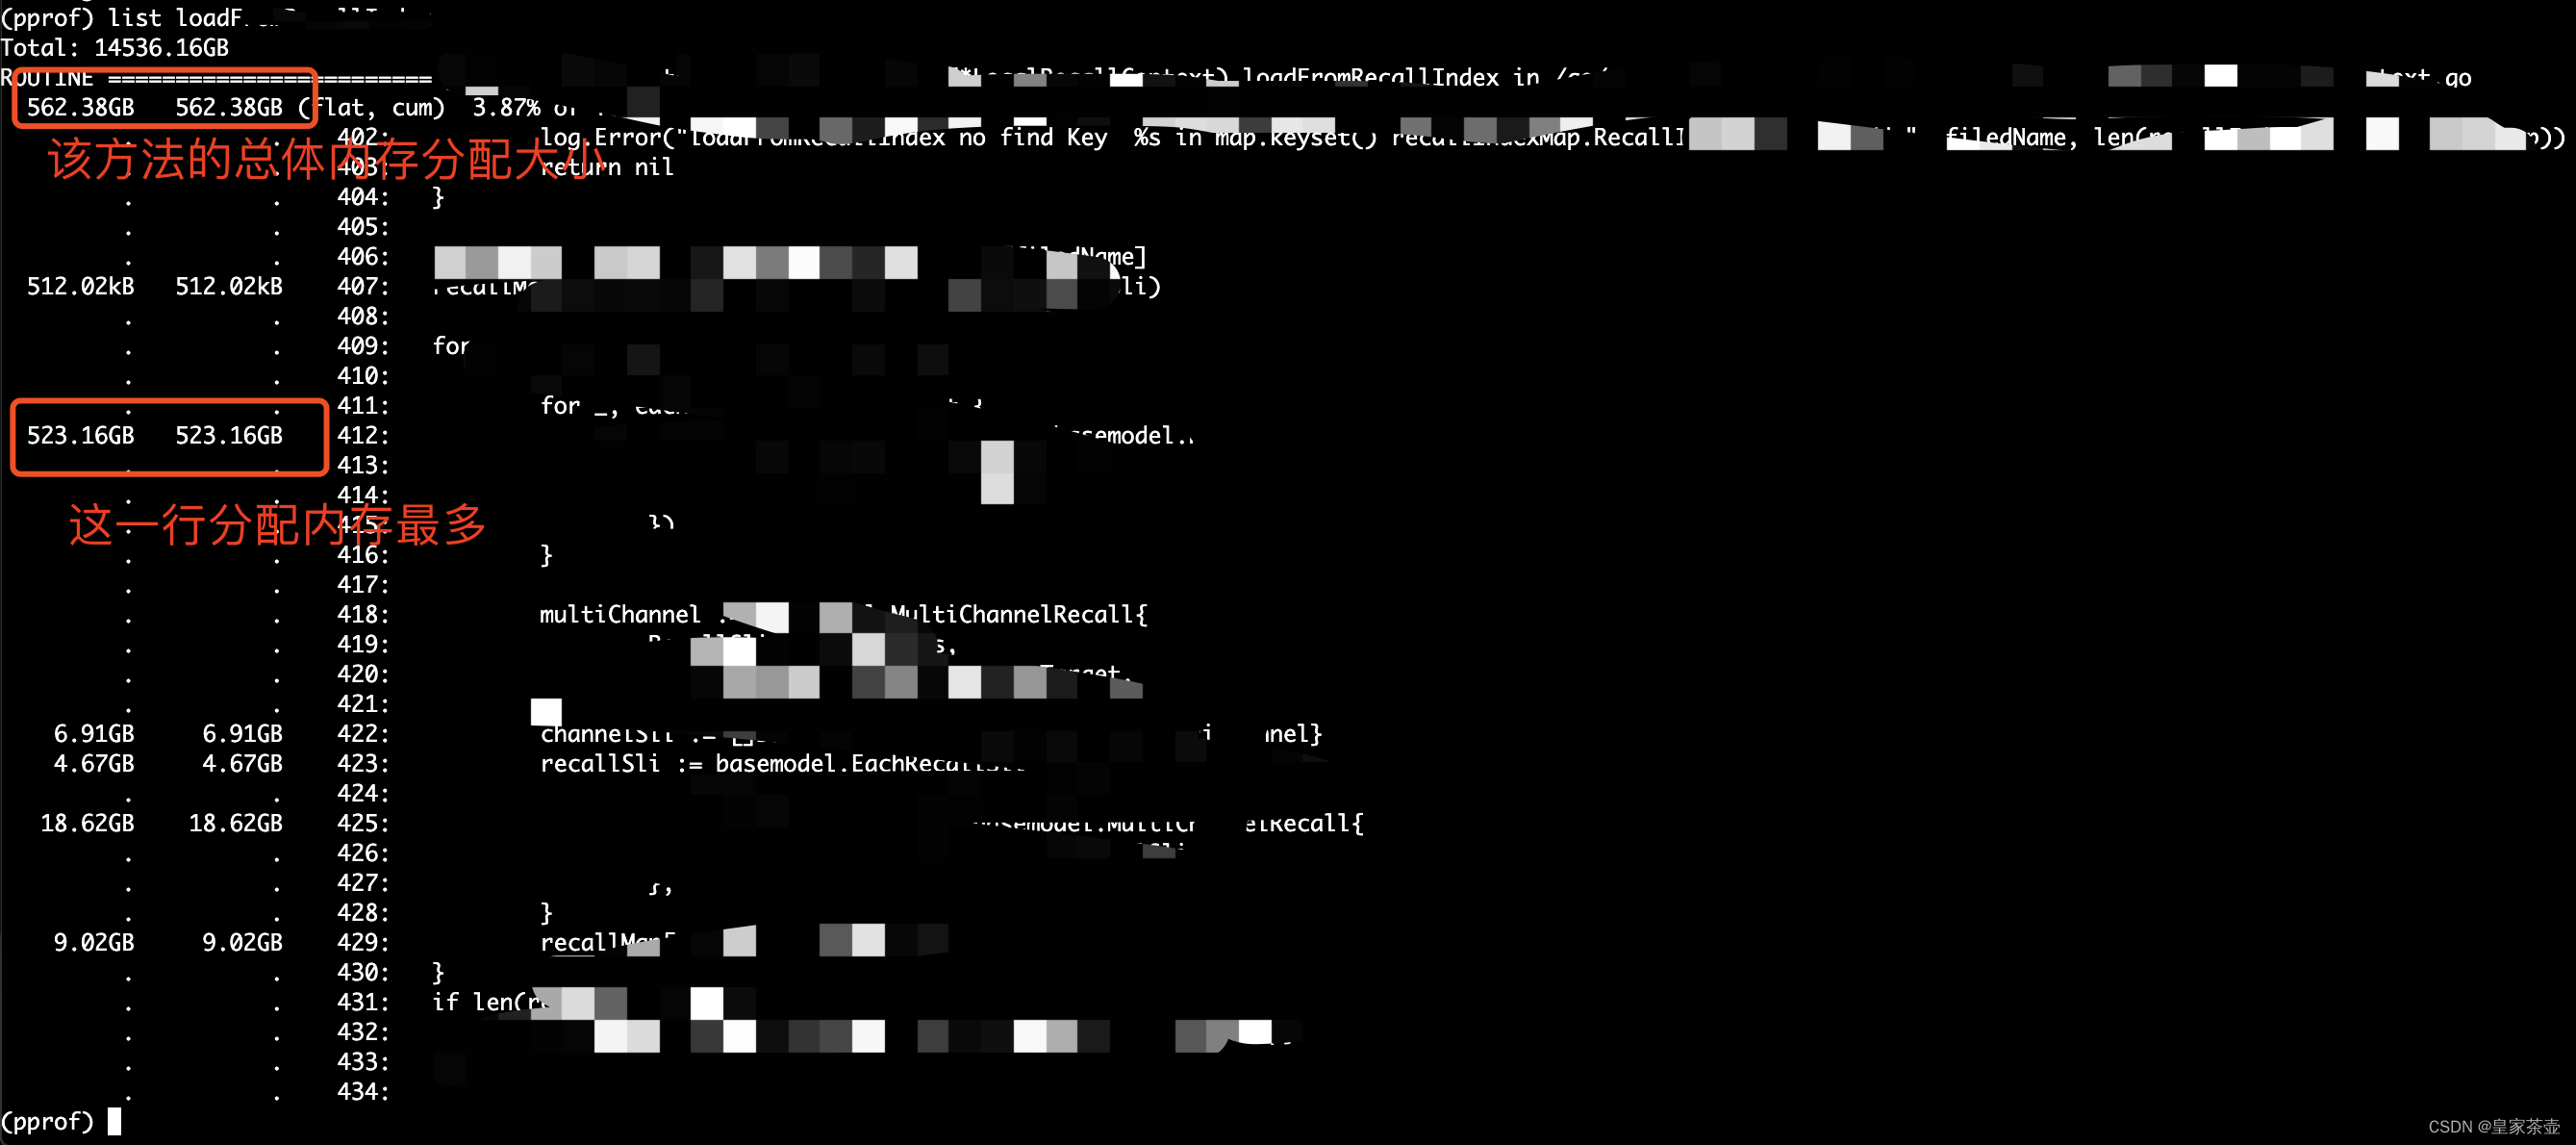
Here we are , We can basically find all the code snippets with the most memory requests . next step , Just start optimizing . Here I list the optimization points directly , These optimization points are usually written Go Points to pay attention to when coding , Don't accidentally write code that is easy to cause hidden trouble , Lay the groundwork for future investigation : (
trace Information troubleshooting
pprof There are many ways to support troubleshooting , In addition to memory allocation , We can also sample programs that run trace Information , Pull the sampling file for parsing .
#  Just now /debug/pprof/allocs,  Now let's grab trace Information
curl -o /tmp/trace.data 'http://127.0.0.1:8000/debug/pprof/trace?seconds=60'
This will generate a trace Data files , We pull the files locally , function
go tool trace trace.data
This will start a local trace service , Used to display sampling data .
On the right side of the proc Corresponding gctrace in P The number of , This picture shows the running track of the program . At present, we only care about GC( Pay attention to the red circle ) Part of , You want to GC trace Have a detailed understanding of the words , You can see This article , This article focuses on problem solving ~~

The arrow is in the program heap Memory , You can see heap Threshold reached ( At the second arrow ), It happened. GC( Blue horizontal column ),GC After completion ,heap Memory dropped by half .( Very reasonable. , But it also shows that the sampling did not catch the problem part )
There is a certain luck cost in sampling this thing , If you don't collect more than a few times, you may not be able to sample STW Unexpected code snippets . After multiple sampling , We found that a paragraph contains a long STW Sampling information for . Then for STW During the other P The code that is still running has been further investigated .
Solution
Map,Slice Initialize set length
We usually use themmakeMethod to initialize slice and Map, If you don't set the length and add a lot of elements , It may cause slice perhaps map Frequent capacity expansion and memory application . Therefore, we usually estimate the length and allocate the capacity at one time before initialization .Large object replication / Unused pointer
At the start of the project , We will preload the product data into the system memory , The information of each product is very complicated ( Commodity information , Various scoring information , And so on ), The structure of such a commodity is very large . After loading , We usually use it to query , Will not make changes . It turns out that when we get the product information again , The return is a complete structure, not a pointer , This leads to a lot of meaningless memory copies , Would be right GC Cause no small burden .In fact, during the investigation , The memory allocation caused by this large structure duplication is very obvious ( At least top3), Change to return the pointer , The situation immediately improved a lot .
Another word , If the data structure is small , Or simply some basic data ,int,string Saying things like, , There is no need to use a pointer , Using the original data directly will lead to better performance .
IO Blocking readAll
Product data will be loaded before the project is started , These data are obtained by reading the commodity data file . We then check the memory allocation process , One way to find that memory allocation is large isio.ReadAll
Obviously , After some positioning , It is found that this method is used to read the product file . You can see , The project read file is a one-time read , Usually , It won't cause problems . But after research , We find that such reading also causes GC The hidden danger of the problem ( As mentioned above trace Information view STW The longer part , I also saw the code figure of reading files ). For details, please refer to this Issue:runtime: ioutil.ReadFile when reading big files may cause long STW pausesThe final modification scheme is also very simple , Just change to streaming reading .
k8s Under the container process Improper setting
Because the project is running on k8s The container , as everyone knows ,Go The bottom layer passes through the scheduler GMP Realize lightweight collaboration ( If the GMP Scheduling process is of interest , You can see This article ), among P(process) Usually with the machine CPU Set the number of cores to the same . But running on k8s Under the Go project , Will be able to P Set it to be consistent with the total audit number of the machine , Not the number of cores we assign to the container , First, this leads to frequent scheduling , Secondly, it will also lead to GC problem . This article There are few explanations for this phenomenon , Can have a look at , This article will not go over .The solution is simple , Project use Uber The library of
automaxprocsYou can solve it P Set the problem that is inconsistent with the assigned audit number .
Conclusion
After a fierce operation , The program as a whole GC Time goes down 80%, Now I can finally have a good sleep ~️
However …
mystery
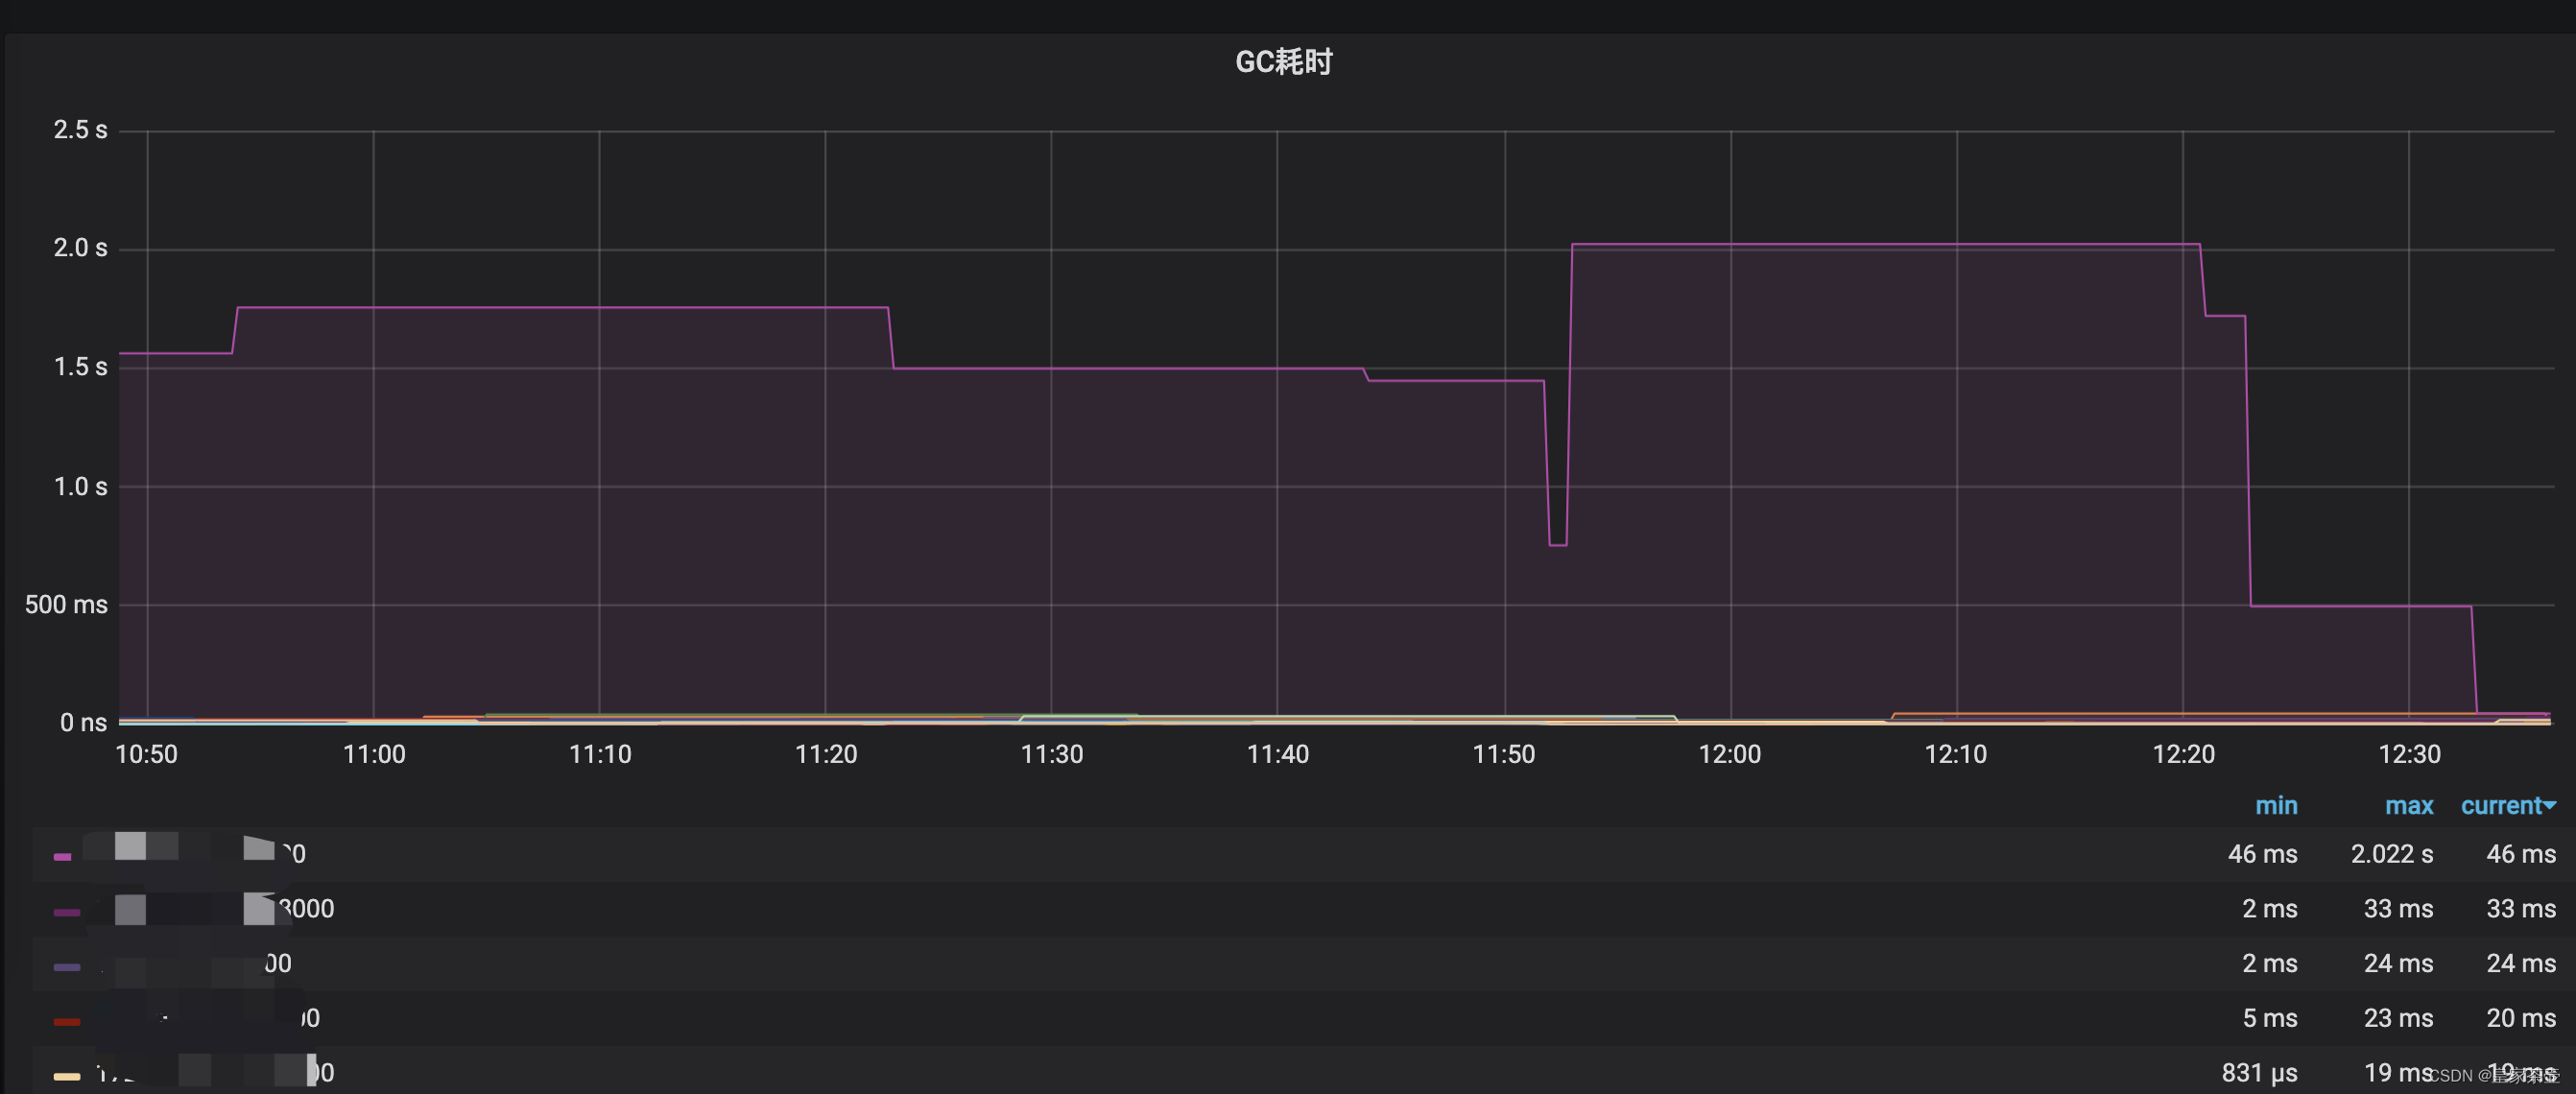
Although optimized , But we also added the right GC Time consuming alarm monitoring . Pictured above , We found a few k8s Container of GC Time will still reach more than seconds ? For this problem, the author still does not have a particularly good solution . colleagues Guess it may be a physical machine hybrid deployment , Other programs preempt resources, causing the project to GC Time rises abnormally .
What do you guys think ?

边栏推荐
- How to write the statement of executing stored procedure in MySQL
- /home/ljx/miniconda3/compiler_compat/ld: cannot find crtbeginS.o: 没有那个文件或目录
- Leetcode topic [array] -40- combined sum II
- mysql不是内部命令如何解决
- rdkit | 药物分子进行片段分解
- [Redis]-[Redis底层数据结构]-SDS
- 解决Jenkins升级后不能保存配置的问题
- arduino有关软件卸载,库的卸载问题
- AutoCAD - drawing units and drawing boundaries
- Talk about MySQL's locking rule "hard hitting MySQL series 15"
猜你喜欢

How to make MySQL case insensitive
2021-06-16 STM32F103 EXTI 中斷識別 使用固件庫

Illustration Google V8 15: Hidden classes: how to quickly find object attributes in memory?

为什呢代码没报错但是数据库里边的数据显示不出来

Illustration Google V8 14: bytecode (2): how does the interpreter interpret and execute bytecode?
![[visualization - source code reading] antvis / g-base interpretation - 1](/img/a6/411621e180fa717f98136ddfdbe673.jpg)
[visualization - source code reading] antvis / g-base interpretation - 1
RDKIT | 基于分子指纹的分子相似性

How to start wireless network service after win10 system installation
如何让mysql不区分大小写

One year experience interview byte Tiktok e-commerce, share the following experience!
随机推荐
2021-06-18 STM32F103 DMA and DMA serial port code using firmware library
Talk about MySQL's locking rule "hard hitting MySQL series 15"
Rdkit | fragment decomposition of drug molecules
2021 - 06 - 16 stm32f103 exti interruption identification using firmware Library
Rdkit | molecular similarity based on molecular fingerprint
群晖DSM7添加套件源
Research Report on inorganic copper fungicide industry - market status analysis and development prospect forecast
2021-06-17 STM32F103 USART serial port code using firmware library
2021-06-16 STM32F103 EXTI 中斷識別 使用固件庫
Rdkit | topological polarity surface area (TPSA)
Illustration Google V8 14: bytecode (2): how does the interpreter interpret and execute bytecode?
RDKIT | 基于分子指纹的分子相似性
Yyds dry goods inventory rapid establishment of CEPH cluster
MSDN中“演练:使用 Web 窗体页创建分页的数据访问” 一文中的代码的一点改进
Leetcode topic [array] -40- combined sum II
Matlab 3D diagram (unconventional)
一元多项式的乘法与加法运算 (20 分)
Asp. Net web API 2 Lesson 1 - getting started
dried food! Neuron competitive initialization strategy based on information bottleneck theory
[UML modeling] (4) sequence diagram of UML modeling