当前位置:网站首页>Crowd simulation
Crowd simulation
2022-06-27 02:38:00 【Zhangchuncheng】
Crowd simulation
It seems that humans are really right COVID-19 There's no way , It's really annoying .
So we might as well change our mind , Think about how to minimize its harm .
Computational simulation
I have a front-end tool at hand , be called ATOMIC AGENTS
Atomic Agents Spatial agent-based modeling in JavaScriptDocsExamples This module was written for the Visualising Contact Networks in Response to COVID-19 UKRI-funded project (University of Warwick and Swansea University). It is still under active development — contributions are welcome.

Its advantages are high efficiency and simplicity , It is especially suitable for repeatable and interactive epidemiological analysis simulation . I am based on the official sample , Constructed its own analysis program . The code is visible in my front-end repository
This is a diagram of the main program

The lower part represents a simulation scenario , There's... In the scene 1000 Members , Red represents the infected person (Infect), Green represents rehabilitation (Recover) personnel , Blue represents uninfected persons . Some of these people are free to move (Move), Others need to stay at home (Still).
The upper part is the real-time statistics of various indicators , That means we can know in real time
How many people are infected ; How many of them are still , How many people are athletic ; In the whole communication process , What is the peak value of each value .
In this way, we can get a dynamic simulation of epidemiology , That is, how infection spreads in society . As shown in the video .
【】
The results of the analysis
Next , We make simple statistics and analysis of the results .
First, let's see how effective the home isolation policy is , We adjust Move and Still The ratio between
When the proportion of home isolation is 0.8 when , The proportion of people infected at the same time in the total population is 0.04 and 0.12; When the proportion of home isolation is 0.6 when , The proportion of people infected at the same time in the total population is 0.21 and 0.27; When the proportion of home isolation is 0.2 when , The proportion of people infected at the same time in the total population is 0.34 and 0.35.
This shows that even if the home isolation policy can not stop the virus infection forever , But it has at least one effect , That is to reduce the number of simultaneous infections to a very low level , From a utilitarian point of view , It can avoid the run on medical resources caused by the simultaneous infection of too many people to the greatest extent .

StillProb0.8

StillProb0.6

StillProb0.2
Next, we will examine the way of regional isolation , The parameters of previous area isolation are large . Shown on the graph is left 、 The passage between the two areas on the right is wide . We'll narrow it down next ,
The proportion of home isolation is still set at 0.2, It means that there is little need for people to stay still , To the left 、 After the passage between the right areas narrows , The peak proportion of people infected at the same time increased to 0.48 and 0.49; In addition, we set the proportion of home isolation at 0.8, Represents the need for personnel to remain stationary , After narrowing , At the same time, the peak proportion of infected persons is still 0.06 and 0.12.
This may be due to increased intra regional action , It is easy to cause cross infection ; And when most people are still , Zone isolation has little additional effect .

StillProb0.2Narrow

StillProb0.8Narrow
边栏推荐
- paddlepaddle 21 基于dropout实现用4行代码dropblock
- Geometric distribution (a discrete distribution)
- 学习太极创客 — MQTT 第二章(二)ESP8266 QoS 应用
- Hot discussion: what are you doing for a meaningless job with a monthly salary of 18000?
- paddlepaddle 19 动态修改模型的最后一层
- 元透实盘周记20220627
- Yalm 100b: 100billion parameter open source large model from yandex, Russia, allowing commercial use
- Oracle/PLSQL: Substr Function
- lottie. JS creative switch button animal head
- dat.gui.js星星圆圈轨迹动画js特效
猜你喜欢

TechSmith Camtasia最新2022版详细功能讲解下载

ConstraintLayout(约束布局)开发指南

lottie.js创意开关按钮动物头像

Calculation of average wind direction and speed (unit vector method)
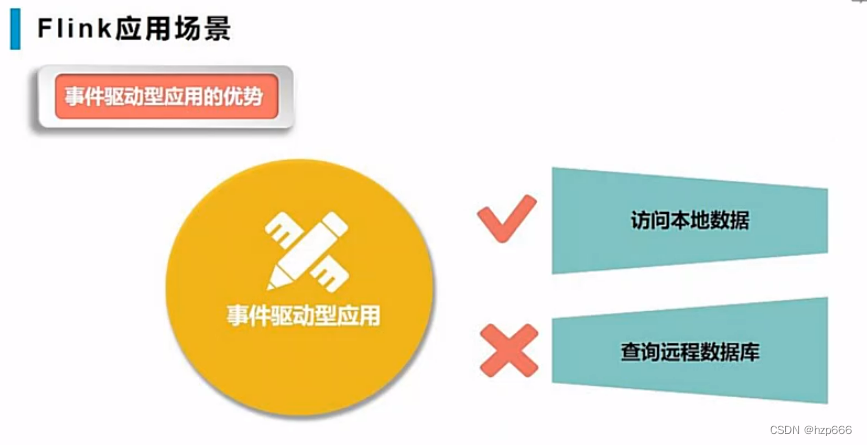
Flink学习2:应用场景
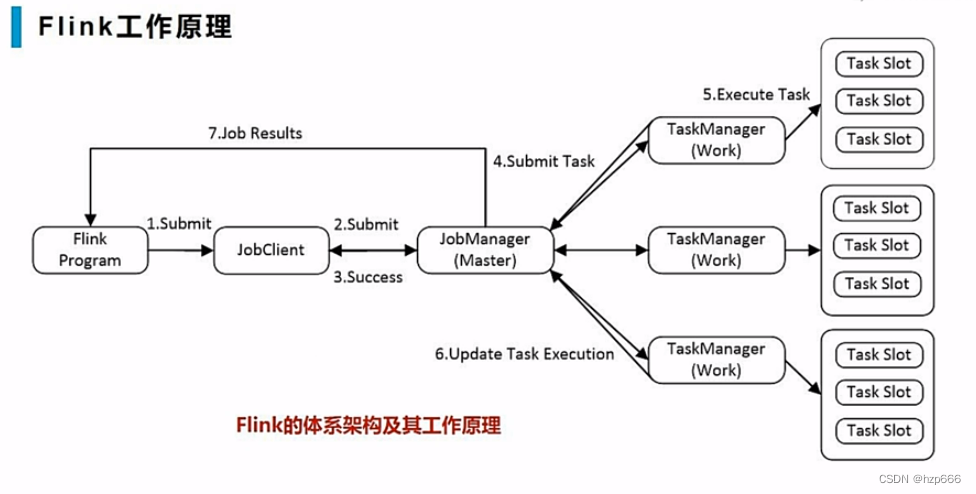
Flink学习5:工作原理

Learn from Taiji Maker - mqtt Chapter 2 (I) QoS service quality level

Google began to roll itself, AI architecture pathways was blessed, and 20billion generation models were launched
学习太极创客 — MQTT 第二章(一)QoS 服务质量等级
1、项目准备与新建
随机推荐
Flink learning 1: Introduction
svg拖拽装扮Kitty猫
1、项目准备与新建
Would rather go to 996 than stay at home! 24 years old, unemployed for 7 months, worse than work, no work
Geometric distribution (a discrete distribution)
测试nohup和&的各自作用
Oracle/PLSQL: CharToRowid Function
Flink学习3:数据处理模式(流批处理)
Oracle/PLSQL: Lpad Function
【微服务|Sentinel】降级规则|慢调用比例|异常比例|异常数
[micro service sentinel] degradation rules slow call proportion abnormal proportion abnormal constant
执念斩长河暑期规划
【数组】剑指 Offer II 012. 左右两边子数组的和相等 | 剑指 Offer II 013. 二维子矩阵的和
学习太极创客 — MQTT 第二章(二)ESP8266 QoS 应用
paddlepaddle 21 基于dropout实现用4行代码dropblock
Oracle/PLSQL: To_Clob Function
Memcached basics 14
Microsoft365 developer request
LeetCode 785:判断二分图
Yalm 100b: 100billion parameter open source large model from yandex, Russia, allowing commercial use