当前位置:网站首页>使用Echart绘制3D饼环图、仪表盘、电池图
使用Echart绘制3D饼环图、仪表盘、电池图
2022-06-22 04:28:00 【啾比特】
3D饼环图
参考博客
https://blog.csdn.net/m0_67266787/article/details/123155878
插件引入
- echarts.js
- echarts-gl.min.js
效果图

代码
/** * 绘制3d图 * @param pieData 总数据 * @param internalDiameterRatio:透明的空心占比 * @param distance 视角到主体的距离 * @param alpha 旋转角度 * @param pieHeight 立体的高度 * @param opacity 饼或者环的透明度 */
const getPie3D = (pieData, internalDiameterRatio, distance, alpha, pieHeight, opacity = 1) => {

    const series = []
    let sumValue = 0
    let startValue = 0
    let endValue = 0
    let legendData = []
    let legendBfb = []
    const k = 1 - internalDiameterRatio
    pieData.sort((a, b) => {

        return b.value - a.value
    })
    // 为每一个饼图数据,生成一个 series-surface 配置
    for (let i = 0; i < pieData.length; i++) {

        sumValue += pieData[i].value
        const seriesItem = {

            name: typeof pieData[i].name === 'undefined' ?
                `series${
      i}` : pieData[i].name,
            type: 'surface',
            parametric: true,
            wireframe: {

                show: false
            },
            pieData: pieData[i],
            pieStatus: {

                selected: false,
                hovered: false,
                k: k
            },
            center: ['10%', '50%'],
        }
        if (typeof pieData[i].itemStyle !== 'undefined') {

            const itemStyle = {
    }
            itemStyle.color =
                typeof pieData[i].itemStyle.color !== 'undefined' ?
                pieData[i].itemStyle.color :
                opacity
            itemStyle.opacity =
                typeof pieData[i].itemStyle.opacity !== 'undefined' ?
                pieData[i].itemStyle.opacity :
                opacity
            seriesItem.itemStyle = itemStyle
        }
        series.push(seriesItem)
    }

    // 使用上一次遍历时,计算出的数据和 sumValue,调用 getParametricEquation 函数,
    // 向每个 series-surface 传入不同的参数方程 series-surface.parametricEquation,也就是实现每一个扇形。
    legendData = []
    legendBfb = []
    for (let i = 0; i < series.length; i++) {

        endValue = startValue + series[i].pieData.value
        series[i].pieData.startRatio = startValue / sumValue
        series[i].pieData.endRatio = endValue / sumValue
        series[i].parametricEquation = getParametricEquation(
            series[i].pieData.startRatio,
            series[i].pieData.endRatio,
            false,
            false,
            k,
            series[i].pieData.value
        )
        startValue = endValue
        const bfb = fomatFloat(series[i].pieData.value / sumValue, 4)
        legendData.push({

            name: series[i].name,
            value: bfb
        })
        legendBfb.push({

            name: series[i].name,
            value: bfb
        })
    }
    let legends_left = legendData.splice(0, legendData.length / 2)
    const boxHeight = getHeight3D(series, pieHeight) + 0.005 // 通过pieHeight设定3d饼/环的高度,单位是px
    // 准备待返回的配置项,把准备好的 legendData、series 传入。
    const option = {

        legend: [{

            show: true,
            data: legends_left,
            orient: 'horizontal',
            right: 50,
            top: -5,
            itemHeight: 15,
            itemWidth: 15,
            itemGap: 80,
            textStyle: {

                color: '#fff',
                rich: {

                    value: {

                        fontSize: 22,
                        width: 50,
                        color: "#fff",
                        fontWeight: 800,
                        lineHeight: 30
                    },
                    name: {

                        width: 50,
                        fontSize: 14,
                        color: "#565F68",
                    }
                }
            },
            icon: 'rect',
            formatter: function (param) {

                const item = legendBfb.filter(item => item.name === param)[0]
                const bfs = fomatFloat(item.value * 100, 2) + '%'
                return [
                    `{value|${
      bfs}}`,
                    `{name|${
      item.name}}`
                ].join('\n')
            },
        }, {

            show: true,
            data: legendData,
            orient: 'horizontal',
            right: 50,
            top: 55,
            itemHeight: 15,
            itemWidth: 15,
            itemGap: 80,
            textStyle: {

                color: '#fff',
                rich: {

                    value: {

                        fontSize: 22,
                        color: "#fff",
                        fontWeight: 800,
                        lineHeight: 30,
                        width: 50,
                    },
                    name: {

                        fontSize: 14,
                        color: "#565F68",
                        width: 50,
                    }
                }
            },
            icon: 'rect',
            formatter: function (param) {

                const item = legendBfb.filter(item => item.name === param)[0]
                const bfs = fomatFloat(item.value * 100, 2) + '%'
                return [
                    `{value|${
      bfs}}`,
                    `{name|${
      item.name}}`
                ].join('\n')
            }
        }],
        labelLine: {

            show: true,
            lineStyle: {

                color: '#fff'
            }
        },
        label: {

            show: true,
            position: 'center',
            formatter: '{b} {c} {d}%'
        },
        tooltip: {

            backgroundColor: '#033b77',
            borderColor: '#21f2c4',
            textStyle: {

                color: '#fff',
                fontSize: 13
            },
            formatter: params => {

                if (
                    params.seriesName !== 'mouseoutSeries' &&
                    params.seriesName !== 'pie2d'
                ) {

                    const bfb = (
                        (option.series[params.seriesIndex].pieData.endRatio -
                            option.series[params.seriesIndex].pieData.startRatio) *
                        100
                    ).toFixed(2)
                    return (
                        `${
      params.seriesName}<br/>` +
                        `<span style="display:inline-block;margin-right:5px;border-radius:10px;width:10px;height:10px;background-color:${
      params.color};"></span>` +
                        `${
      bfb}%`
                    )
                }
            }
        },
        xAxis3D: {

            min: -1,
            max: 1
        },
        yAxis3D: {

            min: -1,
            max: 1
        },
        zAxis3D: {

            min: -1,
            max: 1
        },
        grid3D: {

            show: false,
            left: -190, //设置 组件的视图离容器左侧的距离
            boxHeight: boxHeight, // 圆环的高度
            viewControl: {

                // 3d效果可以放大、旋转等,请自己去查看官方配置
                alpha, // 角度
                distance, // 调整视角到主体的距离,类似调整zoom
                rotateSensitivity: 0, // 设置为0无法旋转
                zoomSensitivity: 0, // 设置为0无法缩放
                panSensitivity: 0, // 设置为0无法平移
                autoRotate: false // 自动旋转
            }
        },
        series: series
    }
    return option
}

/** * 生成扇形的曲面参数方程,用于 series-surface.parametricEquation */
const getParametricEquation = (startRatio, endRatio, isSelected, isHovered, k, h) => {

    // 计算
    const midRatio = (startRatio + endRatio) / 2
    const startRadian = startRatio * Math.PI * 2
    const endRadian = endRatio * Math.PI * 2
    const midRadian = midRatio * Math.PI * 2
    // 如果只有一个扇形,则不实现选中效果。
    if (startRatio === 0 && endRatio === 1) {

        isSelected = false
    }
    // 通过扇形内径/外径的值,换算出辅助参数 k(默认值 1/3)
    k = typeof k !== 'undefined' ? k : 1 / 3
    // 计算选中效果分别在 x 轴、y 轴方向上的位移(未选中,则位移均为 0)
    const offsetX = isSelected ? Math.cos(midRadian) * 0.1 : 0
    const offsetY = isSelected ? Math.sin(midRadian) * 0.1 : 0
    // 计算高亮效果的放大比例(未高亮,则比例为 1)
    const hoverRate = isHovered ? 1.1 : 1
    // 返回曲面参数方程
    return {

        u: {

            min: -Math.PI,
            max: Math.PI * 3,
            step: Math.PI / 32
        },
        v: {

            min: 0,
            max: Math.PI * 2,
            step: Math.PI / 20
        },
        x: function (u, v) {

            if (u < startRadian) {

                return (
                    offsetX +
                    Math.cos(startRadian) * (1 + Math.cos(v) * k) * hoverRate
                )
            }
            if (u > endRadian) {

                return (
                    offsetX + Math.cos(endRadian) * (1 + Math.cos(v) * k) * hoverRate
                )
            }
            return offsetX + Math.cos(u) * (1 + Math.cos(v) * k) * hoverRate
        },
        y: function (u, v) {

            if (u < startRadian) {

                return (
                    offsetY +
                    Math.sin(startRadian) * (1 + Math.cos(v) * k) * hoverRate
                )
            }
            if (u > endRadian) {

                return (
                    offsetY + Math.sin(endRadian) * (1 + Math.cos(v) * k) * hoverRate
                )
            }
            return offsetY + Math.sin(u) * (1 + Math.cos(v) * k) * hoverRate
        },
        z: function (u, v) {


            if (u < -Math.PI * 0.5) {

                // console.log("1",u,Math.sin(u))
                return Math.sin(u)
            }
            if (u > Math.PI * 2.5) {

                // console.log("2",u,Math.sin(u) * h * 0.1)
                return Math.sin(u) * h * 0.1
            }
            return Math.sin(v) > 0 ? 1 * h * 0.1 : -1
        }
    }
}

/** * 获取3d饼图的最高扇区的高度 */
const getHeight3D = (series, height) => {

    series.sort((a, b) => {

        return b.pieData.value - a.pieData.value
    })
    return (height * 25) / series[0].pieData.value
}

/** * 格式化浮点数 */
const fomatFloat = (num, n) => {

    let f = parseFloat(num)
    if (isNaN(f)) {

        return false
    }
    f = Math.round(num * Math.pow(10, n)) / Math.pow(10, n) // n 幂
    let s = f.toString()
    let rs = s.indexOf('.')
    // 判定如果是整数,增加小数点再补0
    if (rs < 0) {

        rs = s.length
        s += '.'
    }
    while (s.length <= rs + n) {

        s += '0'
    }
    return s
}
var option_6 = getPie3D(optionData, 0.8, 110, 20, 15, 1);

myChart_6.setOption(option_6);
let hoveredIndex = ''
let optionName = 'option_6'
myChart_6.on('mouseover', (params) => {

    // 准备重新渲染扇形所需的参数
    let isSelected
    let isHovered
    let startRatio
    let endRatio
    let k
    // console.log(params.seriesIndex)
    // console.log(this['option_6'])
    // 如果触发 mouseover 的扇形当前已高亮,则不做操作
    if (hoveredIndex === params.seriesIndex) {

        // 否则进行高亮及必要的取消高亮操作
    } else {

        // 如果当前有高亮的扇形,取消其高亮状态(对 option 更新)
        if (hoveredIndex !== '') {

            // 从 option.series 中读取重新渲染扇形所需的参数,将是否高亮设置为 false。
            isSelected = this[optionName].series[hoveredIndex].pieStatus.selected
            isHovered = false
            startRatio = this[optionName].series[hoveredIndex].pieData.startRatio
            endRatio = this[optionName].series[hoveredIndex].pieData.endRatio
            k = this[optionName].series[hoveredIndex].pieStatus.k
            // 对当前点击的扇形,执行取消高亮操作(对 option 更新)
            this[optionName].series[
                hoveredIndex
            ].parametricEquation = getParametricEquation(
                startRatio,
                endRatio,
                isSelected,
                isHovered,
                k,
                this[optionName].series[hoveredIndex].pieData.value
            )
            this[optionName].series[hoveredIndex].pieStatus.hovered = isHovered
            // 将此前记录的上次选中的扇形对应的系列号 seriesIndex 清空
            hoveredIndex = ''
        }
        // 如果触发 mouseover 的扇形不是透明圆环,将其高亮(对 option 更新)
        if (
            params.seriesName !== 'mouseoutSeries' &&
            params.seriesName !== 'pie2d'
        ) {

            // 从 option.series 中读取重新渲染扇形所需的参数,将是否高亮设置为 true。
            isSelected =
                this[optionName].series[params.seriesIndex].pieStatus.selected
            isHovered = true
            startRatio =
                this[optionName].series[params.seriesIndex].pieData.startRatio
            endRatio = this[optionName].series[params.seriesIndex].pieData.endRatio
            k = this[optionName].series[params.seriesIndex].pieStatus.k
            // 对当前点击的扇形,执行高亮操作(对 option 更新)
            this[optionName].series[
                params.seriesIndex
            ].parametricEquation = getParametricEquation(
                startRatio,
                endRatio,
                isSelected,
                isHovered,
                k,
                this[optionName].series[params.seriesIndex].pieData.value + 60
            )
            this[optionName].series[
                params.seriesIndex
            ].pieStatus.hovered = isHovered
            // 记录上次高亮的扇形对应的系列号 seriesIndex
            hoveredIndex = params.seriesIndex
        }
        // 使用更新后的 option,渲染图表
        myChart_6.setOption(this[optionName])
    }
})
// 修正取消高亮失败的 bug
myChart_6.on('globalout', () => {

    // 准备重新渲染扇形所需的参数
    let isSelected
    let isHovered
    let startRatio
    let endRatio
    let k
    if (hoveredIndex !== '') {

        // 从 option.series 中读取重新渲染扇形所需的参数,将是否高亮设置为 true。
        isSelected = this[optionName].series[hoveredIndex].pieStatus.selected
        isHovered = false
        k = this[optionName].series[hoveredIndex].pieStatus.k
        startRatio = this[optionName].series[hoveredIndex].pieData.startRatio
        endRatio = this[optionName].series[hoveredIndex].pieData.endRatio
        // 对当前点击的扇形,执行取消高亮操作(对 option 更新)
        this[optionName].series[
            hoveredIndex
        ].parametricEquation = getParametricEquation(
            startRatio,
            endRatio,
            isSelected,
            isHovered,
            k,
            this[optionName].series[hoveredIndex].pieData.value
        )
        this[optionName].series[hoveredIndex].pieStatus.hovered = isHovered
        // 将此前记录的上次选中的扇形对应的系列号 seriesIndex 清空
        hoveredIndex = ''
    }
    // 使用更新后的 option,渲染图表
    myChart_6.setOption(this[optionName])
})
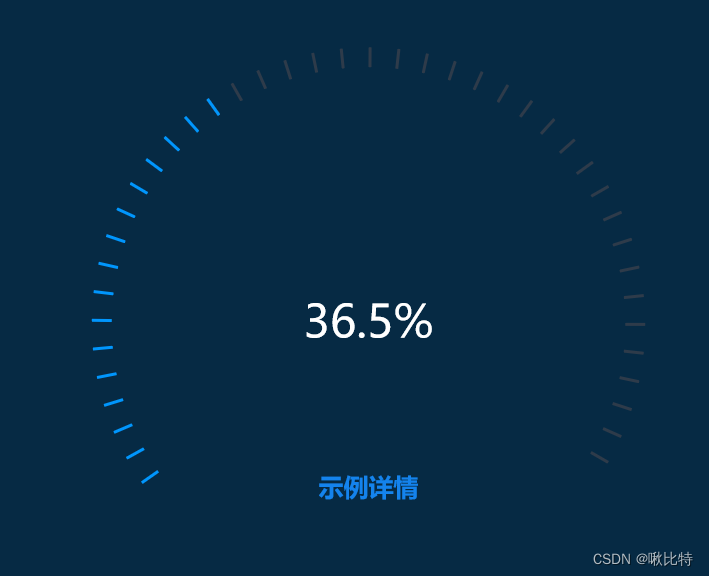
仪表盘
插件引入
- echarts.js
效果图
代码
var val = 36.5;
var value = val / 100;
var startAngle = 215;
var endAngle = -30;
var splitCount = 40; // 刻度数量
var fontSize = 45;
var pointerAngle = (startAngle - endAngle) * (1 - value) + endAngle;
option = {

  backgroundColor: "#062a44",
  tooltip: {

    show: true, // 是否显示提示框,默认为true
  },
  title: {

    show: true,
    x: "center",
    y: "70%",
    text: "示例详情",
    textStyle: {

      color: "#1483ED",
      fontWeight: "bold",
      fontSize: 25,
    },
  },
  series: [
    {

      // 值外
      type: "gauge",
      radius: "75%",
      startAngle: pointerAngle,
      endAngle: endAngle,
      splitNumber: 1,
      axisLine: {

        show: false,
        lineStyle: {

          width: 4,
          opacity: 0,
        },
      },
      title: {

        show: false,
      },
      detail: {

        color: "#fff",
        fontSize,
        offsetCenter: [0, 0],
        formatter: `${
      val}%`,
      },
      splitLine: {

        show: false,
      },
      axisTick: {

        length: 20,
        splitNumber: Math.ceil((1 - value) * splitCount),
        lineStyle: {

          color: "#2E3B4A",
          width: 3,
        },
      },
      axisLabel: {

        show: false,
      },
      pointer: {

        show: false,
      },
      itemStyle: {
    },
      markPoint: {

        animation: true,
        silent: false,
        data: [
          {

            symbolSize: 280,
            itemStyle: {

              borderWidth: 3,
            },
          },
          {

            symbol: "circle",
            symbolSize: 200,
          },
        ],
      },
      data: [
        {

          value: value,
          name: "test gauge",
        },
      ],
    },
    {

      // 值内
      type: "gauge",
      radius: "75%",
      startAngle: startAngle,
      endAngle: pointerAngle,
      splitNumber: 1,
      axisLine: {

        show: false,
        lineStyle: {

          width: 3,
          opacity: 0,
        },
      },
      tooltip: {

        show: true,
      },
      title: {

        show: false,
      },
      detail: {

        show: false,
      },
      splitLine: {

        show: false,
      },
      axisTick: {

        length: 20,
        splitNumber: Math.ceil(value * splitCount),
        lineStyle: {

          color: "#0096FD",
          width: 3,
        },
      },
      axisLabel: {

        show: false,
      },
      pointer: {

        show: false,
      },
      itemStyle: {
    },
      data: [
        {

          value: value,
          name: "test gauge",
        },
      ],
    },
  ],
};
电池图
插件引入
- echarts.js
效果图

代码
 var option_4 = {

        grid: [{
     //设置边距
            left: 55,
            bottom: 40,
            top: 20,
            right: 10
        }],
        yAxis: {
     //Y轴配置
            show: true,
            axisLine: {
     //轴线
                show: true,
                lineStyle: {

                    color: "#fff",
                    width: 1, //线宽
                    type: 'solid', //线的形状:'solid'、'dashed'、'dotted'
                    opacity: 1 //透明度:0~1
                }, //轴线的样式

            },
            axisTick: {
     //刻度线
                show: false,
                inside: false, //刻度线是否朝内
                length: 5, //刻度线长度
                lineStyle: {
     //刻度线样式
                    color: "#fff",
                    width: 1, //线宽
                }
            },
            axisLabel: {
     //坐标轴刻度标签
                show: true,
                color: "#fff",
                fontSize: 12,
                rotate: 0, //旋转角度,范围:-90~90
            },
            splitLine: {
     //分割线
                show: true,
                lineStyle: {
     //分割线样式
                    color: ['#fff'],
                    type: 'dashed', //线的形状:'solid'、'dashed'、'dotted'
                    opacity: .5
                }
            }
        },
        xAxis: {
     //X轴配置
            data: category, //X轴数据
            show: true,
            axisLabel: {
     //X轴文字样式
                color: '#a9aabc',
                fontSize: 12,
                interval: 0,
                padding: [10, 0, 0, 0],
                formatter: function (params) {

                    var newParamsName = "";
                    var paramsNameNumber = params.length;
                    var provideNumber = 5; //一行显示几个字
                    var rowNumber = Math.ceil(paramsNameNumber / provideNumber);
                    if (paramsNameNumber > provideNumber) {

                        for (var p = 0; p < rowNumber; p++) {

                            var tempStr = "";
                            var start = p * provideNumber;
                            var end = start + provideNumber;
                            if (p == rowNumber - 1) {

                                tempStr = params.substring(start, paramsNameNumber);
                            } else {

                                tempStr = params.substring(start, end) + "\n";
                            }
                            newParamsName += tempStr;
                        }
                    } else {

                        newParamsName = params;
                    }
                    return newParamsName;
                }
            },
            axisLine: {

                show: false
            },
            axisTick: {

                show: false,
            },
        },
        tooltip: {
     //以下方法二选一
            trigger: 'axis', //axis:坐标轴触发,主要在柱状图,折线图等会使用类目轴的图表中使用。item:数据项图形触发,主要在散点图,饼图等无类目轴的图表中使用。
            formatter: '时间:{b} <br/>订单数:{c0}', //模板变量有 {a}, {b},{c},{d},{e},分别表示系列名,数据名,数据值等。
            backgroundColor: "rgba(8, 36, 92, 0.8)",
            axisPointer: {
     //坐标轴指示器配置项。
                type: 'none' //'line' 直线指示器、'shadow' 阴影指示器、'none' 无指示器、'cross' 十字准星指示器。其实是种简写,表示启用两个正交的轴的 axisPointer。
            }
        },

        series: [{

            name: '',
            type: 'pictorialBar', //设置类型为象形柱状图
            symbol: 'roundRect', //图形类型,带圆角的矩形
            barWidth: '11%', //柱图宽度
            barMaxWidth: '20%', //最大宽度
            symbolMargin: '3', //图形垂直间隔
            animationDelay: (dataIndex, params) => {
     //每个图形动画持续时间
                return params.index * 50;
            },
            itemStyle: {

                normal: {

                    color: "#1EE6E7"

                }
            },
            z: 1,
            symbolRepeat: true, //图形是否重复
            symbolSize: [15, 6], //图形元素的尺寸
            data: count, //Y轴数据
            animationEasing: 'elasticOut', //动画效果,
            label: {

                normal: {

                    show: true,
                    position: 'top',
                    textStyle: {

                        color: "#fff"
                    }
                }
            },

        }]
    }
边栏推荐
- The best time to climb a ladder & sell shares (notes of the runner)
- After the active RM machine is powered off, RM ha switching is normal. However, the cluster resources cannot be viewed on the yarnui, and the application is always in the accepted state.
- 图的基本概念
- Golang为什么不推荐使用this/self/me/that/_this
- Convenient and easy to master, vivo intelligent remote control function realizes the control of household appliances in the whole house
- Adjacency matrix, adjacency table, cross linked list, adjacency multi table
- 插入排序
- Accumulate ERP global parameters, flexibly configure cost value rules, and complete accounting
- 线索二叉树
- ES无法工作,CircuitBreakingException
猜你喜欢

Internet of things UWB technology scheme, intelligent UWB precise positioning, centimeter level positioning accuracy

Get the specified row content in Oracle rownum and row_ number()

图的基本概念
TCL Huaxing released the world's first 0.016hz ultra-low frequency OLED wearable device screen

Wisdom, agriculture, rural areas and farmers digital Wang Ning: Tips for beginners on the first five days of trading

IDS interview questions collection data structure + penetration avalanche + persistence + memory elimination strategy + database double write + Sentinel

Sequential implementation of queues

首個女性向3A手遊要來了?獲IGN認可,《以閃亮之名》能否突出重圍
La première femme vient à 3A? Est - ce que Bright name, approuvé par IGN, peut mettre en évidence le classement

Laravel implements soft deletion
随机推荐
Tianyang technology - Bank of Ningbo interview question [Hangzhou multi tester] [Hangzhou multi tester \wang Sir]
How do redis and MySQL maintain data consistency? Strong consistency, weak consistency, final consistency
SQL operation: with expression and its application
FaceShifter. ipynb
图的BFS
Online document collaboration: a necessary efficient artifact for office
Laravel implements soft deletion
With this set of templates, it is easier to play with weekly, monthly and annual reports
Accumulate ERP global parameters, flexibly configure cost value rules, and complete accounting
Windows10 cannot access LAN shared folder
Search (intensive training)
EcRT of EtherCAT igh source code_ slave_ config_ Understanding of dc() function.
Tencent一面
Odoo Development Manual (I) the second day of contact with odoo
天阳科技-宁波银行面试题【杭州多测师】【杭州多测师_王sir】
[you don't understand the routing strategy? Try it!]
Binary tree cueing
哈夫曼树
Calculation of audio frame size
首個女性向3A手遊要來了?獲IGN認可,《以閃亮之名》能否突出重圍