当前位置:网站首页>Analysis of JMeter pressure measurement results
Analysis of JMeter pressure measurement results
2022-06-23 08:17:00 【Xiao Han's daily life】
This paper lists two kinds of commonly used pressure measurement result analysis listeners :【 Look at the fruit tree 】 and 【 Aggregation report 】 And the operation of running test plan without interface .
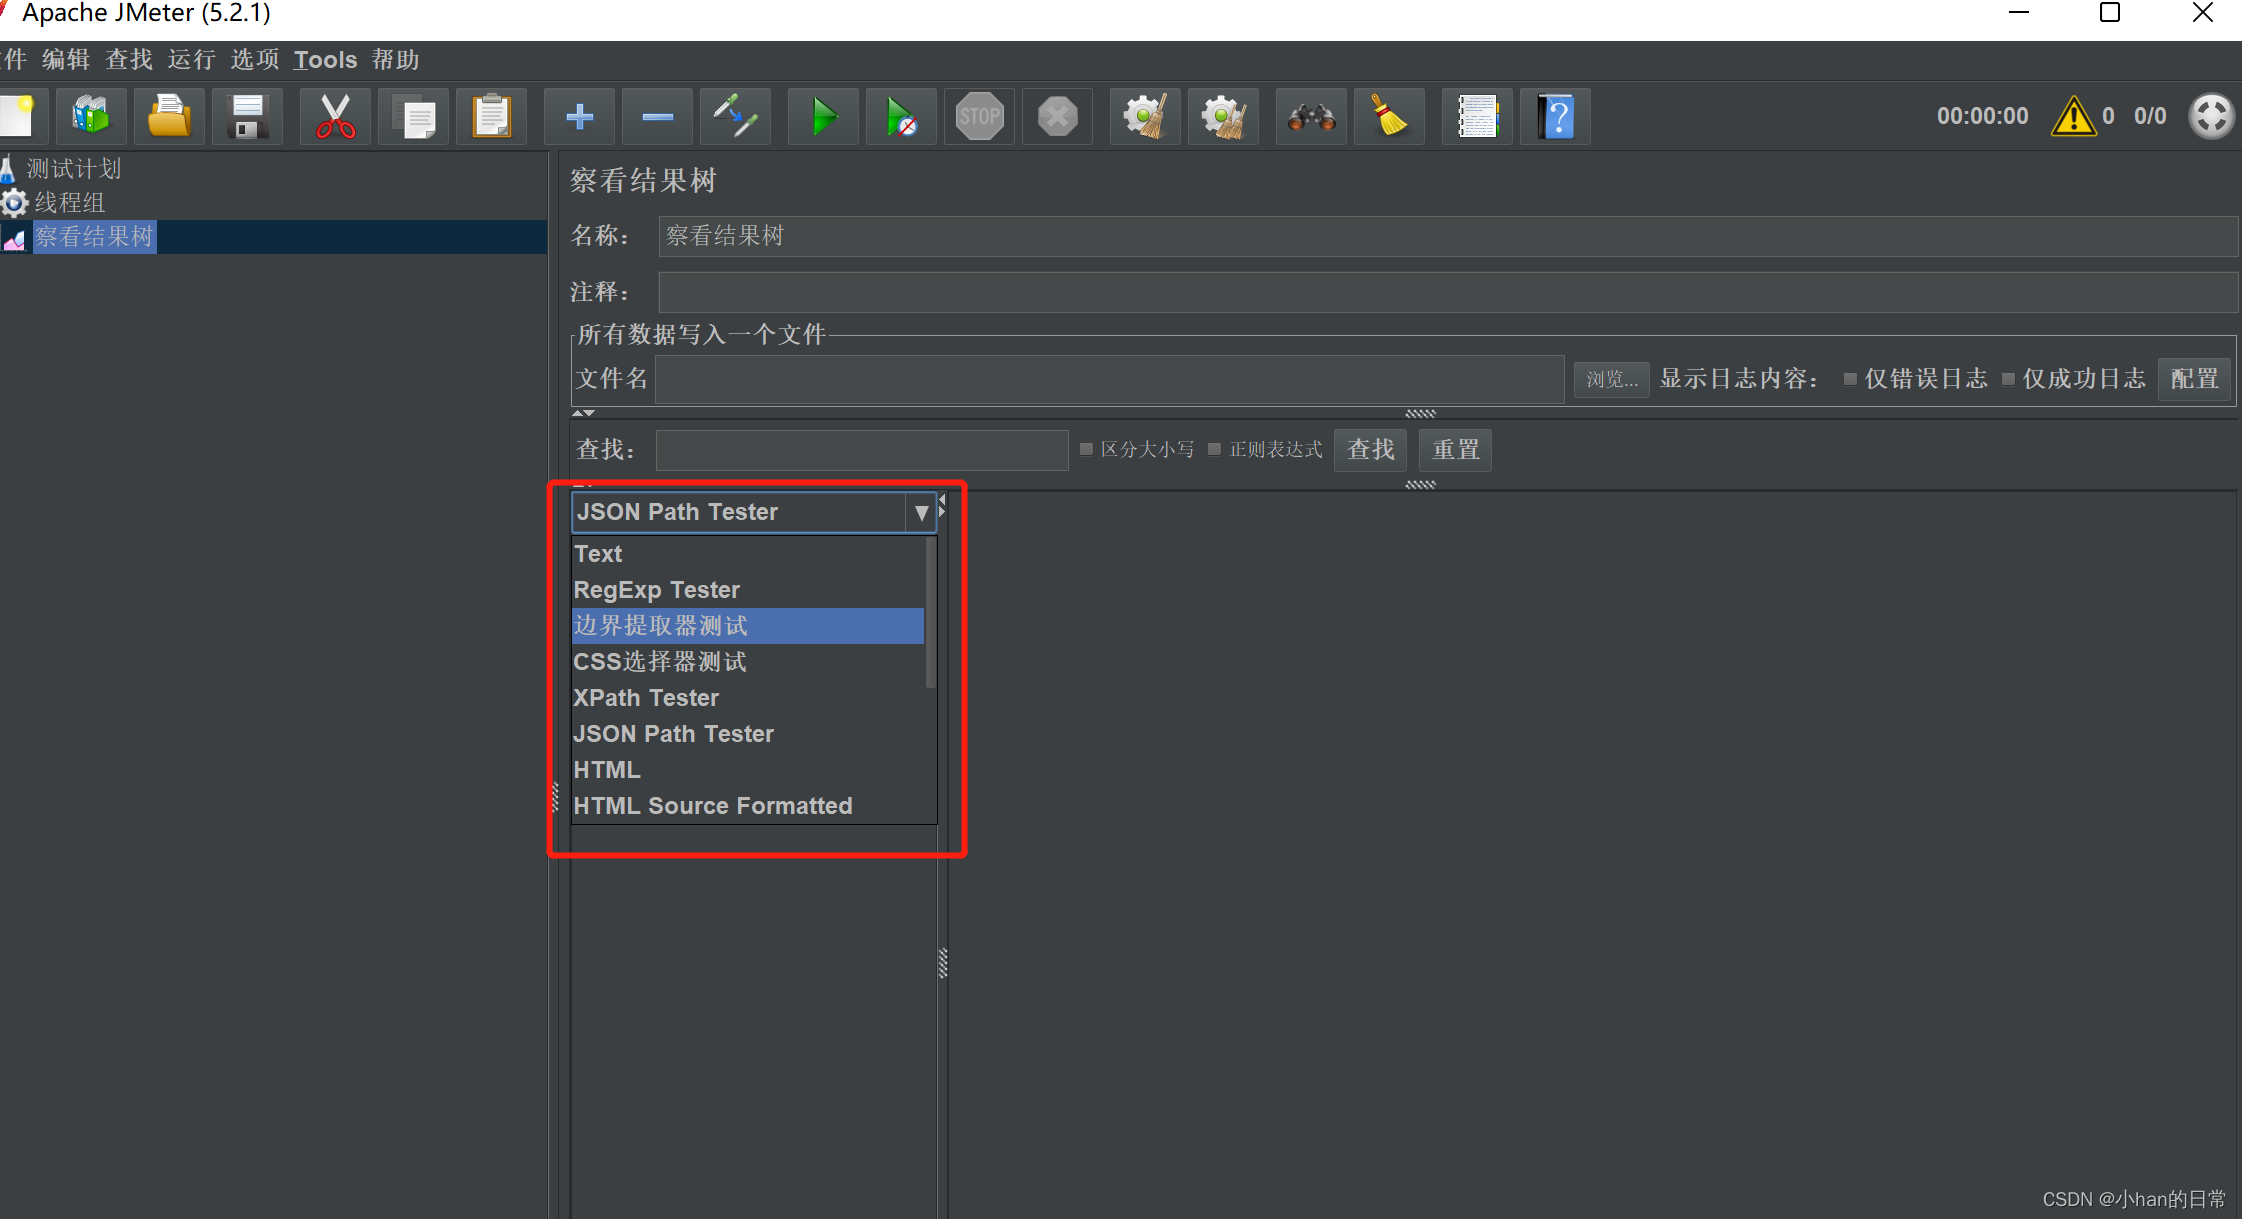
1、【 Look at the fruit tree 】viem results tree
Add... Under thread group 【 Look at the fruit tree 】
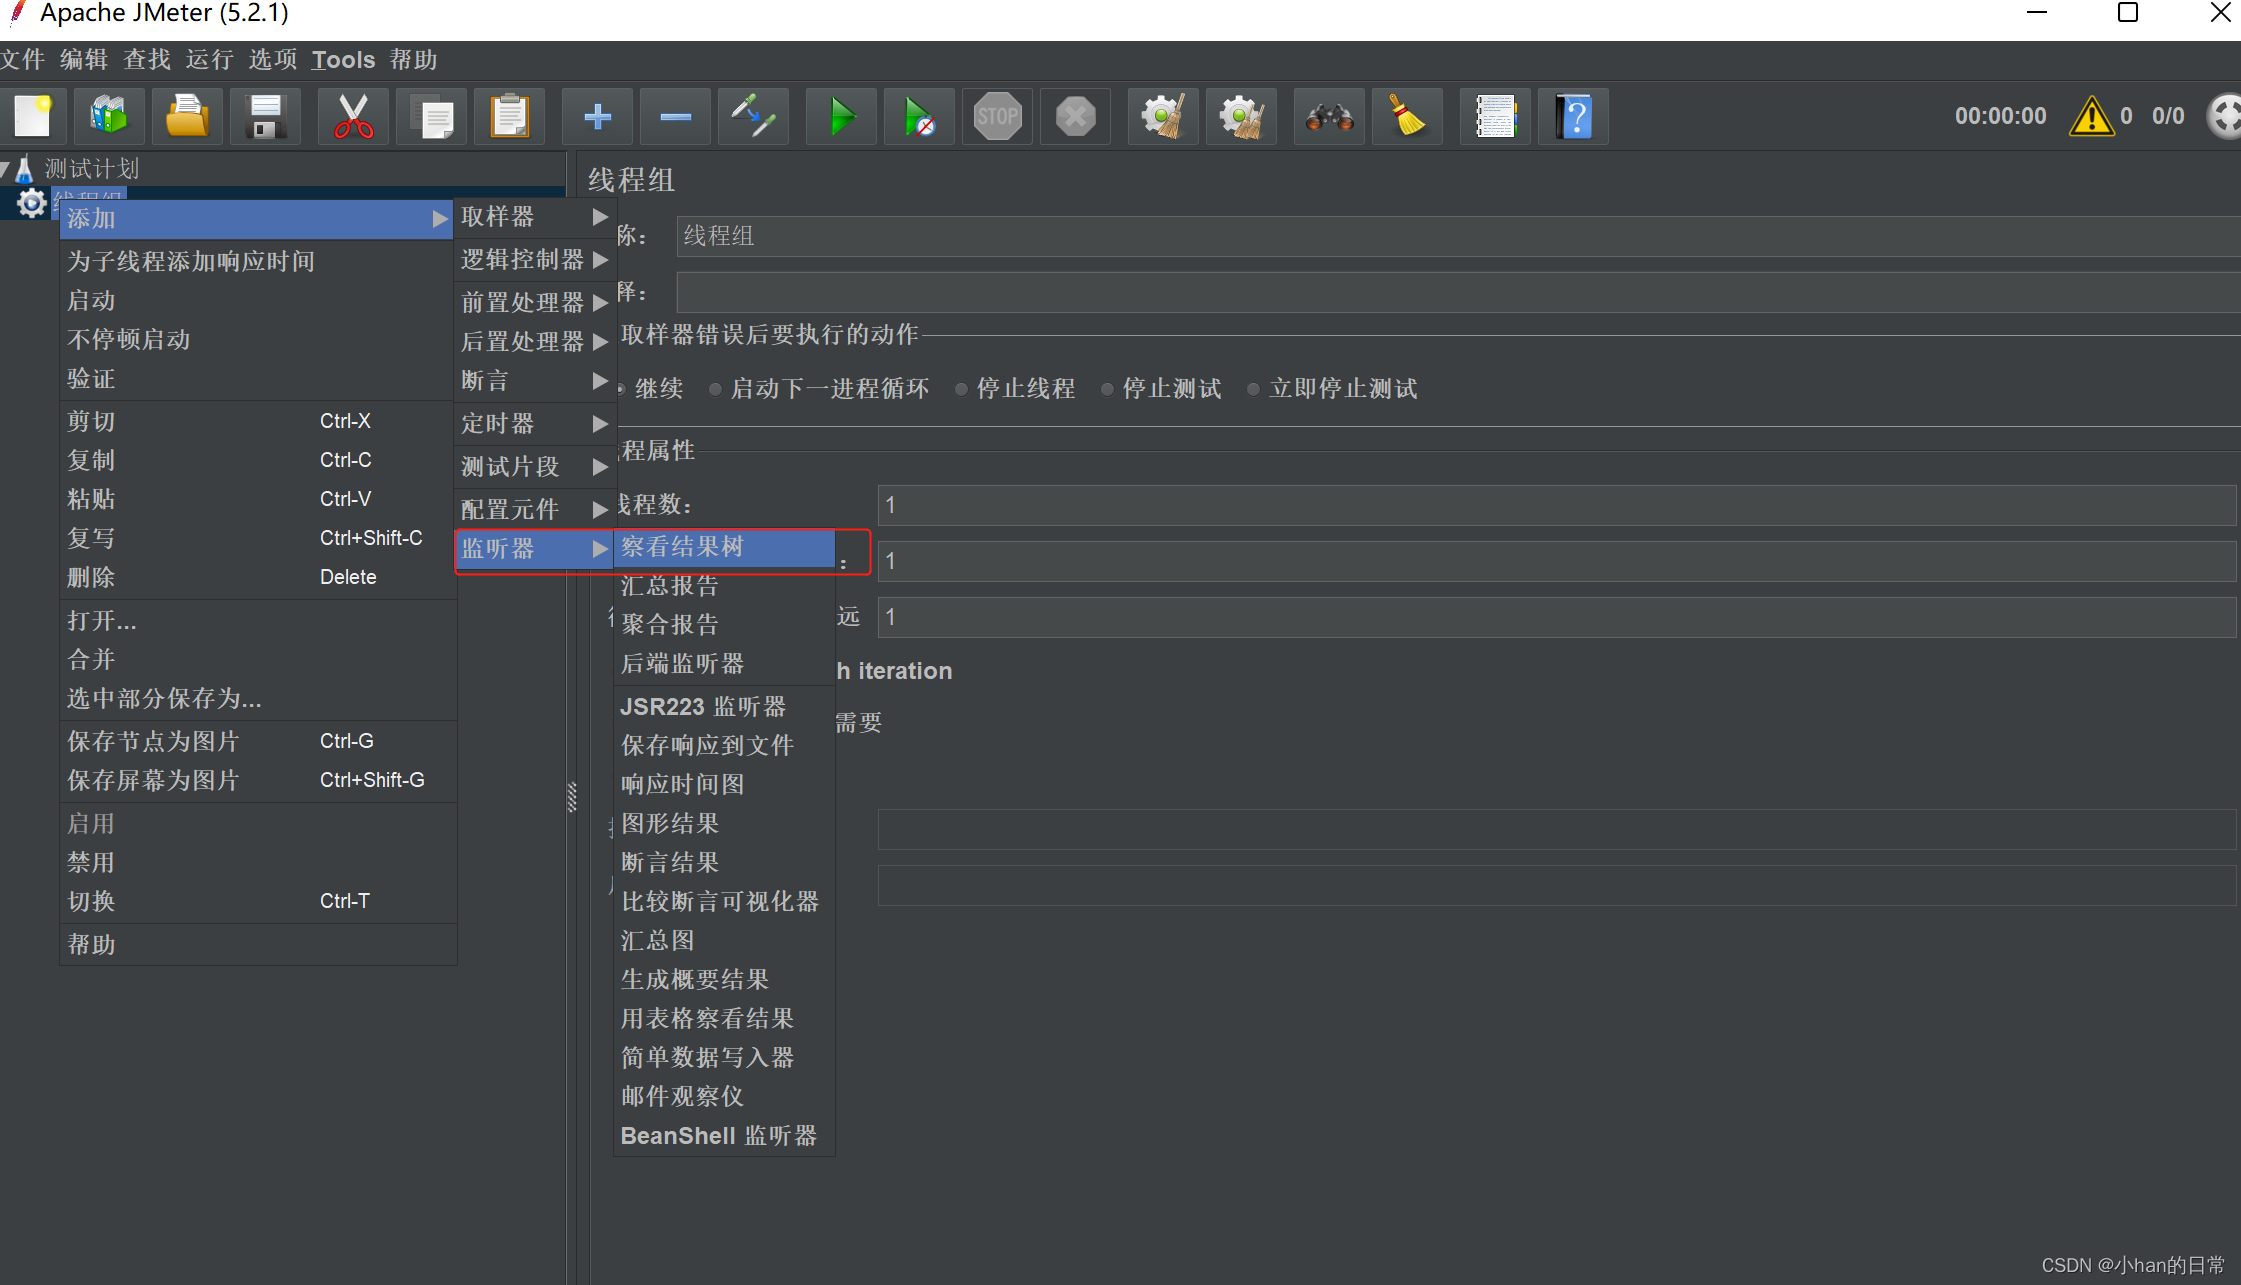
Add what you need 【http request 】, Then run the test plan , Generate the data , You can filter in the bottom left of the view result tree , Select the format as needed , Or by keyword 、 Regular expressions, etc. to view the return body information
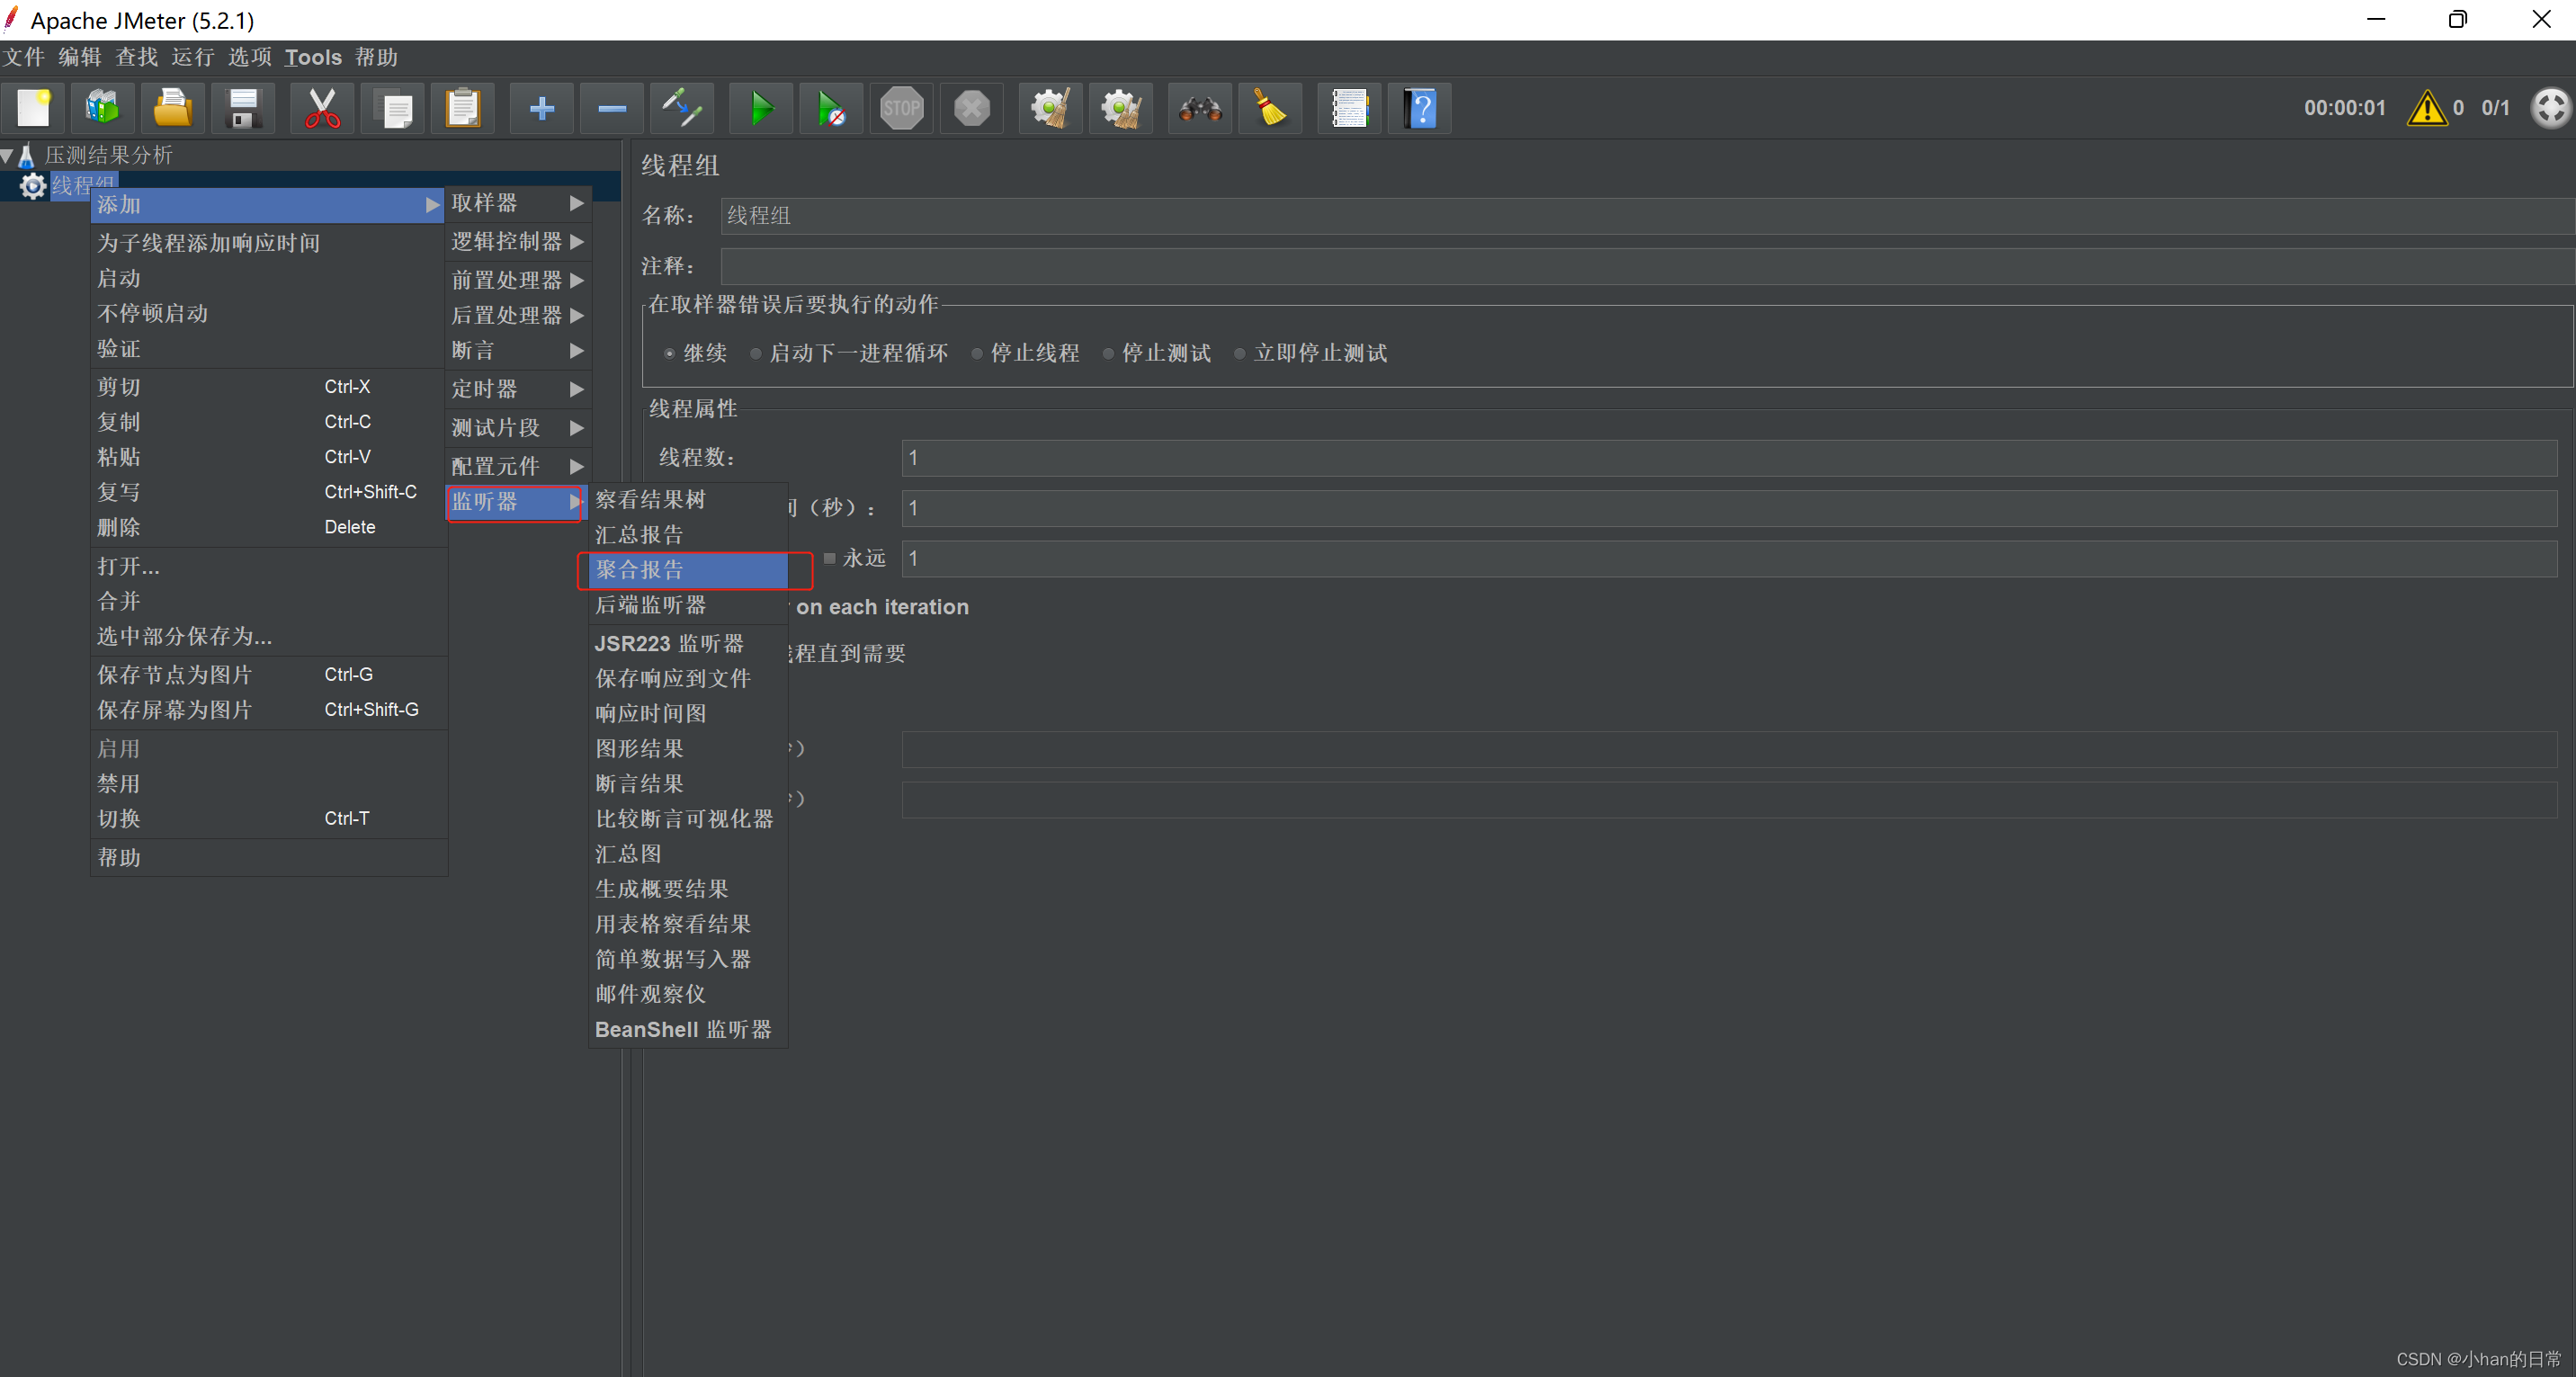
2、【 Aggregation report 】Aggregate Report
Add listener under thread group --【 Aggregation report 】
Average | Mean response time , Average response time for all requests ;ms |
Median | 50% The user response time of does not exceed this value ; |
99%line: | 99% The user response time of does not exceed this value ; |
Error% | Percentage of exceptions ( Number of error requests / Total number of requests ); |
Throughput: throughput | By default, the number of requests completed per second ;(1000/ Average * Number of threads ) |
Received KB/sec | receive data ; |

3、 Because during the pressure test , The page also takes up some resources , So here is the run test plan without interface , Save resources ;
First, configure the test plan on the interface , Save to the appropriate directory ( Here in bin New in the same directory result Catalog , Used to save the test plan )
d:
cd  jmeter\apache-jmeter-5.2.1\apache-jmeter-5.2.1\result
Select... Under this directory Aggregation report .jmx To demonstrate , At the same time .jtl Report on result Under the table of contents
D:\jmeter\apache-jmeter-5.2.1\apache-jmeter-5.2.1\bin\jmeter.bat -n -t Aggregation report .jmx -l Aggregation report .jtl
After completion of operation , Will generate log Log heel jtl file 
If during operation , Want to terminate the operation , Input Ctrl+C, The following information appears :
![]()
Input y, To stop the program .
4、jtl How the documents are handled
Switch to bin Under the table of contents , The implementation is as follows ;
【../result/ Aggregation report .jtl】--jtl The actual location of the file (result And bin The directory is at the same level )
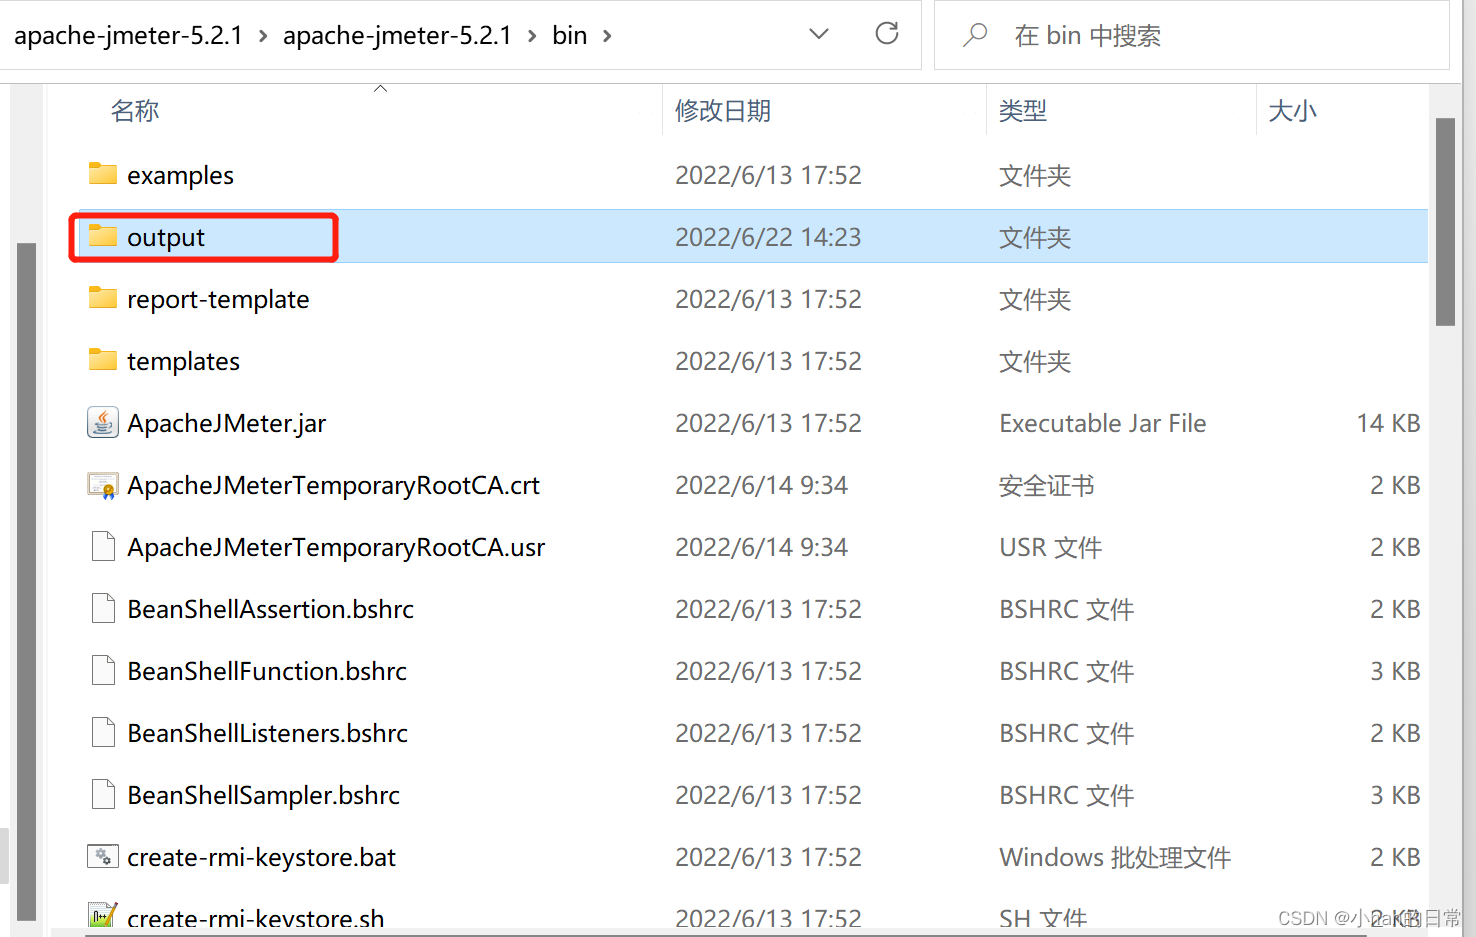
【-o hinder output】-- Customized file name and file location ( Here is generated in bin Under the table of contents )
jmeter.bat -g ../result/ Aggregation report .jtl -o output
After running, in bin Generate under directory output file

Use Chrome Browser view is OK

边栏推荐
猜你喜欢

目标检测中的多尺度特征结合方式
![Vulnhub | DC: 4 | [combat]](/img/33/b7422bdb18f39e9eb55855dbf1d584.png)
Vulnhub | DC: 4 | [combat]

给你的win10装一个wget

Active Directory之AD对象

81 sentences worth repeating
PHP serialization and deserialization CTF

What are open source software, free software, copyleft and CC? Can't you tell them clearly?

Check the file through the port
jmeter压测结果分析

Basic use of check boxes and implementation of select all and invert selection functions
随机推荐
MySQL小册子笔记 5 InnoDB 记录存储结构
Structure and usage of transform
Deep learning ----- convolution (conv2d) bottom layer
Huawei ECS EIP cannot be pinged
ArcLayoutView: 一个弧形布局的实现
Implementation of AVL tree
Quickly create a consumer cluster
C# 内存法复制图像bitmap
Apache Solr arbitrary file read replication
What are open source software, free software, copyleft and CC? Can't you tell them clearly?
There are some limitations in cluster expansion and contraction
Fillet the tabbar with the flutter
Copy image bitmap by C # memory method
Go data types (II) overview of data types supported by go and Boolean types
[try to hack] IP address
Two bug fixes in aquatone tool
6-闪耀的激光-CALayer 的应用
Openvino series 19 Openvino and paddleocr for real-time video OCR processing
数据资产为王,解析企业数字化转型与数据资产管理的关系
Pyspark on HPC (Continued): reasonable partition processing and consolidated output of a single file