当前位置:网站首页>File depth monitoring strategy
File depth monitoring strategy
2022-07-26 19:25:00 【buhui912】
background
Recently, many project team reports have been lost , The file is tampered with bug list . So I want to make a file monitoring plan , You can monitor abnormal operations under some directories or files , We can find the culprit of the abnormal operation of the file and the time point of the abnormal operation in time , And timely output log journal .
In this way, if it is pushed to the user , Users only need to customize some monitoring events ,push To sdcard Under the root directory , Then turn on the monitoring , You can be free from the influence of switching on and off in the future , Permanent continuous monitoring file abnormal operation .
The project design
This monitoring scheme is designed , Nothing more than the following points need to be considered :
1: Whether it affects the performance of the mobile phone
2: generality
3: Excellent performance
4: It is easy to operate
A: Whether it affects the performance of the mobile phone
I think this is the most important .
You can take the current file missing Take the problem scenario as an example , The recurrence probability of this problem on the user side is low , And the randomness is large , It is the ever-changing scenarios of file loss that occur on the user's side , And the factors leading to the loss of files are very extensive , It's difficult to check , Many modules on mobile phones cannot escape the relationship .
So there needs to be a plan , Deploy to users , Once monitoring is turned on , Able to persist , Long run , So as to find the cause of abnormal operation of the file as much as possible . If you run for a long time , Then users must not tolerate affecting the performance of mobile phones , For example, after the mobile phone starts monitoring , File access slows .
The scheme is designed , Consider this first , I chose inotify As the core implementer of the monitoring scheme .
inotify Characteristics in this respect :
1: User mode monitoring process , When there is no monitoring event , It's sleep . When there is a monitoring event , The kernel can immediately wake up the monitoring process , So that the monitoring process can output abnormal operation events .
2: Processing of kernel event listening , It's using inode The behavior of node markers .
inotify Users need to specify some directories or files to be monitored , There are also events that need to be monitored ( Delete or Tampering ). After designation , These directories or files correspond to iNode Nodes will be marked inotify label . Thus, when the kernel file system module is on inode When the node operates , It will see whether the node is marked inotify label .
If it is labeled , And it's time to inode Node operation is when the user specifies the event to be monitored , This is the time ,inotify Architecture will output log Information , Finally, wake up the user monitoring process to deal with .
Performance impact analysis :
1 User mode :
From the first point above : When the event to be monitored does not occur , User mode monitoring process is always in sleep state , Unless something happens . Therefore, user mode monitoring process has little impact on performance .
2 Kernel mode :
because inotify The code has been closely combined with the file system module code , Even without my monitoring mechanism changes Or add a monitoring mechanism changes, When monitoring is not turned on , The kernel file system works normally , I'll go to fsnotify Inside ( See the following deficiencies for details 1 analysis ).
When monitoring is on , Only the files specified by the user for monitoring will be used to judge whether the monitoring event occurs , Output after occurrence log Record . If the user does not specify a file, he will not make a judgment .
Therefore, the user does not specify the monitored file , The performance is the same as when monitoring is not turned on . So the monitoring mechanism in kernel mode It has little impact on system performance .
Although inotify monitor , Kernel mode also requires additional work ( Judge whether the monitoring event occurs and monitor the processing process ), But the performance of the mobile phone is weighed against Excellent completion of monitoring function , I think it is better to adopt inotify better .
B: generality
This refers to a monitoring scheme , Users can customize monitoring events at will , Monitoring Directory . It can not only monitor the loss of files , And it can also monitor the file being acess,modify,move in, move out. Consider from this aspect ,inotify Is the right candidate .
C: Excellent performance
This aspect , Native inotify monitor Yes 3 Not enough :
1: inotify Only the events that need to be monitored can be reported , But we can't find out which process is performing abnormal operations , And the time point when the abnormal event occurred was not recorded .
2: inotify Used to monitor events in the directory , You cannot recursively monitor the dynamically generated subdirectories in this directory .
3: When an abnormal event occurs , Cannot generate detailed log, For developers to analyze .
So for inotify Have been transformed .
Solve the shortage 1:
You need to clarify the kernel state first inotify The code architecture . As discussed above inotify whether When affecting the performance of mobile phones , Already said. inotify It's using inode Method of node marking .
Or take the specific code as an example , Discuss solutions .
inotify Kernel code is divided into front-end and back-end processing .
The front is File system each inode Node operation , Such as unlink, rmdir, write, read. The back end is when these operations occur , Call at the right time inotify The module outputs monitoring events .
With unlink For example :
unlinkat → do_unlinkat → vfs_unlink2 → d_delete
fs/dcache.c Inside d_delete:
|
include/linux/fsnotify.h Inside :
fsnotify_nameremove → fsnotify_parent → fsnotify → send_to_group → group->ops->handle_event
fs/notify/inotify/inotify_fsnotify.c Inside :
|
|
From the whole code flow above , User mode process or thread execution flow Will eventually come to inotify_handle_event Inside , In order to solve the shortage 1, Can be in Add some code to the place where the monitoring event record is generated , because inotify_handle_event The call of still belongs to the front end inode Process context of node operation . Add some code here , Get the current process Pid,name, group process leader pid and name, also The time when the abnormal operation occurred .
Solve the shortage 2:
This is what needs to be transformed external/toybxo/toys/other/inotifyd.c file , Specifically, when reading the monitoring events reported from the kernel state in a circular way , Add processing as follows :
If the event of adding subdirectories is reported , Just call inotify_add_watch Add monitoring of this subdirectory .
In this way, deficiencies can be solved 1,2,inotify The function of Become stronger , When an abnormal operation occurs , Output the process of abnormal operation in time pid, name, There is also the process group where the process is located leader Of pid,name, also Abnormal operation time . Through these log Output , We will probably find out the culprit for the abnormal operation .
Solve the shortage 3:
although inotify You can already find the process name of the abnormal operation ,pid 了 . But sometimes , These information alone is not enough to provide effective information for development to find out the root cause of this abnormal operation .
Therefore, it also provides abnormal monitoring when an event occurs , Able to output logcat journal , So compare inotify Output The process name of the abnormal operation of , Abnormal operation time point , You can go through log Fast location The root cause .
however logcat Output Here's the problem .
For example, monitor the deletion of a file , Because it is impossible to distinguish between normal deletion and abnormal deletion , So whether normal or abnormal , Metropolitan output logcat. In this case , Output logcat The number of files will increase .
Here is the scene of photo loss , This problem has been optimized for the time being :
Every ten minutes , Judge whether there is a new event to be monitored , If it happens , Output copies logcat.
reason :
1: For the scene of photo loss , Under normal circumstances, the operation of deleting photos will not be too frequent . Users delete photos , It's usually doing photo sorting . If you judge at intervals of ten minutes , Be able to screen out a finishing job , Output One copy logcat.
This output logcat The number of copies is not much .
2: Deletion under abnormal operation , Because it has been accurately recorded inotify Output log file ( This document follows logcat The document is two separate documents ), So it has been more than ten minutes since the abnormal operation , This incident ,logcat Inside log It should not be washed away .
So it only takes more than ten minutes , Under output logcat That's it . Then compare inotify The deletion time point in the output file , Just look at the name of the deletion process .
D: It is easy to operate
1: First of all, the operation process of mobile phone secret code is designed , Monitoring can be turned on or off through the secret code . And after the phone is turned on again , The previous monitoring status can still be maintained .
2: Most convenient , The most effective operation is to enable cloud monitoring , Cloud delivery monitoring events , In view of the lack of development time , At present, in addition to the implementation of mobile phone password operation monitoring , Users are also required push A monitoring file To mobile phone sdcard Under the root directory .
The contents of the monitoring file are as follows ( Take photo monitoring as an example ):
|
In fact, it lists the directories or files that need to be monitored , And events that need to be monitored .
边栏推荐
- (ICLR-2022)TADA! Time adaptive convolution for video understanding
- 3r平衡型理财产品会有风险吗?风险大吗?
- Sre person in charge of station B personally describes the multi activity disaster recovery construction after the 713 accident | takintalks share
- J2 Redis之 AOF&RDB
- C language - Introduction - syntax - string (11)
- [yolov5] - detailed version of training your own dataset, nanny level learning, logging, hand-in-hand tutorial
- C#创建及读取DAT文件案例
- 节省50%成本 京东云发布新一代混合CDN产品
- “蔚来杯“2022牛客暑期多校训练营2
- torch.unsqueeze() squeeze() expand() repeat()用法及比较
猜你喜欢

This article explains in detail the five benefits that MES system brings to enterprises, with application scenarios

2022 build enterprise level data governance system

I'm cool, so I'm here
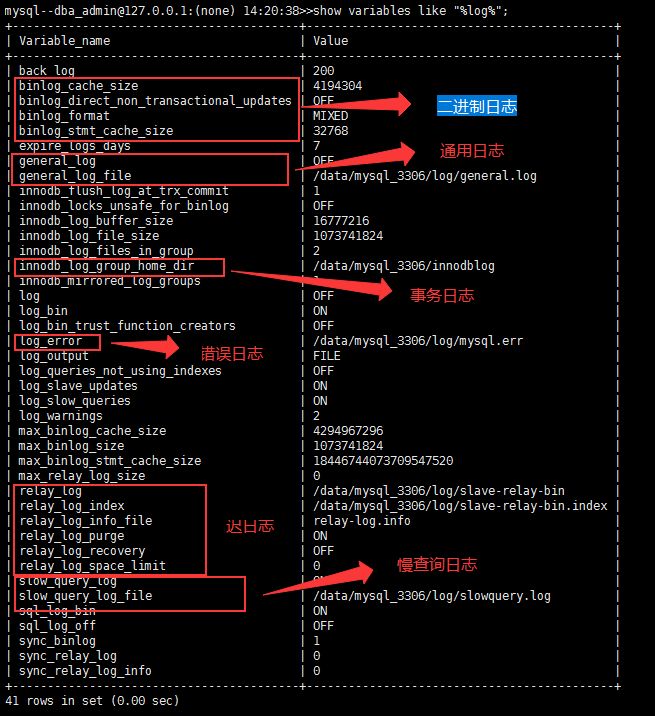
MySQL日志介绍

Description of MDM separation of powers and classification and grading authority

How many pairs can an array of leetcode simple questions form

PMP practice once a day | don't get lost in the exam -7.26 (including agility + multiple choices)
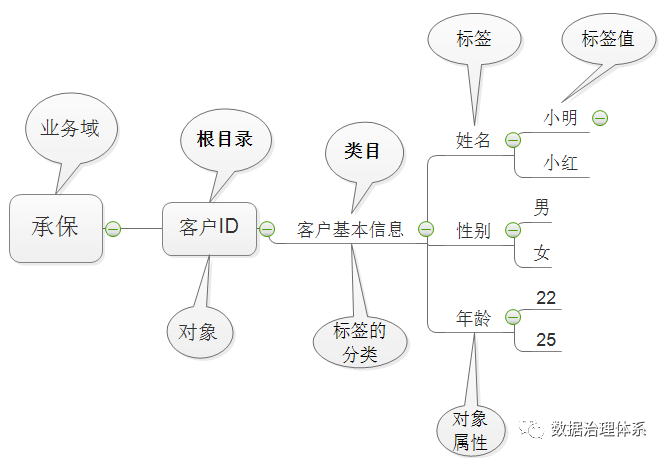
What do indicators and labels do

"Weilai Cup" 2022 Niuke summer multi school training camp 1

ReentrantLock学习之---基础方法
随机推荐
【YOLOv5】--详细版训练自己的数据集 保姆级学习日志记录 手把手教程
如果密钥忘记,多个设备分别不同的密钥,云端是如何同步
The first letter of leetcode simple question appears twice
C language - Introduction - syntax - string (11)
Some time series modeling strategies (I)
torch. Usage and comparison of unsqueeze() squeeze() expand() repeat()
Don't casually pass the request to the asynchronous thread. You can't handle it. You have to use the startasync method
微信小程序插件--wxml-to-canvas(生成图片)
Here comes the most complete introduction to MES system
J2 Redis之 AOF&RDB
Basic module and example pytorch learning
手写一个Starter
JVM内存模型之Volatile关键字
Unity 农场 2 —— 种植系统
Configure the server environment
周末看点回顾|数字人民币产业联盟成立;中国移动宣布:和飞信将停止服务…
"Weilai Cup" 2022 Niuke summer multi school training camp 1
What is a server cluster? What are the advantages of overseas server clusters?
MySQL log introduction
MongoDB stats统计集合占用空间大小