当前位置:网站首页>Data processing and visualization of machine learning [iris data classification | feature attribute comparison]
Data processing and visualization of machine learning [iris data classification | feature attribute comparison]
2022-06-11 23:03:00 【Hua Weiyun】
One , Preface
1.1 This paper is based on the principle
Most machine learning models deal with features , The feature is usually the numerical representation of the input variable that can be used for the model .
In most cases , The collected data needs to be processed before it can be used by the algorithm . Usually , There are many different characteristics in a dataset , Some of them may be redundant or irrelevant to the value we want to predict , It can be filtered through data processing and visualization .
The necessity of feature selection technology is also reflected in the simplified model 、 Reduce training time 、 Avoid dimension explosion and promote generalization to avoid over fitting .
1.2 Purpose
1. Familiar with data processing and visualization methods of machine learning
2. Use data processing and visualization methods to analyze data characteristics
1.3 Objectives and contents
1. install scikit-learn Machine learning and its related python package ;
2. Download the iris data set in the program ;
3. Use matplotlib Compare and draw the characteristics of iris data set ;
4. Analyze the characteristics of the drawn iris visual map to clearly distinguish the categories of iris ;
1.4 This paper is based on the environment
1.PC machine
2.Windows10
3.Scikit-learn Installation package
4.jupyter Editor or pycharm etc. python Editor 
Two , Experimental process
2.1 install scikit-learn Machine learning related modules
The installation process is a little bit , Direct installation scikit-learn modular , Domestic image installation can be adopted , It saves time .
Input
pip show scikit-learn Check whether the local environment is successfully installed 【scikit-learn】 This module .
2.2 Download the iris data set in the program
We use load_iris Data sets , In total, including 150 rows , The first four columns are calyx length , Calyx width , Petal length , Petal width 4 An attribute that identifies iris ,‘sepal_len’,‘sepal_wid’,‘petal_len’,‘petal_wid’.
The first 5 In the category of iris ( Include Setosa,Versicolour,Virginica Three types of )
The code is as follows
1.import matplotlib.pyplot as plt2.from sklearn.datasets import load_iris3.iris = load_iris()4.X = iris.data5.print(X.shape, X) We output X Take a look at this 150 Group data :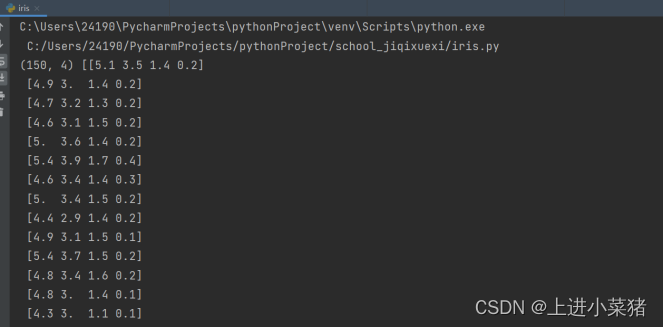
2.3 Use matplotlib Compare and draw the characteristics of iris data set
Because we will use figure Method , Let's define the size first , Give Way 16 Subgraphs can be output appropriately . The following code :
plt.figure(figsize=(44,44))We need output 16 Subtext , Set the variable to 4, Traverse twice .
feature_max_num=4Traverse twice , as follows :
for feature in range(feature_max_num): for feature_other in range(feature_max_num): You can imagine :
Namely 0-0,0-1,0-2,0-3,1-0,1-1……
Yes 16 Combinations of , It is also necessary to take the characteristic value .
We need to set the position of each subgraph , You can draw these subgraphs in turn , The advantage is simplicity , The disadvantage is that it is a little troublesome .
The following code :
plt.subplot(feature_max_num,feature_max_num,feature*feature_max_num+feature_other +1,frame_on= True) We need to think about , If 0-0,1-1,2-2, This is a special case , Let's deal with it separately .
plt.scatter We need to understand the properties of : as follows
matplotlib.pyplot.scatter(x, y, s=None, c=None, marker=None, cmap=None, norm=None, vmin=None,
vmax=None, alpha=None, linewidths=None, verts=None, edgecolors=None, hold=None, data=None, **kwargs)
- x, y → The coordinates of the scatter point
- s → The area of the scatter
- c → Scattered color ( The default is blue ,‘b’, Other colors are the same as plt.plot( ))
- marker→ Scatter style ( The default value is filled circle ,‘o’, Other styles are the same as plt.plot( )) alpha → Scatter transparency ([0,1] Number between ,0 Indicates full transparency ,1 Is completely opaque )
- linewidths → Edge lineweight of scatter points edgecolors → The edge color of the scatter
if feature==feature_other: # A special case If ,feature==feature_other, If the traversal values are the same ,x, y → The coordinates of the scatter points are the same , It's not very intuitive , Let's go straight to x The coordinates of the scatter point set a self increasing variable , Let it come from 0 To 49 Self increasing .
plt.scatter([i for i in range(50)],X[0:50,feature],color='green',marker='o',label='setosa') ... ...In other cases :x, y → The coordinates of the scatter points are different , You can draw normally
else: plt.scatter(X[0:50,feature],X[0:50,feature_other],color='green',marker='o',label='setosa') ... ...Above code explanation :
X[0:50,feature],X[0:50,feature_other]
Represent the x, y → The coordinates of the scatter point , Because we have 150 Group target data , We get the target data set from the data set according to different characteristic values . Perform drawing processing .
Need to understand grammar :
a[:,1] The meaning of , You can understand .
Now we need to set X Axis and Y The label of the shaft . The grammar is as follows :
xlabel(xlabel, fontdict=None, labelpad=None, *, loc=None, **kwargs)
- xlabel: Type is string , The text of the label .
- fontdict: dict, A dictionary is used to control the font style of labels
- labelpad: The type is floating point number , The default value is None, That is, the distance between the label and the coordinate axis .
- loc: The value range is {‘left’, ‘center’, ‘right’}, The default value is rcParams[“xaxis.labellocation”](‘center’), The location of the label .
- **kwargs:Text Object key attribute , Used to control the appearance properties of text , Like typeface 、 Text color, etc .
plt.xlabel(iris.feature_names[feature]) plt.vlabel(iris.feature_names[feature_other])Finally, set the legend position , Output image .
plt.legend(loc='best')plt.show() The renderings are as follows :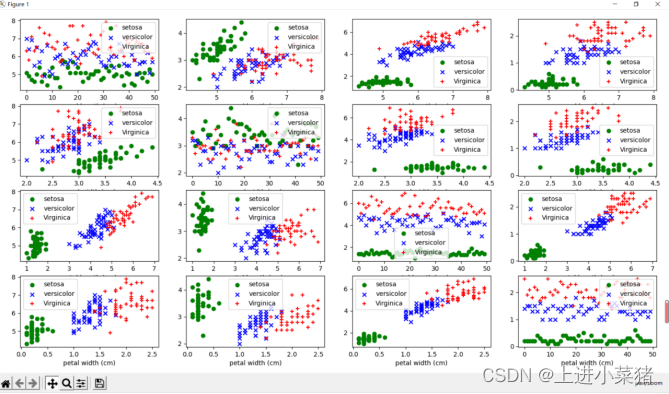
2.4 Analyze the characteristics of the drawn iris visual map to clearly distinguish the categories of iris
According to the figure 0-2 ,1-3 distinct .
The length of sepals and petals can be seen , The characteristics of sepal width and petal width can clearly distinguish Iris species .
3、 ... and , The source code involved in this article is attached
The source code involved in this paper is as follows , It can run directly :
import matplotlib.pyplot as pltfrom sklearn.datasets import load_irisiris = load_iris()X = iris.dataprint(X.shape, X)plt.figure(figsize=(44,44))feature_max_num=4for feature in range(feature_max_num): for feature_other in range(feature_max_num): plt.subplot(feature_max_num,feature_max_num,feature*feature_max_num+feature_other +1,frame_on= True) if feature==feature_other: plt.scatter([i for i in range(50)],X[0:50,feature],color='green',marker='o',label='setosa') plt.scatter([i for i in range(50)],X[50:100,feature],color='blue',marker='x',label='versicolor') plt.scatter([i for i in range(50)],X[100:,feature],color='red',marker='+',label='Virginica') else: plt.scatter(X[0:50,feature],X[0:50,feature_other],color='green',marker='o',label='setosa') plt.scatter(X[50:100,feature],X[50:100,feature_other],color='blue',marker='x',label='versicolor') plt.scatter(X[100:,feature],X[100:,feature_other],color="red",marker='+',label='Virginica') plt.xlabel(iris.feature_names[feature]) plt.vlabel(iris.feature_names[feature_other]) plt.legend(loc='best')plt.show()边栏推荐
- Research Report on development trend and competitive strategy of global customized power supply industry
- SecurityContextHolder.getContext().getAuthentication().getPrincipal()获取到的是username而不是UserDetails
- [day4 literature intensive reading] space – time interdependence: evidence against Asymmetric mapping between time and space
- Meetup review how Devops & mlops solve the machine learning dilemma in enterprises?
- 2022 online summit of emerging market brands going to sea will be held soon advance AI CEO Shou Dong will be invited to attend
- 队列(C语言)
- [day6-7 intensive literature reading] a unifying Bayesian framework accounting for spatiotemporal interactions with a
- Wireless communication comparison of si4463, si4438 and Si4432 schemes of wireless data transmission module
- volatile的解构| 社区征文
- Super Codex from the open source world, the authoritative release of China's open source Codex list!
猜你喜欢

The key to the safe was inserted into the door, and the college students stole the mobile phone numbers of 1.1 billion users of Taobao alone

【Day4 文献精读】Space–time interdependence: Evidence against asymmetric mapping between time and space
Huawei equipment configuration hovpn
![[day15 literature extensive reading] numerical magnetic effects temporary memories but not time encoding](/img/57/9ce851636b927813a55faedb4ecd48.png)
[day15 literature extensive reading] numerical magnetic effects temporary memories but not time encoding

【Day3 文献精读】Asymmetrical time and space interference in Tau and Kappa effects

Super Codex from the open source world, the authoritative release of China's open source Codex list!

The second bullet of in-depth dialogue with the container service ack distribution: how to build a hybrid cloud unified network plane with the help of hybridnet
【Day15 文献泛读】Numerical magnitude affects temporal memories but not time encoding

Leetcode must review 20 lintcode (5466421166978227)

Discrete mathematics attention points, priority problems
随机推荐
Research Report on development trend and competitive strategy of global customized power supply industry
Fastapi 5 - common requests and use of postman and curl (parameters, x-www-form-urlencoded, raw)
Point cloud read / write (2): read / write TXT point cloud (space separated | comma separated)
【Day4 文献精读】Space–time interdependence: Evidence against asymmetric mapping between time and space
Figure overview of neural network
Read dense visual slam for rgb-d cameras
Three years of college should be like this
双向带头循环链表(C语言)
Library management system
Gcache of goframe memory cache
Discrete mathematics attention points, priority problems
Analysis on the market prospect of smart home based on ZigBee protocol wireless module
Data visualization platform based on template configuration
postgresql10 进程
Jetpack架构组件学习(3)——Activity Results API使用
Exercise 8-5 using functions to realize partial copying of strings (20 points)
Try catch
C language simple exercise No.17, about the combination of for and while loops
直播预告|FeatureStore Meetup V3 重磅来袭!
Number of classified statistical characters (15 points)