当前位置:网站首页>R language penalty logistic regression, linear discriminant analysis LDA, generalized additive model GAM, multiple adaptive regression splines Mars, KNN, quadratic discriminant analysis QDA, decision
R language penalty logistic regression, linear discriminant analysis LDA, generalized additive model GAM, multiple adaptive regression splines Mars, KNN, quadratic discriminant analysis QDA, decision
2022-06-28 03:05:00 【Extension Research Office】
Link to the original text :http://tecdat.cn/?p=27384
The source of the original text is : The official account of the tribal public
Introduce
The data contains information about Portugal “Vinho Verde” Wine information . The dataset has 1599 Observations and 12 A variable , They are fixed acidity 、 Volatile acidity 、 Citric acid 、 Residual sugar 、 Chloride 、 Free sulfur dioxide 、 Total sulfur dioxide 、 density 、pH value 、 Sulfates 、 Alcohol and quality . Fixed acidity 、 Volatile acidity 、 Citric acid 、 Residual sugar 、 Chloride 、 Free sulfur dioxide 、 Total sulfur dioxide 、 density 、pH、 Sulfate and alcohol are independent variables and continuous . Quality is a dependent variable , according to 0 To 10 To measure .
Exploratory analysis
All in all 855 This wine is classified as “ good ” The quality of ,744 This wine is classified as “ Bad ” The quality of . Fixed acidity 、 Volatile acidity 、 Citric acid 、 Chloride 、 Free sulfur dioxide 、 Total sulfur dioxide 、 density 、 Sulfate and alcohol content were significantly correlated with wine quality ( t Tested P value < 0.05), This indicates an important predictor . We also constructed density maps to explore 11 Continuous variables in “ Bad ” and “ good ” Distribution of wine quality . As you can see from the diagram , Fine wines are in PH There is no difference in , And different types of wine have differences in other variables , This is related to t The inspection results are consistent .
na.oit() %>
muate(qal= ase_hen(ality>5 ~good", quaity <=5 ~ "poor")) %>%
muate(qua= s.fatrqual)) %>%
dpeme1 <- rsparentTme(trans = .4)

plot = "density", pch = "|",
auto.key = list(columns = 2))
chart 1. Description diagram between wine quality and predicted characteristics .
surface 1. The basic characteristics of good and bad wines .
#  In the table 1 Create a variable we want in
b1 <- CeatTableOe(vars  litars, straa = ’qual’ da wine
tab 
Model
We randomly choose 70% As training data , The rest is used as test data . all 11 All the predictive variables were included in the analysis . We use the linear method 、 Nonlinear methods 、 Tree method and support vector machine to predict the classification of wine quality . For linear methods , We train ( punishment ) Logistic regression model and linear discriminant analysis (LDA). The assumptions of logistic regression include independent observations and the linear relationship between independent variables and logarithmic probability .LDA and QDA Suppose it has the characteristics of normal distribution , That is to say, the predictive variable is for “ good ” and “ Bad ” The quality of wine is normally distributed . For nonlinear models , We develop a generalized additive model (GAM)、 Multiple adaptive regression splines (MARS)、KNN Model and quadratic discriminant analysis (QDA). For the tree model , We carried out classification tree and random forest model . We also implemented the... With linear and radial kernels SVM. We calculated the model selection ROC And accuracy , The importance of variables is investigated .10 Crossover verification (CV) For all models .
inTrai <- cateatPariti(y  winequal, p = 0.7, lit =FASE)
traiData <- wine[inexTr,
teDt <wi[-idxTrain,]
Linear model Multiple logistic regression shows , stay 11 Of the predictors , Volatile acidity 、 Citric acid 、 Free sulfur dioxide 、 Total sulfur dioxide 、 Sulfate and alcohol are significantly related to wine quality (P value < 0.05), Explain the total variance 25.1%. Liquor quality . When applying this model to test data , Accuracy is 0.75(95%CI:0.71-0.79),ROC by 0.818, It shows that the data fit well . When performing punitive logistic regression , We found that maximization ROC when , The optimal tuning parameters are alpha=1 and lambda=0.00086, Accuracy is 0.75(95%CI:0.71-0.79),ROC Also for the 0.818. because lambda Close to zero and ROC Same as logistic regression model , So the punishment is relatively small ,
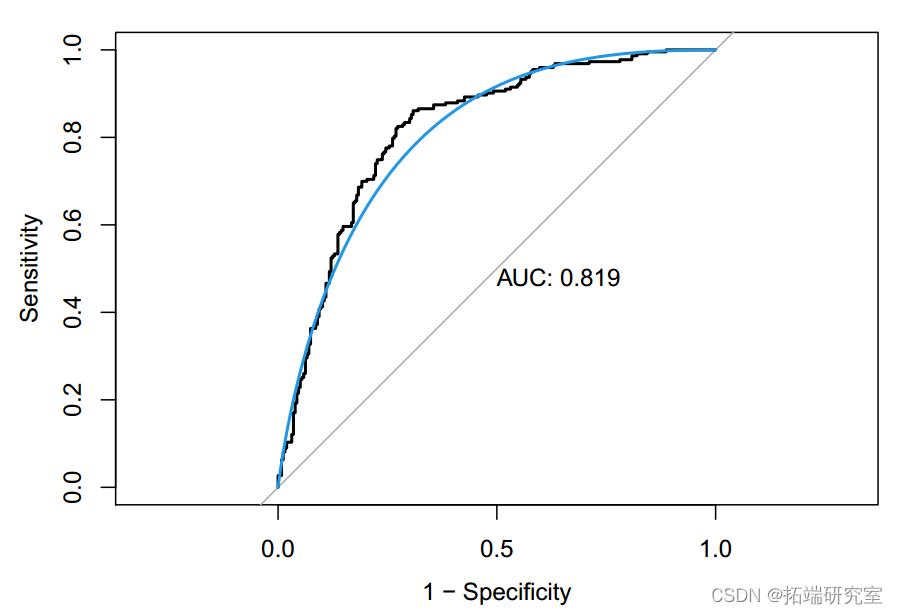
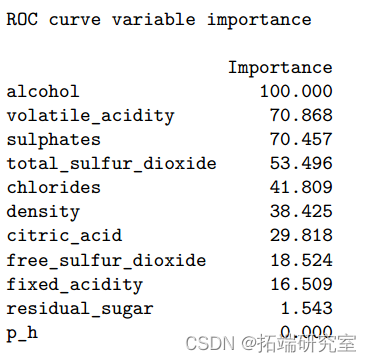
however , Because logistic regression requires little or no multicollinearity between independent variables , Therefore, the model may be subject to 11 Collinearity between the predicted variables ( If any ) Interference of . as for LDA, When applying models to test data ,ROC by 0.819, Accuracy rate is 0.762(95%CI:0.72-0.80). The most important variable to predict wine quality is alcohol content 、 Volatile acidity and sulfate . Compared with logistic regression model ,LDA Under the condition that normal assumptions are satisfied , It is more helpful when the sample size is small or the category separation is good .
###  Logical regression
cl - tranControlmehod =cv" number  10,
summayFunio = TRUE)
set.seed(1)
moel.gl<- train(x = tainDaa %>% dpyr::selct(-ual),
y = trainDaa$qual
metod "glm",
metic = OC",
tContrl = crl
#  Check the importance of predictors
summary(odel.m)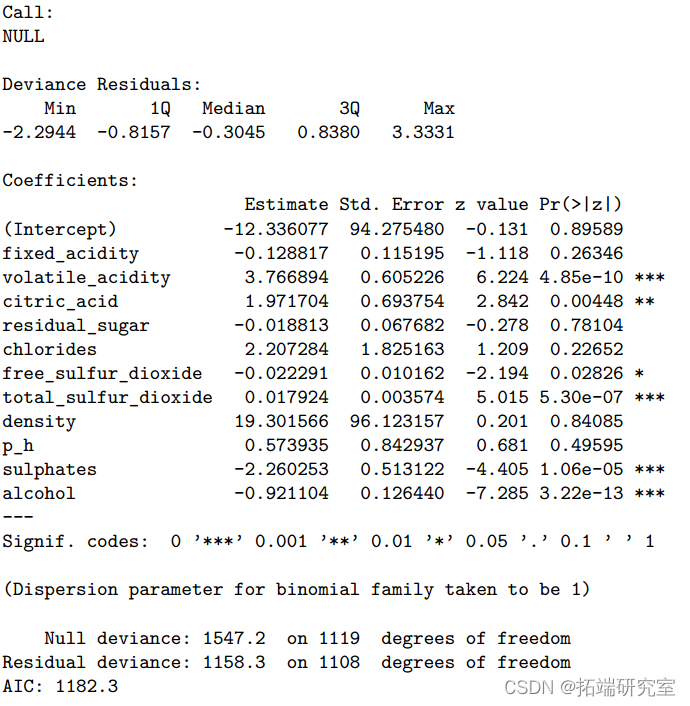
#  Building confusion matrix
tetred.prb <- rdct(mod.gl, newdat = tstDat
tye = "rob
test.ped <- rep("good", length(pred.pr
confusionMatrix(data = as.factor(test.pred),


#  Draw test ROC chart
oc.l <- roc(testa$al, es.pr.rob$god)
##  Test error and training error
er.st. <- mean(tett$qul!= tt.pred)
tranped.obgl <-pric(moel.lmnewda= taiDaa,
type = "rob
moe.ln <-tai(xtraDa %>% dlyr:seec-qal),
y = traD
methd = "met",
tueGid = lGrid,
mtc = "RO",
trontrol  ctl)
plotodel.gl, xTras =uction() lg(x)
# Choose the best parameters
mol.mn$bestune 
#  Confusion matrix

tes.red2 <- rp"good" ngth(test.ed.prob2$good))
tst.red2[tespre.prob2$good < 0.5] <- "poor
conuionMatridata = as.fcto(test.prd2),


Nonlinear models stay GAM In the model , Only the degree of freedom of volatile acidity is equal to 1, Indicates a linear correlation , And for all the others 10 Apply smoothing splines to variables .
It turns out that , alcohol 、 Citric acid 、 Residual sugar 、 Sulfates 、 Fixed acidity 、 Volatile acidity 、 Chloride and total sulfur dioxide are significant predictors (P value <0.05).
in general , These variables explain the overall change in wine quality 39.1%. Use the confusion matrix of the test data to show ,GAM The accuracy is 0.76(95%CI:0.72-0.80),ROC by 0.829.
MARS The model shows that , To maximize ROC when , We are 11 The predicted variables include 5 The item , among nprune be equal to 5, The degree is 2. These predictors and the hinge function together explain the total variance 32.2%. according to MARS Output , The three most important predictors are total sulfur dioxide 、 Alcohol and sulfate .
take MARS When models are applied to test data , Accuracy is 0.75(95%CI:0.72,0.80),ROC by 0.823. We also implemented KNN Model classification . When k be equal to 22 when ,ROC Maximize .KNNmodel The accuracy is 0.63(95%CI:0.59-0.68),ROC by 0.672.
QDA The model shows ROC by 0.784, Accuracy rate is 0.71(95%CI:0.66-0.75). The most important variable to predict wine quality is alcohol 、 Volatile acidity and sulfate .59-0.68),ROC by 0.672.QDA The model shows ROC by 0.784, Accuracy rate is 0.71(95%CI:0.66-0.75).
The most important variable to predict wine quality is alcohol 、 Volatile acidity and sulfate .59-0.68),ROC by 0.672.QDA The model shows ROC by 0.784, Accuracy rate is 0.71(95%CI:0.66-0.75). The most important variable to predict wine quality is alcohol 、 Volatile acidity and sulfate .
GAM and MARS The advantage is that both models are nonparametric , And can handle highly complex nonlinear relations . say concretely ,MARS Models can include potential interactions in the model . However , Because of the complexity of the model 、 Time consuming calculation and high over fitting tendency are the limitations of these two models . about KNN Model , When k When a large , Predictions may not be accurate .
### GAM
se.see(1)
md.gam<- ran(x =trainDta %%dplr::slect(-qal),
y = traiat$ual,
thod = "am",
metri = "RO",
trCotrol = ctrl)
moel.gm$finlMdel
summary(mel.gam)

#  Building confusion matrix
test.pr.pob3 - prdict(mod.ga nwdata =tstData,
tye = "prb")
testped3 - rep"good" legt(test.predpob3$goo))
testprd3[test.predprob3good < 0.5] <- "poo
referetv = "good")


model.mars$finalModel
vpmodl.rs$inlodel)


#  Draw test ROC chart
ocmas <- roctestataqua, tes.pred.rob4god)
## Stting level: conrol = god, case= poor
## Settig diectio: cntrols> case
plot(ro.mars legac.axes = TRE, prin.auc= RUE)
plot(soothroc.mars), co = 4, ad =TRUE) 
errr.tria.mas <-man(tainat$qul ! trai.red.ars)
### KNN
Grid < epa.gri(k seq(from = 1, to = 40, by = 1))
seted(1
fknnrainqual ~.,
dta = trnData,
mthd ="knn"
metrrid = kid)
ggplot(fitkn 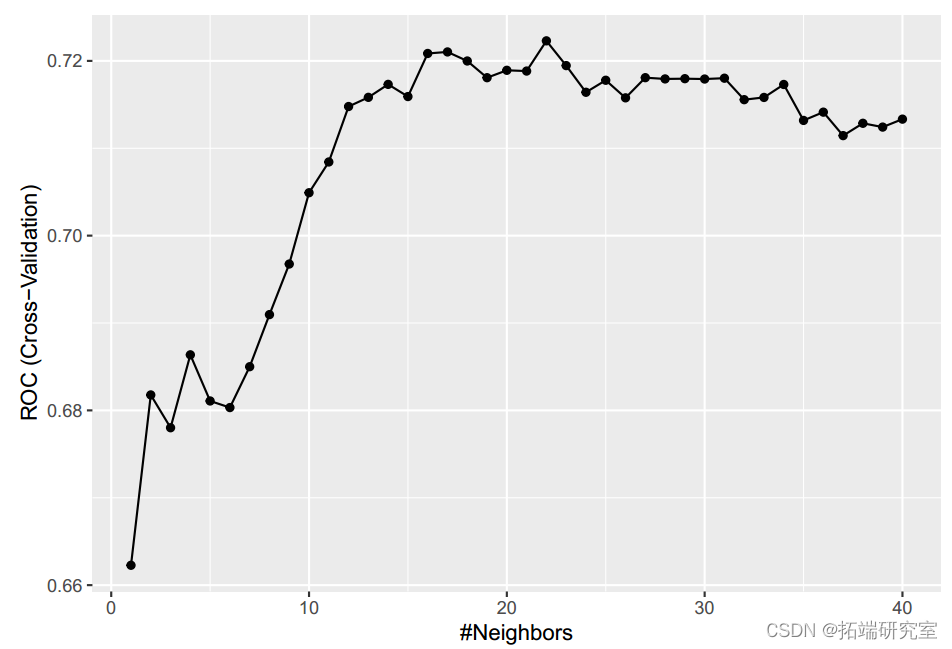

#  Building confusion matrix
ts.re.po7 < prdi(ft.kn, ewdt = estDaa
type = "prb" 

### QDA
seteed1)%>% pyr:c-ual),
y= trataq
ethod "d"
mric = "OC",
tContol =ctl)
#  Building confusion matrix
tet.pprob <-pedct(mol.da,nedaa = teDta,
te = "pb")
testred6<- rep(o", leng(est.ped.pob6$goo))


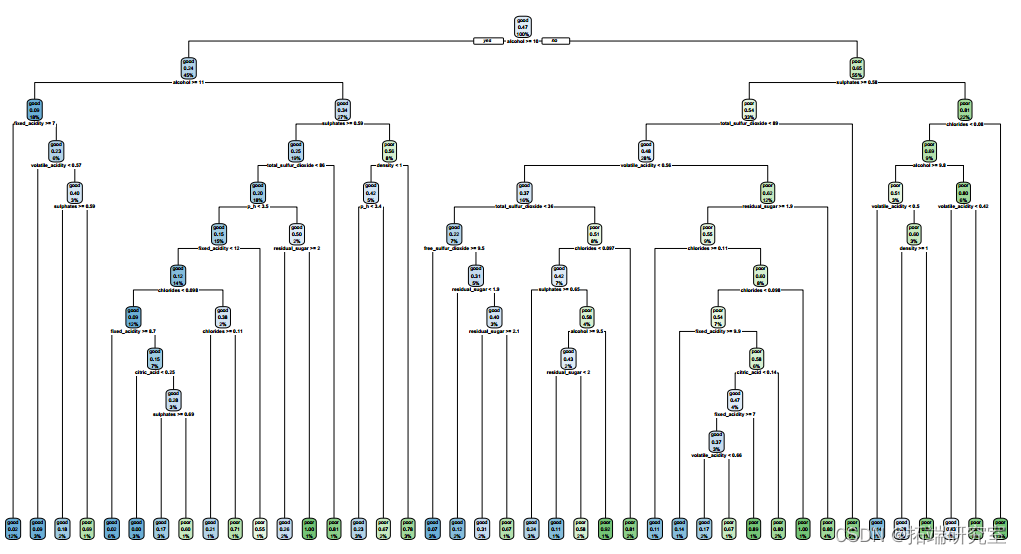
Tree method
Based on the classification tree , Maximize AUC The final tree size is 41. The test error rate is 0.24,ROC by 0.809. The accuracy of this classification tree is 0.76(95%CI:0.72-0.80). We also carried out a random forest method to study the importance of variables . therefore , Alcohol is the most important variable , The second is sulfate 、 Volatile acidity 、 Total sulfur dioxide 、 density 、 Chloride 、 Fixed acidity 、 Citric acid 、 Free sulfur dioxide and residual sugar .pH Is the least important variable . For a random forest model , The test error rate is 0.163, Accuracy rate is 0.84(95%CI:0.80-0.87),ROC by 0.900. One potential limitation of tree methods is that they are sensitive to changes in data , That is, a small change in the data may cause a large change in the classification tree .
#  classification
ctr <- tintol(meod ="cv", number = 10,
smmryFuton= twoClassSma
et.se(1
rart_grid = a.fra(cp = exp(eq(10,-, len =0)))
clsste = traqua~., rainDta,
metho ="rprt
tueGrid = patid,
trCtrl  cr)
ggt(class.tee,highight =TRE)
##  Calculate the test error
rpartpred = icla.te edta =testata, ye = "aw)
te.ero.sree = mean(testa$a !=rartpre)
rprred_trin  reic(ss.tre,newdta = raiata, tye  "raw")

#  Building confusion matrix
teste.pob8 <-rdic(cste, edata =tstData,pe = "po"
tet.pd8 - rpgod" legthtetred.rb8d))


#  Draw test ROC chart
ro.r <-oc(testaual, tstedrob$od)
pot(rc.ctreegy.axes  TU pit.a = TRE)
plo(ooth(c.tre, col= 4, ad = TRE 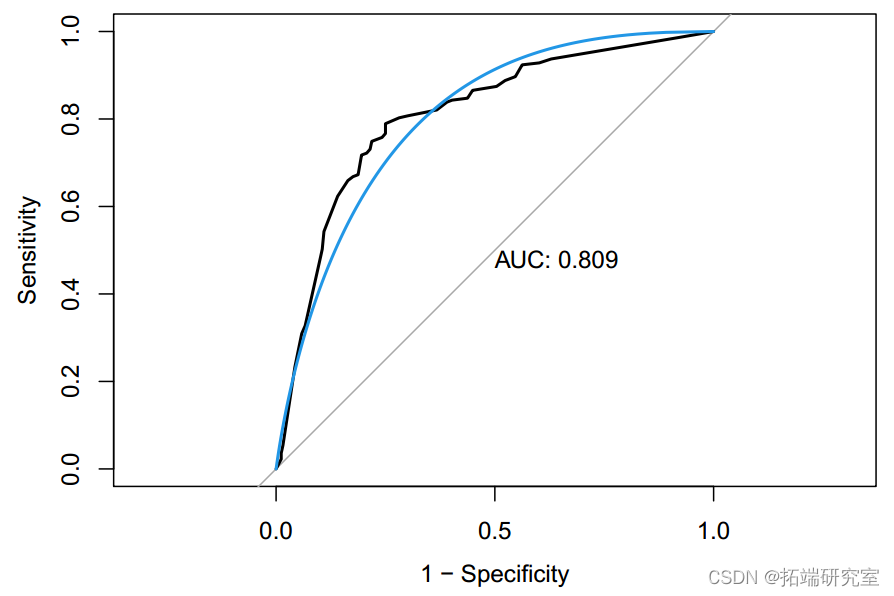
#  Random forests and variable importance
ctl <traontr(mthod= "cv, numbr = 10,
clasPos = RUEoClssSummry)
rf.grid - xpa.gr(mt = 1:10,
spltrule "gini"
min.nd.sie =seq(from = 1,to  12, by = 2))
se.sed(1)
rf.fit <- inqual
mthd= "ranger",
meric = "ROC",
 = ctrl
gglt(rf.it,hiliht  TRE)
scle.ermutatin.iportace  TRU)
barplt(sort(rangr::imoranc(random 


Support vector machine
We use with a linear kernel SVM, And adjust the cost function . We find that it has maximization ROChad Cost model = 0.59078. Of the model ROC by 0.816, Accuracy is 0.75( The test error is 0.25)(95%CI:0.71-0.79). The most important variable for quality prediction is alcohol ; Volatile acidity and total sulfur dioxide are also important variables . If the real boundary is nonlinear , With radial nuclei SVM Better performance .
st.seed(
svl.fi <- tain(qual~ . ,
data = trainData
mehod= "mLar2",
tueGri = data.frae(cos = ep(seq(-25,ln = 0))


##  With radial nuclei SVM
svmr.grid  epand.gid(C = epseq(1,4,le=10)),
iga = expsq(8,len=10)))
svmr.it<- tan(qual ~ .,
da = taiDataRialSigma",
preProcess= c("cer" "scale"),
tunnrol = c)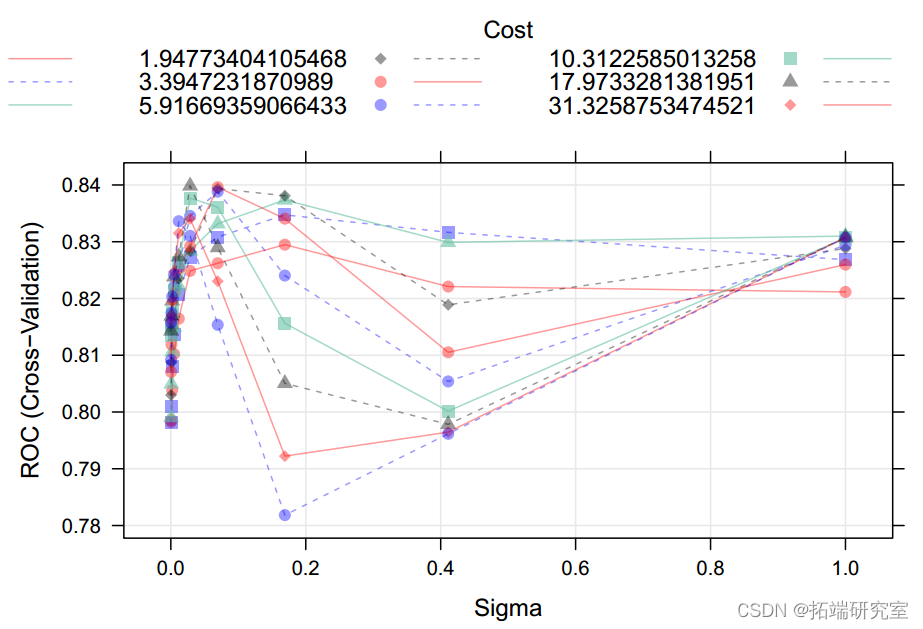


Model comparison
After model establishment , We compare all models according to their training and testing performance . The following table shows the cross validation classification error rates and for all models ROC. In the end , Random forest model AUC Value is the largest , and KNN Minimum . therefore , We choose the random forest model as the best predictive classification model for our data . Based on Stochastic Forest model , alcohol 、 Sulfates 、 Volatile acidity 、 Total sulfur dioxide and density are the leading factors to help us predict wine quality classification 5 Important predictors . Because of alcohol 、 Factors such as sulfate and volatile acidity may determine the flavor and taste of wine , So this discovery is in line with our expectations . When viewing the summary of each model , We realize that KNN Model AUC Lowest value , The test classification error rate is the highest , by 0.367. Of the other nine models AUC It's close to , about 82%.
rsam = rsmes(list(

summary(resamp)


comrin = sumaryes)$satitics$RO
r_quare  smary(rsamp)saisis$sqre
kntr::ableomris[,1:6]) 
bpot(remp meic = "ROC") 
f<- datafram(dl_Name, TainError,Test_Eror, Tes_RC)
knir::abe(df)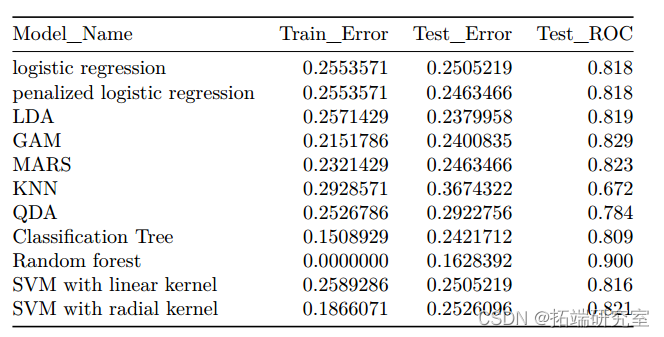
Conclusion
The model building process shows that , In the training dataset , alcohol 、 Sulfates 、 Volatile acidity 、 Total sulfur dioxide and density are the leading factors in wine quality classification 5 Important predictors . We chose the random forest model , Because of its AUC Value is the largest , The classification error rate is the lowest . The model also performs well in the test data set . therefore , This random forest model is an effective method for wine quality classification .

The most popular insights
1.R Language diversity Logistic Logical regression The application case
2. Panel smooth transfer regression (PSTR) Analyze the case and realize
3.matlab Partial least squares regression in (PLSR) And principal component regression (PCR)
4.R Language Poisson Poisson Regression model analysis case
5.R The return of language Hosmer-Lemeshow Goodness of fit test
6.r In language LASSO Return to ,Ridge Ridge return and Elastic Net Model implementation
7. stay R In language Logistic Logical regression
8.python Using linear regression to predict stock prices
9.R How to analyze the existence of language and Cox Calculate in regression IDI,NRI indicators
边栏推荐
- 新手炒股开户选哪家证券平台办理是最好最安全的
- 将PCAP转换为Json文件的神器:joy(安装篇)
- Mixed programming of C language and assembly language in stm32
- 分布式事务—基于消息补偿的最终一致性方案(本地消息表、消息队列)
- Usage details of staticlayout
- 在线文本按行批量反转工具
- 无心剑汉英双语诗004.《剑》
- Packet capturing and sorting out external Fiddler -- understanding the toolbar [1]
- Domain Name System
- JDBC and MySQL databases
猜你喜欢
![[today in history] June 25: the father of notebook was born; Windows 98 release; First commercial use of generic product code](/img/ef/a26127284fe57ac049a4313d89cf97.png)
[today in history] June 25: the father of notebook was born; Windows 98 release; First commercial use of generic product code
![Packet capturing and sorting out external Fiddler -- understanding the toolbar [1]](/img/5f/24fd110a73734ba1638f0aad63c787.png)
Packet capturing and sorting out external Fiddler -- understanding the toolbar [1]

Writing C program with GCC and makefile for the first time

3年功能测试拿8K,被刚来的测试员反超,其实你在假装努力
抓包整理外篇fiddler————了解工具栏[一]

论文阅读:Generative Adversarial Transformers
![[today in history] June 5: Lovelace and Babbage met; The pioneer of public key cryptography was born; Functional language design pioneer born](/img/af/1faf1df4262940e73104ed2880f08d.png)
[today in history] June 5: Lovelace and Babbage met; The pioneer of public key cryptography was born; Functional language design pioneer born
![[today in history] June 17: the creator of the term](/img/00/30ccc2f54415a6aca000c42e277dc3.png)
[today in history] June 17: the creator of the term "hypertext" was born; The birth of Novell's chief scientist; Discovery channel on

Severe Tire Damage:世界上第一个在互联网上直播的摇滚乐队
![[block coding] simulation of image block coding based on MATLAB](/img/d9/a9c45faf40663865893cd58e7e7431.png)
[block coding] simulation of image block coding based on MATLAB
随机推荐
Win11无法使用动态壁纸怎么办?Win11用不了动态壁纸的解决方法
【插件-statistic】统计代码行数和相关数据
RichView TRVStyle ParaStyles
分布式事务—基于消息补偿的最终一致性方案(本地消息表、消息队列)
[today in history] May 31: the father of Amiga was born; The co developer of basic language was born; BlackBerry BBM shutdown
无心剑英汉双语诗004.《静心》
音视频技术开发周刊 | 251
在线JSON转PlainText工具
将PCAP转换为Json文件的神器:joy(安装篇)
Flask Foundation: template inheritance + static file configuration
字节跳动面试官:一张图片占据的内存大小是如何计算
[elevator control system] design of elevator control system based on VHDL language and state machine, using state machine
Get 5 offers after being notified of layoffs
The graduation season is coming, and the number of college graduates in 2022 has exceeded 10 million for the first time
[today in history] June 19: iPhone 3GS launched; Pascal was born; Anti terrorist elite begins testing
[today in history] June 13: parent-child disputes in packet switched networks; The founder of game theory was born; The embryonic form of interactive television
【522. 最长特殊序列 II】
What if win11 cannot use dynamic wallpaper? Solution of win11 without dynamic wallpaper
在线文本按行批量反转工具
Usage details of staticlayout