One 、Node What debugging tools are available
We know that the client script can be debugged in the browser , that nodejs How to debug ?
This is mainly about 2 Debug methods , I hope it can help you :
    1、Chrome Browser debugging nodejs

    2、VSCode debugging nodejs
Two 、Chrome Browser debugging nodejs(ChromeDevTools 55+ Support )
1、 Run script
    1)、web Service application :
            node –inspect app.js   perhaps   node –inspect-brk app.js
    2)、 Not web Service application :
            node --inspect-brk=9229 app.js
            PS:-brk Specify the first line to set the breakpoint , From the beginning, it was a state of pause , =9229 Specify the debug port as  9229, This is the default communication port of the debugging tool
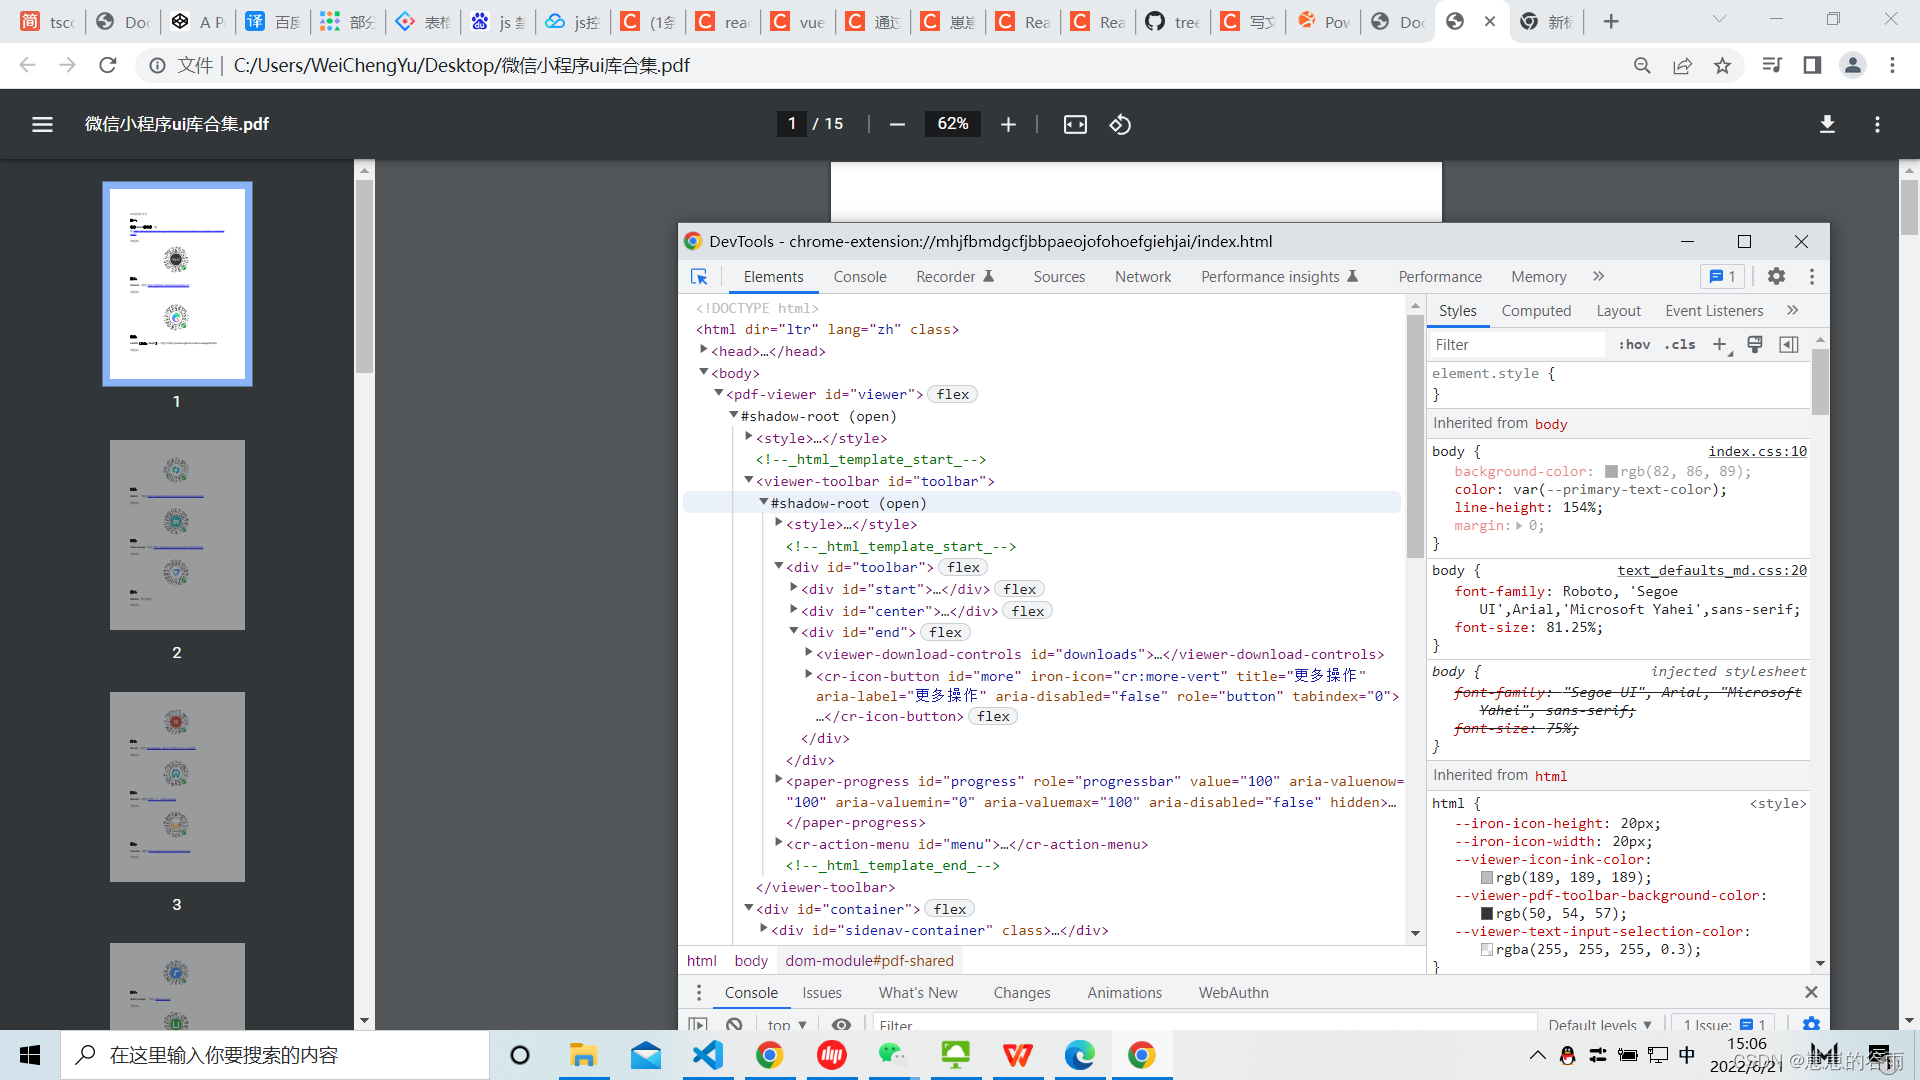
2、chrome Open... In browser :chrome://inspect/#devices, The following page will be displayed (Target It will take a while to appear ).

3、 Click... In the red box above inspect Button , You can enter the program debugging world
The debugging tool mainly has four panels :Console: Console 、Sources: Source code 、Memory: Memory 、Profiler: performance .
The main speak Sources panel , When debugging, the panel can be seen from left to right CallStack、Breakpoints、Scope、Watch Equal fold item .Scope double-click Local The variable value of can enter the editing state .
4、 except chrome://inspect/#devices outside , Input http://127.0.0.1:9292 Then open the developer tool , Click on node Icon , You can also enter the debugger .
5、 Forget to write –inspect What do I do ?(Linux System )
The prerequisite for opening the debugging tool is , start-up Node Add... To the script --inspect Parameters . If you forget this parameter , Can you debug it ?
The answer is yes . First , Normal startup script .
1)、 Normal startup script :node app.js
2)、 In another command line window , Find the process number of the above script .
           $ ps ax | grep app.js
           30464 pts/11   Sl+    0:00 node app.js
           30541 pts/12   S+     0:00 grep app.js
3)、 In the above command ,app.js The process number of is 30464. Then run the following command :
node -e'process._debugProcess(30464)'4)、 The above command will set up the process 30464 Connection with debugging tools , Then you can open the debugging tool .
5)、 There's another way , Is to send to the script process SIGUSR1 The signal , You can also establish a debug connection .(windows Not available on )
$ kill -SIGUSR1 30464
6、 How to enable remote debugging scheme
If you need to debug production code remotely , It is recommended that the debugger not listen to public IP Address , It is recommended to use ssh Tunnel to debug . How to enable remote debugging scheme :
1)、 Start the process on the remote machine :node –inspect app.js
2)、 On the local computer where you want to start debugging client connections , You can set ssh Tunnel :
ssh -L 9221:localhost:9229 [email protected]
3、 ... and 、vscode debugging nodejs(v1.10+ To support )
1、 Create a new project in the root directory .vscode Folder , At the same time, a new folder is created under this folder launch.jso file :
2、 You need to pay attention to :
    1)、 It needs to be under the project root directory , Otherwise, when you click start debugging, you will not recognize the debugging task in the project
    2)、program Startup program configuration item ,${workspaceFolder} Under the current work panel , Note that it is better to change the project directly in the root directory vscode Work panel as a project , Instead of a subproject nested under a project .
    3)、${workspaceFolder}/app.js in app.js Is the startup file for this project . If this file is not configured correctly , The debugging toolbar will disappear after it is successfully started , For example, when testing an interface, you can't debug it by calling it .
    4)、 After successful configuration , The debug status bar will always be fixed in vscode The top of the interface , Even if there is no access for interface debugging , Will always be .
5)、 Note that in the debug mode, you need to formally start the backend cmd close , Otherwise, a port has been started , Port conflict .
3、 Start the debugging tool correctly , Pictured :
4、 Add breakpoints to the code , adopt postman When accessing the interface, it will enter the breakpoint , Then you can debug the code .
key word : Front end training