当前位置:网站首页>如何进行探索性数据分析
如何进行探索性数据分析
2022-06-23 03:55:00 【梦想画家】
一般数据分析项目第一步都需要探索性数据分析。主要包括三个方面:
- 使用描述性统计汇总数据
- 使用图标可视化数据
- 识别缺失值
通过上述三个方面分析,可以在执行假设检验或统计模型之前对数据集的分布情况有基本理解,并检测获得问题数据情况。
下面通过示例说明探索性数据分析,并给出Python代码实现。
准备示例数据
首先创建pandas数据框:
import pandas as pd
import numpy as np

#create DataFrame
df = pd.DataFrame({'team': ['A', 'A', 'A', 'A', 'B', 'B', 'B', 'B'],
                   'points': [18, 22, 19, 14, 14, 11, 20, 28],
                   'assists': [5, 7, 7, 9, 12, 9, 9, 4],
                   'rebounds': [11, 8, 10, 6, 6, np.nan, 9, 12]})
通过head()函数查看前五行数据:
df.head()

# 	team	points	assists	rebounds
# 0	A	18	5	11.0
# 1	A	22	7	8.0
# 2	A	19	7	10.0
# 3	A	14	9	6.0
# 4	B	14	12	6.0
查看数据概况
使用describe() 函数可以快速查看每个数值变量的概况:
df.describe()

#       points	    assists 	rebounds
# count	8.0000000	8.00000 	7.000000
# mean	18.250000	7.75000 	8.857143
# std	5.3652320	2.54951 	2.340126
# min	11.000000	4.00000 	6.000000
# 25%	14.000000	6.50000 	7.000000
# 50%	18.500000	8.00000 	9.000000
# 75%	20.500000	9.00000 	10.50000
# max	28.000000	12.0000     12.00000
每个数值变量的信息说明:
count: 非缺失值数量
std: 均值
min: T最小值
25%: 第一四分位值 (前25%)
50%: 中位数 (前50%)
75%: 第三四分位值 (前75%)
max: 最大值
对于类别变量,可以使用value_counts获得每个值的频数:
df['team'].value_counts()

# A    4
# B    4
# Name: team, dtype: int64
通过输出可以看到:
A: 共出现4次.
B: 共出现4次.
通过shape属性可以获得数据框的维度:即行数和列数:
df.shape

# (8, 4)
数据可视化
下面通过可视化方式了解数据集。举例,pandas的hist()函数创建每个数值变量的直方图:
每个直方图的x轴现实每个值,y轴现实值的频数。
import matplotlib.pyplot as plt

df.hist(grid=False, edgecolor='black')
plt.show()

我们还可以使用pandas的boxplot()函数创建箱线图:
# 创建每个变量的箱线图

df.boxplot(grid=False)
上面代码在一张图上展示多个变量的箱线图。但有时因单位不同,需要单独对每个变量画箱线图:
df['points'].plot(kind='box')

# 或下面语法

df.boxplot(column='points', grid=False)

也可以使用pandas的corr函数创建协方差矩阵:
df.corr()

#          points	  assists	 rebounds
# points	1.000000	-0.725841	 0.767007
# assists	-0.725841	 1.000000	-0.882046
# rebounds  0.767007	-0.882046	 1.000000
识别缺失值
下面代码统计所有缺失值:
df.isnull().sum()

# team        0
# points      0
# assists     0
# rebounds    1
# dtype: int64
输出显示仅rebounds变量一个缺失值,其他列没有缺失值。
总结
经过上面步骤,我们基本已经完成了该数据集的基本探索性数据分析,并且较好地理解了数据集中每个变量值的如何分布情况。
边栏推荐
猜你喜欢

servlet自学笔记

Arduino temperature and humidity sensor DHT11 (including code)
![Direct insertion sort - [common sort method (1/8)]](/img/c3/f08d789c9ff32dda4f20c58e7c114d.png)
Direct insertion sort - [common sort method (1/8)]

2022-06-22:golang选择题,以下golang代码输出什么?A:3;B:1;C:4;D:编译失败。 package main import ( “fmt“ ) func mai
Introduction to s file generated by TEQC for GNSS data quality analysis

Baidu PaddlePaddle's "universal gravitation" first stop in 2022 landed in Suzhou, comprehensively launching the SME empowerment plan
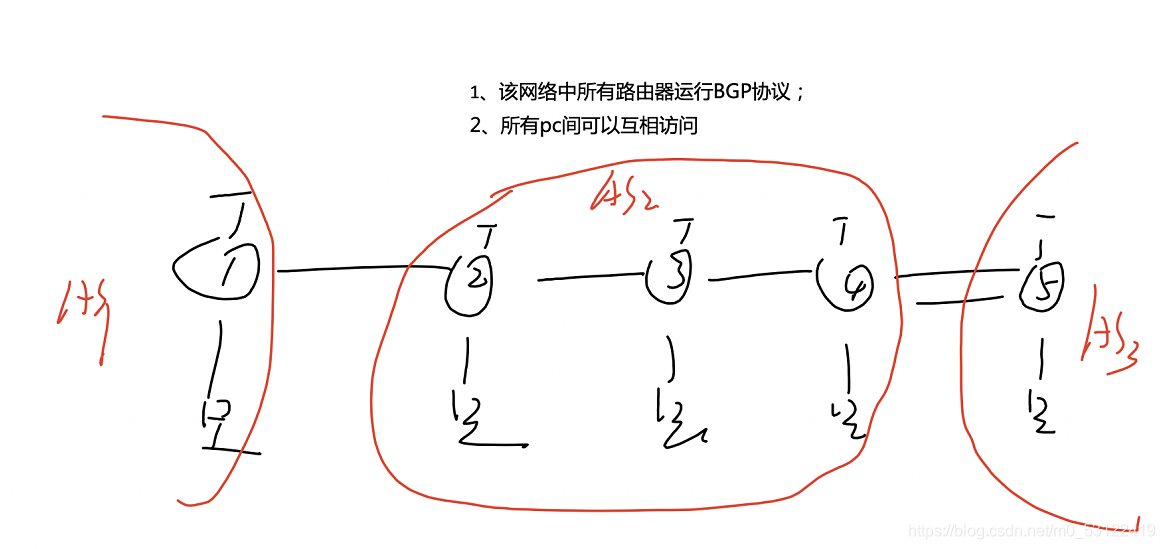
BGP experiment
teqc进行GNSS数据质量分析时生成的s文件介绍

MVC三層架構

3 天完成小学期项目,手把手教你完成天气播报系统!
随机推荐
Object structure diagram, which can quickly illustrate the internal structure of an object
Cookie-Session讲解
One or more lines of text overflow, ellipsis instead
SwiftUI 2.0 课程笔记 Chapter 4
104. 简易聊天室7:使用 Socket 传递对象
Brief ideas and simple cases of JVM tuning - why do you need JVM tuning?
How can functional testers spend one month to become advanced automation software test engineers
"Wechat applet - Basics" takes you to understand the routing system of the applet (2)
laravel8实现图片验证码
笔者认为所谓的产业互联网,就是一个产业与互联网深度融合的过程
微信小程序:全新趣味测试
百度飞桨“万有引力”2022首站落地苏州,全面启动中小企业赋能计划
【微服务|Nacos】Nacos版本相关问题一览
Hcip fifth operation
大环境不好难找工作?三面阿里,幸好做足了准备,已拿offer
The technological advance of new employees? Journey
Getting started with the shutter AppBar
Beyond chips and AI, why is hard technology capital becoming more and more "hard core"?
rtklib2.4.3 b34 单点定位的一个bug
微信小程序:老年祝福短视频