当前位置:网站首页>Matlab drawing 1
Matlab drawing 1
2022-08-04 18:00:00 【Thousands of old bamboo】
Draw multiple function images at the same time
figure,plot(x1,y1);
figure,plot(x2,y2);
eg
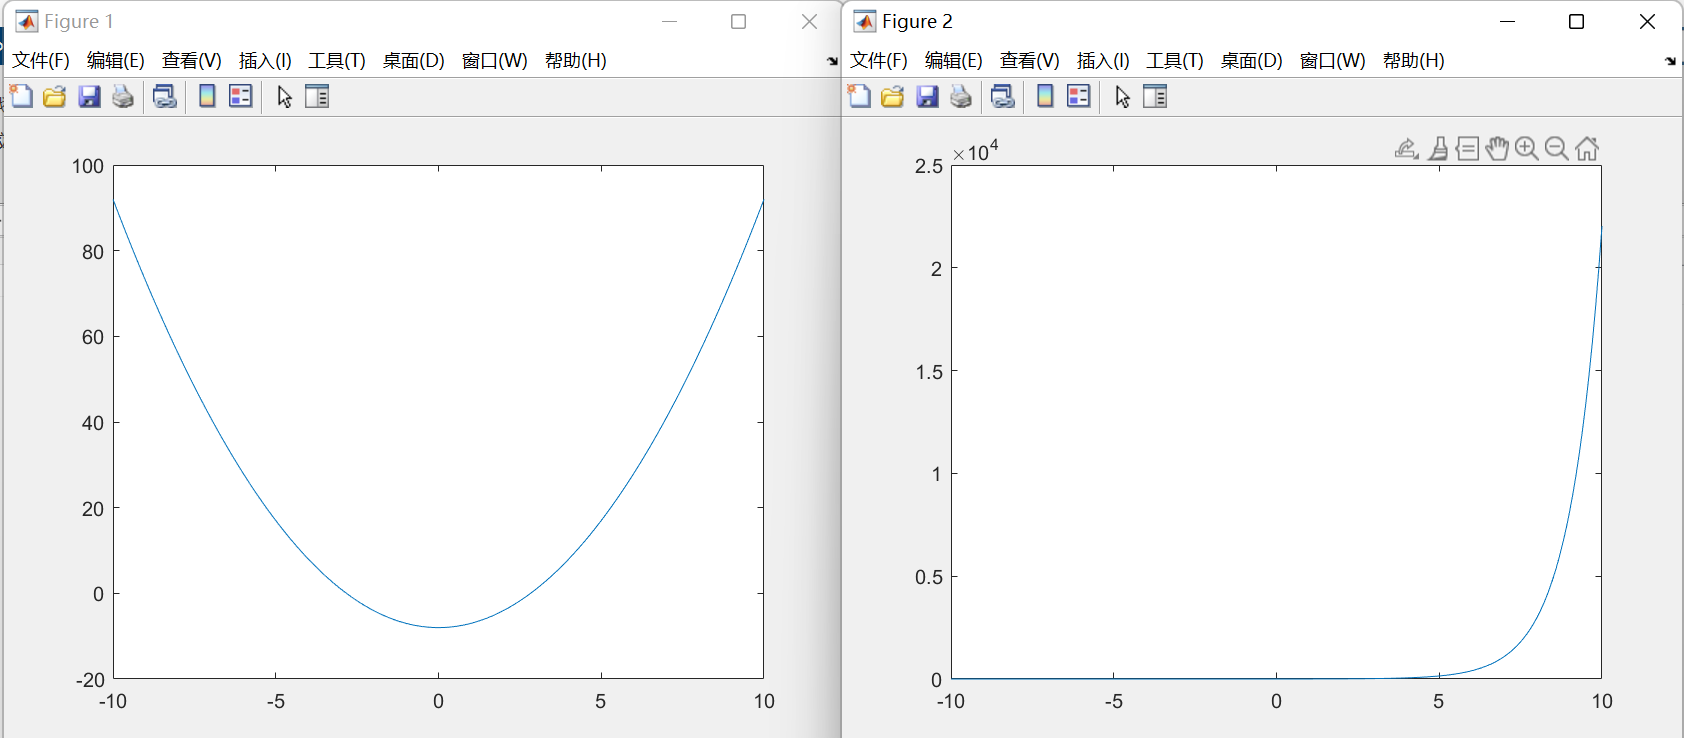
x=-10:0.1:10;
y1=x.^2-8;
y2=exp(x);
figure,plot(x,y1);
figure,plot(x,y2);
//此时gcf与gca表示的是figure的句柄值
效果如下:
Put multiple function images in one window
subplot(m,n,num);//m是行数,n是列数,numis the first picture
eg:
t=0:0.1:2*pi;x=3*cos(t);
y1=sin(t);y2=2*sin(t);y3=3*sin(t);y4=4*sin(t);
subplot(2,3,1);plot(x,y1);
subplot(2,3,2);plot(x,y2);
subplot(2,3,3);plot(x,y3);
subplot(2,3,4);plot(x,y4);
效果如下 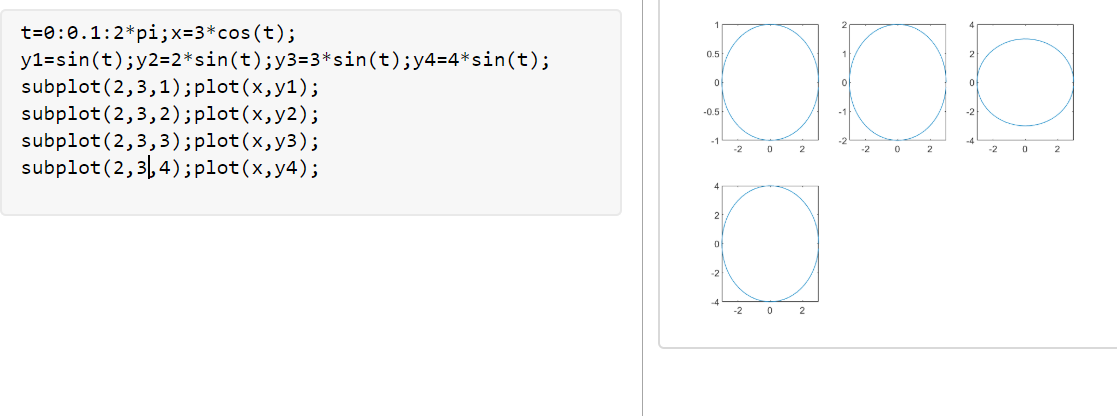
保存图像
saveas(gcf,'<filename>','<formattype>');
位图格式 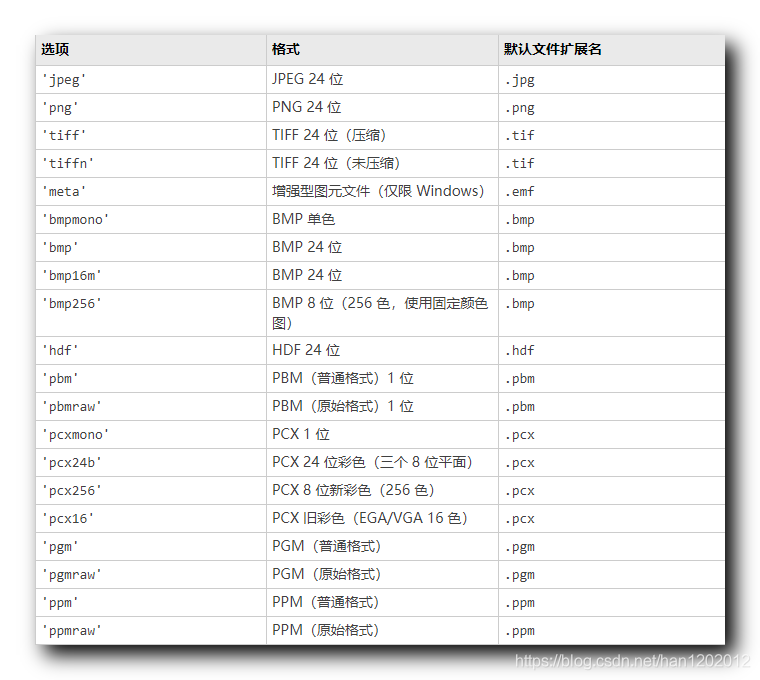 矢量图格式
矢量图格式 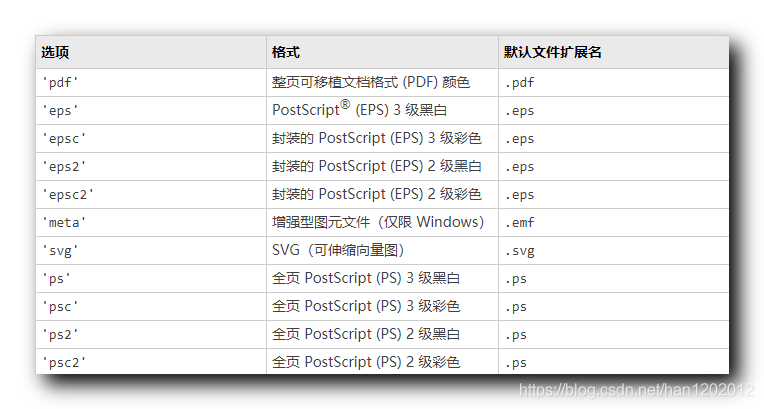
边栏推荐
猜你喜欢


随机推荐
R语言dplyr包group_by函数和summarise_at函数计算dataframe计算不同分组的计数个数和均值、使用%>%符号将多个函数串起来
[Web Automation Test] Quick Start with Playwright, 5 minutes to get started
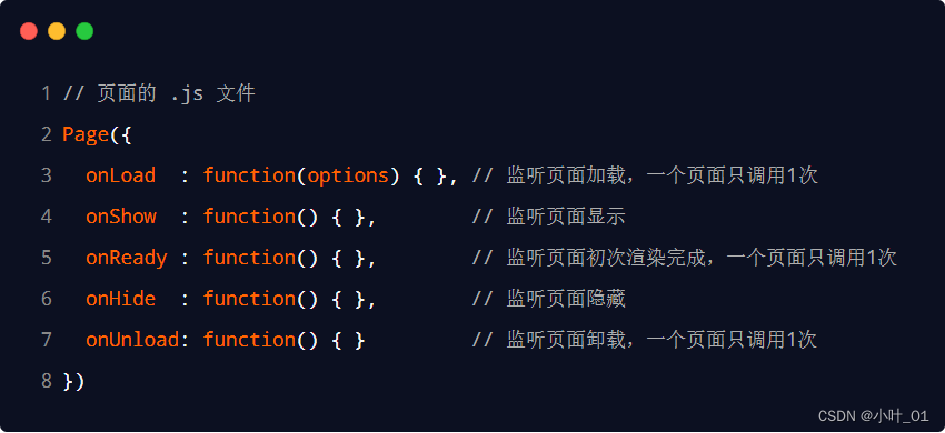
小程序笔记2
数据集成:holo数据同步至redis。redis必须是集群模式?
R语言使用ggpubr包的ggsummarystats函数可视化柱状图(通过ggfunc参数设置)、在可视化图像的下方添加描述性统计结果表格、palette参数配置柱状图及统计数据的颜色
离散化求前缀和
企业调查相关性分析案例
字节二面被问到mysql事务与锁问题,我蚌埠住了
【注册荣耀开发者】赢【荣耀70】手机
Boosting之GBDT原理
R语言glm函数使用频数数据构建二分类logistic回归模型,分析的输入数据为频数数据(多个分类指标对应的阴性样本和阳性样本的频数数据)、weights参数指定频数值
又一款高颜值 Redis 官方可视化工具,功能真心强大!
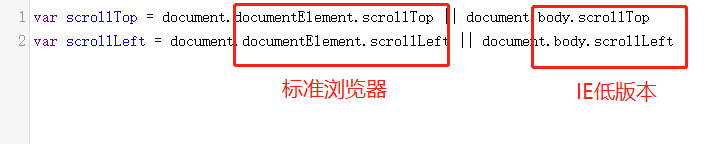
localhost,127.0.0.1,本机IP
JS中null与undefined的异同点
信息系统项目管理师必背核心考点(六十)项目集管理
怎么面试程序员的?傲慢与无礼,就数他牛逼
flink-cdc支持并行读取一张mysql表的binlog不?
使用bash语句,清空aaa文件夹下的所有文件
群友求助,一周没有搞定的需求,3分钟就解决了?
Documentary on Security Reinforcement of Network Range Monitoring System (1)—SSL/TLS Encrypted Transmission of Log Data