当前位置:网站首页>Drawing grid navigation by opencv map reading
Drawing grid navigation by opencv map reading
2022-06-12 06:39:00 【A building climbing pig】
utilize OpenCV Read and draw grid navigation
Realization effect
Get a map .jpg As shown in the figure , The final effect is MATLAB Draw a grid map in 
utilize PC Image preprocessing with the drawing tool
for example : Acquired pictures test.jpg The pixel size displayed in the drawing software is 412162, Import to MATLAB The number of grids is also 412162 It's not reasonable , So resize the picture in the drawing software , Make a pixel correspond to a grid point , Here it is scaled to a size of 40*15 A grid matrix .

utilize OpenCV Recognize the image and get the obstacle information
OpenCV Procedure steps for identifying obstacle information :
1、 Image Reading
2、 Replace the picture with a binary diagram
3、 Get pixel information ( What we get here is the index value )
4、 Store data .txt File is used to MATLAB Read
OpenCV Specific procedures for reading drawings , It is worth noting that , The test image itself has two colors , Black and white , If additional information needs to be identified , utilize OpenCV Threshold processing of , To generate the binary graph you need .
import cv2

#  Read the picture
img = cv2.imread('test.jpg')

#  Binary image processing
img_gray = cv2.cvtColor(img,cv2.COLOR_BGR2GRAY)
ret,img_bin = cv2.threshold(img_gray, 127, 255, cv2.THRESH_BINARY)

#  Check whether the processed image meets the requirements
cv2.imshow("img_bin", img_bin)
cv2.waitKey(0)
cv2.destroyAllWindows()

'''
 Capture pixels of the image , among 0 It means black ,255 It means white
row and col Represents the rows and columns of the image , Pixels [row,col] The value of the pixel corresponding to its position
image_line  Store linear value pictures ,1 It means an obstacle ,0 Indicates a free zone
image_index Store the index value of picture pixels , Reference resources MATLAB Of ind2sub Function interpretation
'''

#  Get the pixel row and column height of the picture
row,col = img_bin.shape

#  Define data types
image_line = []
index = 0
image_index = []


#  Circular judgment of pixel information
for c in range(col):
    for r in range(row):
        index = index + 1
        if img_bin[r,c] == 0:
            image_line.append(1)
            image_index.append(index)
        else:
            image_line.append(0)
    image_line.append('^p')

#  Write map data to txt file
file = open('data_map.txt','w')
file.write(str(image_line));
file.close()

#  Write index data to txt file
file = open('data_index.txt','w')
file.write(str(image_index));
file.close()
Image pixels row and col The explanation of
Picture in OpenCV The point relation corresponding to each pixel in the is :
View image data
open data_map.txt Copied to the Word in , In the replacement function , take ’^p’ Replace with ^p Implement line break , Copy data to txt Better viewing effect ;
take data_index.txt The beginning of the data [ And the end ] Symbol deletion
data_map The effect of data :

take index Data import MATLAB Draw grid
Will go to the beginning [ And the end ] Of data_index Data import MATLAB

Follow the procedure below to read index Data path planning , Path planning reference link : 5 MATLAB And grid path planning algorithm (1 Rasterize images and dijkstra Algorithm ).
clc;
clear;
data = load('data.txt');

XRows = 40; YCols = 15;
StartCoord = [3,6];
GoalCoord = [35,2];

[obsx,obsy] = ind2sub([YCols,XRows],data);
ObsCoord = [obsy' obsx'];

[Opt,Field] = Dijkstra_main(XRows,YCols,StartCoord,GoalCoord,ObsCoord);
Achieve the effect of path planning :
Summary of this chapter
1、 Grid map in MATLAB The degree of reproduction depends on the pixels , So it is not necessary to modify the picture size in the drawing software ,OpenCV Get row and col The map can also be reproduced according to the bisection relationship
2、 Picture maps and MATLAB The map of has an inverse relationship , You can consider using the drawing software to reverse the picture vertically before reading the picture
边栏推荐
- 8. form label
- Excel VBA opens a file that begins with the specified character
- Leetcode sword finger offer (Second Edition) complete version of personal questions
- SQL注入——联合查询union
- PHP read / write cookie
- The first day of June training - array
- LeetCode-1490. Clone n-ary tree
- The seventh day of June training - hash table
- SQL 注入-盲注
- Detailed explanation of convirt paper (medical pictures)
猜你喜欢

Video fire detection based on Gaussian mixture model and multi-color
descheduler 二次调度让 Kubernetes 负载更均衡

Process when solving vagrant up_ builder. rb:43:in `join‘: incompatible character encodings: GBK and UTF-8

platform driver
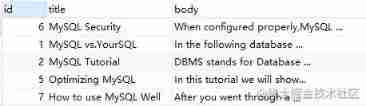
Are you still using like+% for MySQL fuzzy query?

Jetson TX2 machine brushing jetpack4.2 (self test successful version)

leetcode 35. Search insert location

数据库语法相关问题,求解一个正确语法

Throw away the ugly toast. The movable toast is more interesting
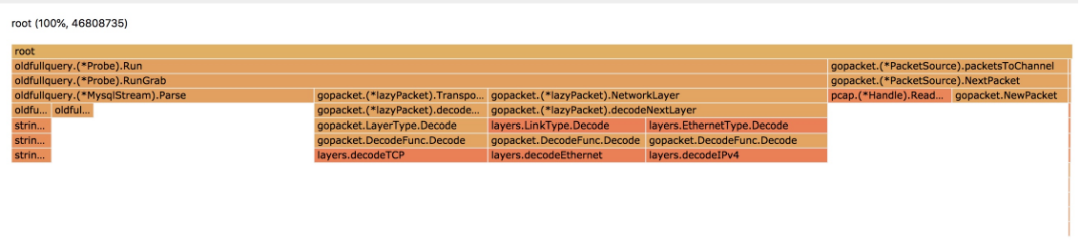
数据库全量SQL分析与审计系统性能优化之旅
随机推荐
GET 和 POST 的区别及留言板代码实现
Redis configuration (IV) -- cluster
8. 表单标签
leetcode:890. Find and replace mode [two dict records set]
上位机开发(固件下载软件之需求分析)
Unreal Engine learning notes
Highlight detection with pairwise deep ranking for first person video summary (thesis translation)
It only takes 10 minutes to understand the underlying principle of NiO
C language pointer
leetcode:剑指 Offer 67. 把字符串转换成整数【模拟 + 分割 +讨论】
Apache poi 导入导出Excel文件
CONDA create use virtual environment
The difference between get and post and the code implementation of message board
Multithreading (4) -- no lock (2) -- Atomic related atomic classes
Process when solving vagrant up_ builder. rb:43:in `join‘: incompatible character encodings: GBK and UTF-8
Tomato learning notes-stm32 SPI introduction and Tim synchronization
LeetCode-1154. Day of the year
LeetCode-1587. Bank account summary II
MySQL multiple SQL batch operations (crud) in JDBC
The vs 2019 community version Microsoft account cannot be logged in and activated offline