当前位置:网站首页>MATLAB中nexttile函数使用
MATLAB中nexttile函数使用
2022-07-02 15:04:00 【jk_101】
目录
nexttile函数的功能是在分块图布局中创建坐标区。
语法
nexttile
nexttile(span)
nexttile(tilelocation)
nexttile(tilelocation,span)
nexttile(t,___)
ax = nexttile(___)
说明
nexttile 创建一个坐标区对象,再将其放入当前图窗中的分块图布局的下一个空图块中。如果当前图窗中没有布局,则 nexttile 会创建一个新布局并使用 'flow' 图块排列进行配置。生成的坐标区对象是当前坐标区,因此下一个绘图命令可以在其中进行绘制。
nexttile(span) 创建一个占据布局中心网格多行或多列的坐标区对象。指定 span 作为 [r c] 形式的向量。坐标区占据 r 行×c 列的图块。坐标区的左上角位于网格中第一个空的 r×c 区域的左上角。
nexttile(tilelocation) 将当前坐标区指定为 tilelocation 指定的图块中的坐标区或独立可视化。通常,当要修改现有坐标区或独立可视化时,此语法非常有用。然而,在某些情况下,nexttile 会创建一个新坐标区对象:
当指定的图块为空时,nexttile 会在该图块中创建坐标区对象。
如果指定的图块包含坐标区或独立可视化对象的一部分但不包含其左上角,nexttile 将替换现有对象。例如,如果 tilelocation 引用占据多个图块的坐标区对象中间的图块,nexttile 会在指定的图块中用新坐标区对象替换现有坐标区对象。
nexttile(tilelocation,span) 创建一个占据多行或多列的坐标区对象,从 tilelocation 指定的图块开始。如果指定的图块中有坐标区或独立可视化,nexttile 会将该对象设为当前坐标区或替换它:
如果现有坐标区或独立可视化对象占据与 tilelocation 和 span 参数指定的相同的图块集,则 nexttile 会将该对象设为当前坐标区。
如果现有坐标区或独立可视化对象占据的图块集不同于 tilelocation 和 span 参数指定的图块集,则 nexttile 会使用新的 tilelocation 和 span 值用新的坐标区对象替换现有对象。
nexttile(t,___) 对 t 指定的分块图布局进行操作。请在所有其他输入参数之前指定 t。如果使用多个布局,或布局位于面板或选项卡(而不是图窗)中,则此语法非常有用。
ax = nexttile(___) 返回坐标区对象。使用 ax 对坐标区设置属性。也可以将 ax 作为输入参数传递给对坐标区对象执行操作的其他图形函数。例如,可以调用 colormap 或 colororder 函数来更改坐标区的颜色方案。
示例
创建流式布局
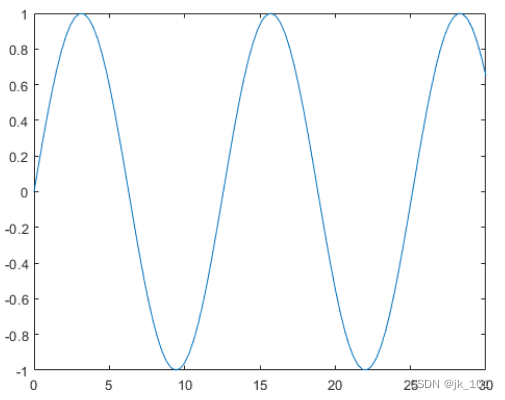
如果分块图布局尚不存在,nexttile 会创建一个分块图布局。创建四个坐标向量:x、y1、y2 和 y3。接下来,调用 nexttile 函数以在第一个图块中创建分块图布局和坐标区对象。然后在第一个图块中绘制 y1。由于 nexttile 使用 'flow' 图块排列创建布局,第一个绘图会填充整个布局。
x = linspace(0,30);
y1 = sin(x/2);
y2 = sin(x/3);
y3 = sin(x/4);

% Plot into first tile three times
nexttile
plot(x,y1)
如图所示:
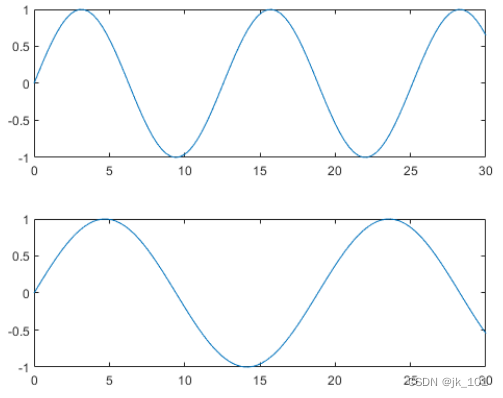
创建第二个图块和坐标区,并绘制到坐标区中。
nexttile
plot(x,y2)
如图所示:
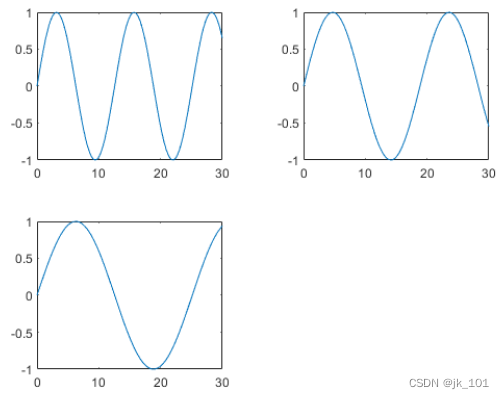
重复该过程以创建第三个绘图。
nexttile
plot(x,y3)
如图所示:
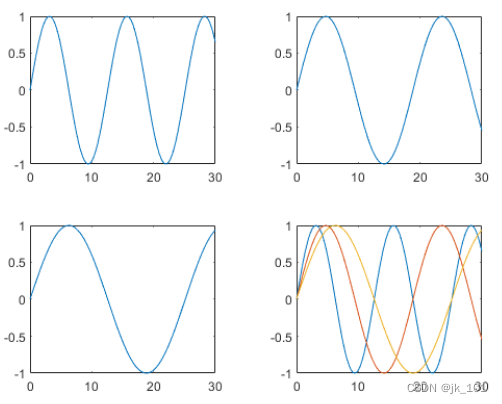
重复该过程以创建第四个绘图。这次,通过在绘制 y1 后调用 hold on 在同一坐标区中绘制全部三条线。
nexttile
plot(x,y1)
hold on
plot(x,y2)
plot(x,y3)
hold off
如图所示:
绘制到 2×2 布局中
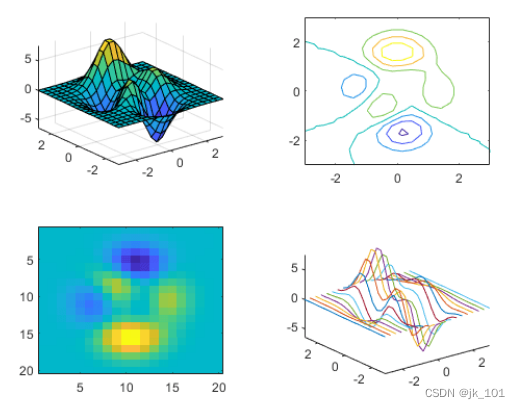
调用 tiledlayout 函数以创建 2×2 分块图布局,并调用 peaks 函数以获取预定义曲面的坐标。通过调用 nexttile 函数,在第一个图块中创建一个坐标区对象。然后调用 surf 函数以绘制到坐标区中。对其他三个图块使用不同绘图函数重复该过程。
tiledlayout(2,2);
[X,Y,Z] = peaks(20);

% Tile 1
nexttile
surf(X,Y,Z)

% Tile 2
nexttile
contour(X,Y,Z)

% Tile 3
nexttile
imagesc(Z)

% Tile 4
nexttile
plot3(X,Y,Z)
如图所示:
对坐标区设置属性
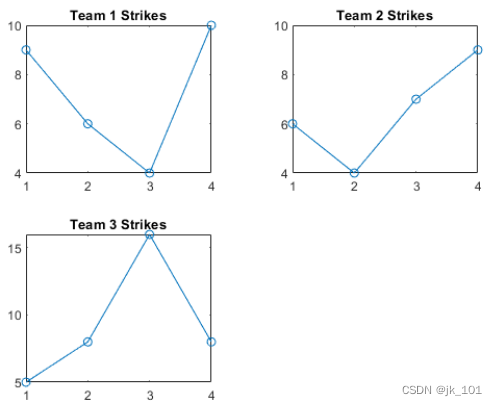
调用 tiledlayout 函数以创建 2×1 分块图布局。带一个输出参数调用 nexttile 函数以存储坐标区。然后绘制到坐标区中,并将 x 和 y 轴的颜色设置为红色。在第二个图块中重复该过程。
t = tiledlayout(2,1);

% First tile
ax1 = nexttile;
plot([1 2 3 4 5],[11 6 10 4 18]);
ax1.XColor = [1 0 0];
ax1.YColor = [1 0 0];

% Second tile
ax2 = nexttile;
plot([1 2 3 4 5],[5 1 12 9 2],'o');
ax2.XColor = [1 0 0];
ax2.YColor = [1 0 0];
如图所示:

创建占据多行和多列的坐标区
将 scores 和 strikes 定义为包含四场保龄球联赛数据的向量。然后创建一个分块图布局,并显示三个图块,分别显示每个团队的击球数量。
scores = [444 460 380
          387 366 500
          365 451 611
          548 412 452];

strikes = [9  6  5
           6  4  8
           4  7  16
           10 9  8];

t = tiledlayout('flow');

% Team 1
nexttile
plot([1 2 3 4],strikes(:,1),'-o')
title('Team 1 Strikes')

% Team 2
nexttile
plot([1 2 3 4],strikes(:,2),'-o')
title('Team 2 Strikes')

% Team 3
nexttile
plot([1 2 3 4],strikes(:,3),'-o')
title('Team 3 Strikes')
如图所示:
调用 nexttile 函数以创建占据两行三列的坐标区对象。然后在此坐标区中显示一个带图例的条形图,并配置轴刻度值和标签。调用 title 函数以向布局中添加一个图块。
nexttile([2 3]);
bar([1 2 3 4],scores)
legend('Team 1','Team 2','Team 3','Location','northwest')

% Configure ticks and axis labels
xticks([1 2 3 4])
xlabel('Game')
ylabel('Score')

% Add layout title
title(t,'April Bowling League Data')
如图所示:

从特定编号的图块开始放置坐标区对象
要从特定位置开始放置坐标区对象,请指定图块编号和跨度值。
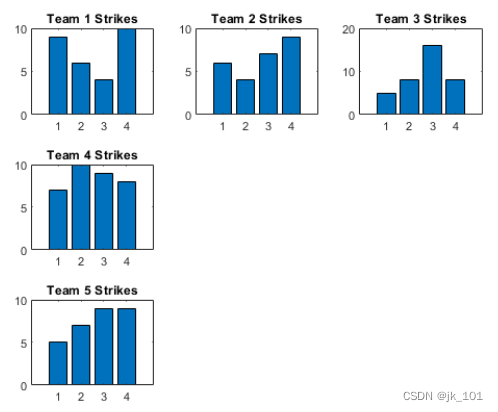
将 scores 和 strikes 定义为包含四场保龄球联赛数据的向量。然后创建一个 3×3 分块图布局,并显示五个条形图,其中显示每个团队的击球次数。
scores = [444 460 380 388 389
          387 366 500 467 460
          365 451 611 426 495
          548 412 452 471 402];

strikes = [9  6  5  7  5
           6  4  8 10  7
           4  7 16  9  9
           10  9  8  8  9];

t = tiledlayout(3,3);

% Team 1
nexttile
bar([1 2 3 4],strikes(:,1))
title('Team 1 Strikes')

% Team 2
nexttile
bar([1 2 3 4],strikes(:,2))
title('Team 2 Strikes')

% Team 3
nexttile
bar([1 2 3 4],strikes(:,3))
title('Team 3 Strikes')

% Team 4
nexttile
bar([1 2 3 4],strikes(:,4))
title('Team 4 Strikes')

% Team 5
nexttile(7)
bar([1 2 3 4],strikes(:,5))
title('Team 5 Strikes')
如图所示:
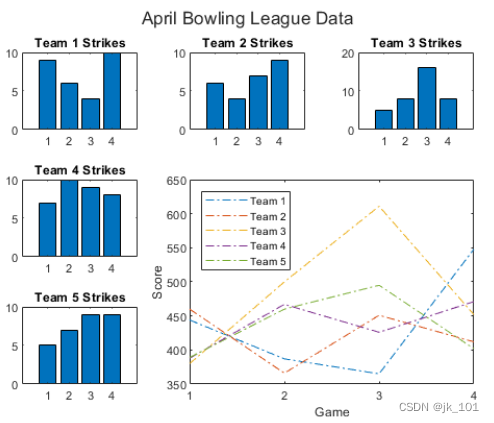
显示一个带有图例的较大绘图。调用 nexttile 函数以将坐标区的左上角放在第五个图块中,并使坐标区占据图块的两行和两列。绘制所有团队的分数。将 x 轴配置为显示四个刻度,并为每个轴添加标签。然后在布局顶部添加一个共享标题。
nexttile(5,[2 2]);
plot([1 2 3 4],scores,'-.')
labels = {'Team 1','Team 2','Team 3','Team 4','Team 5'};
legend(labels,'Location','northwest')

% Configure ticks and axis labels
xticks([1 2 3 4])
xlabel('Game')
ylabel('Score')

% Add layout title
title(t,'April Bowling League Data')
如图所示:
显示极坐标图和地理图
创建 1×2 分块图布局。在第一个图块中,显示包含连接地图上两个城市的线的地理图。在第二个图块中,在极坐标中创建一个散点图。
tiledlayout(1,2)

% Display geographic plot
nexttile
geoplot([47.62 61.20],[-122.33 -149.90],'g-*')

% Display polar plot
nexttile
theta = pi/4:pi/4:2*pi;
rho = [19 6 12 18 16 11 15 15];
polarscatter(theta,rho)
如图所示:

重新配置上一个图块中的内容
nexttile 输出参数的一个有用的用途体现在您想调整前一个图块中的内容时。例如,可能决定要重新配置先前绘图中使用的颜色图。
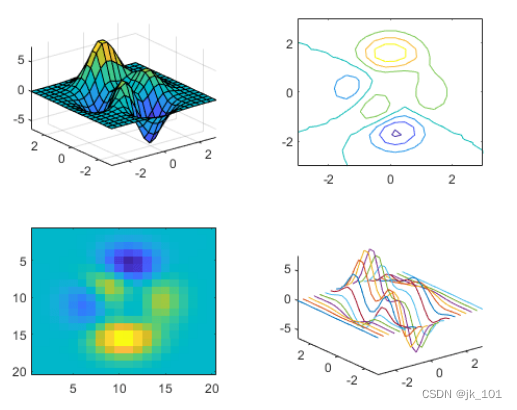
创建一个 2×2 分块图布局。调用 peaks 函数以获取预定义曲面的坐标。然后在每个图块中创建一个不同的曲面图。
tiledlayout(2,2);
[X,Y,Z] = peaks(20);

% Tile 1
nexttile
surf(X,Y,Z)

% Tile 2
nexttile
contour(X,Y,Z)

% Tile 3
nexttile
imagesc(Z)

% Tile 4
nexttile
plot3(X,Y,Z)
如图所示:
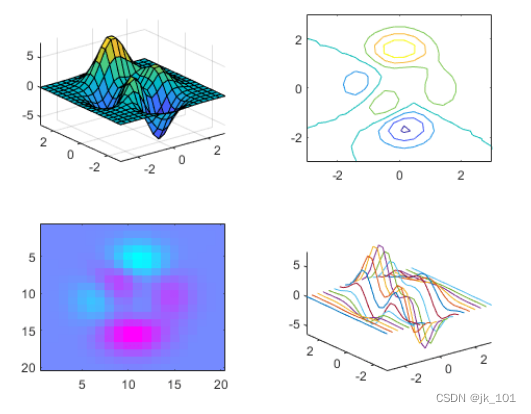
要更改第三个图块中的颜色图,请获取该图块中的坐标区。通过指定图块编号调用 nexttile 函数,并返回坐标区输出参数。然后将坐标区传递给 colormap 函数。
ax = nexttile(3);
colormap(ax,cool)
如图所示:
重新配置跨图块坐标区
创建一个 2×3 分块图布局,其中包含两个分别位于单独图块中的图,以及一个跨两行两列的图。
t = tiledlayout(2,3);
[X,Y,Z] = peaks;

% Tile 1
nexttile
contour(X,Y,Z)

% Span across two rows and columns
nexttile([2 2])
contourf(X,Y,Z)

% Last tile
nexttile
imagesc(Z)
如图所示:

要更改跨图块坐标区的颜色图,请将图块位置标识为坐标区左上角图块所在的位置。在本例中,左上角在第二个图块中。使用 2 作为图块位置调用 nexttile 函数,并指定输出参数以返回该位置的坐标区对象。然后将坐标区传递给 colormap 函数。
ax = nexttile(2);
colormap(ax,hot)
如图所示:

替换上一个图块中的内容
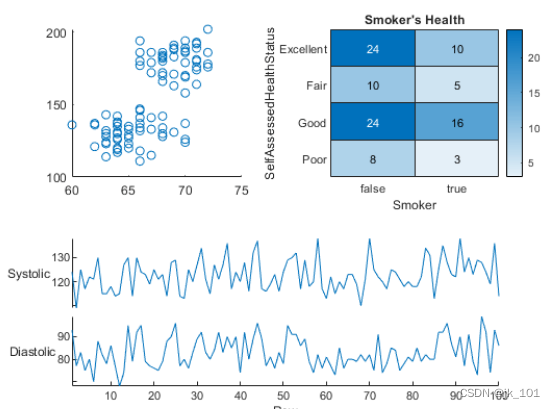
加载 patients 数据集,并基于变量子集创建一个表。然后创建一个 2×2 分块图布局。在第一个图块中显示散点图,在第二个图块中显示热图,并显示跨底部两个图块的堆叠图。
load patients
tbl = table(Diastolic,Smoker,Systolic,Height,Weight,SelfAssessedHealthStatus);
tiledlayout(2,2)

% Scatter plot
nexttile
scatter(tbl.Height,tbl.Weight)

% Heatmap
nexttile
heatmap(tbl,'Smoker','SelfAssessedHealthStatus','Title','Smoker''s Health');

% Stacked plot
nexttile([1 2])
stackedplot(tbl,{'Systolic','Diastolic'});
如图所示:
调用 nexttile,并将图块编号指定为 1 以使该图块中的坐标区成为当前坐标区。用散点直方图替换该图块的内容。
nexttile(1)
scatterhistogram(tbl,'Height','Weight');
如图所示:

在单独图块中显示共享颜色栏
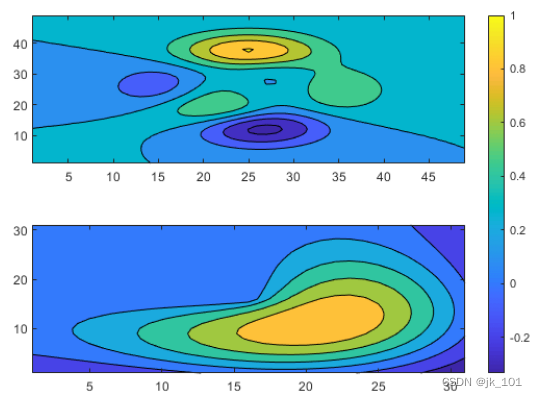
当要在两个或多个图之间共享颜色栏或图例时,可以将其放置在一个单独图块中。在分块图布局中创建 peaks 和 membrane 数据集的填充等高线图。
Z1 = peaks;
Z2 = membrane;
tiledlayout(2,1);
nexttile
contourf(Z1)
nexttile
contourf(Z2)
如图所示:

添加一个颜色栏,并将其移至 east 图块。
cb = colorbar;
cb.Layout.Tile = 'east';
如图所示:
在面板中显示布局
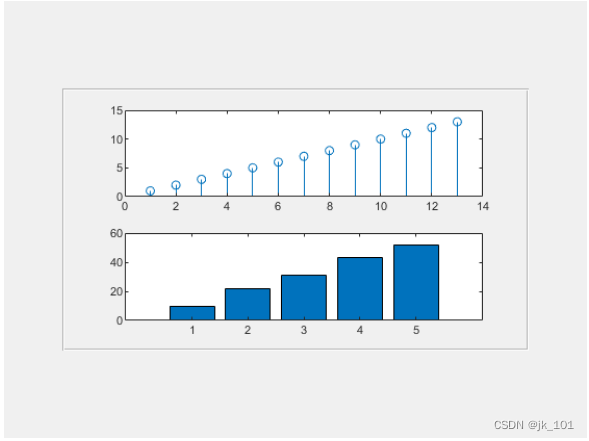
在图窗中创建一个面板。然后通过将面板对象指定为 tiledlayout 函数的第一个参数,在面板中创建分块图布局 t。默认情况下,nexttile 会在图窗中查找布局。但是,布局在面板中而不是在图窗中,因此您在调用 nexttile 时必须指定 t 作为输入参数。
p = uipanel('Position',[.1 .2 .8 .6]);
t = tiledlayout(p,2,1);

% Tile 1
nexttile(t)
stem(1:13)

% Tile 2
nexttile(t)
bar([10 22 31 43 52])
如图所示:
手动创建和配置坐标区
有时,可能需要在调用绘图函数之前手动创建坐标区。在创建坐标区时,请将 parent 参数指定为分块图布局。然后通过对坐标区设置 Layout 属性来定位坐标区。
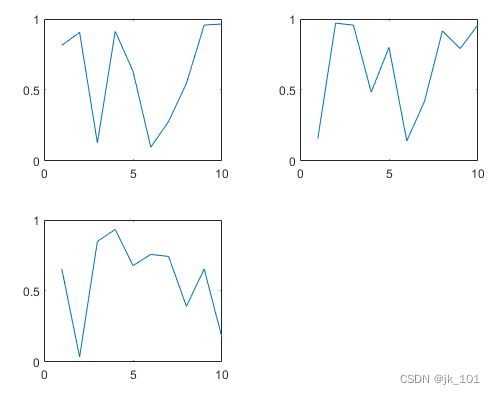
创建分块图布局 t 并指定 'flow' 图块排列。在前三个图块中各显示一个绘图。
t = tiledlayout('flow');
nexttile
plot(rand(1,10));
nexttile
plot(rand(1,10));
nexttile
plot(rand(1,10));
如图所示:
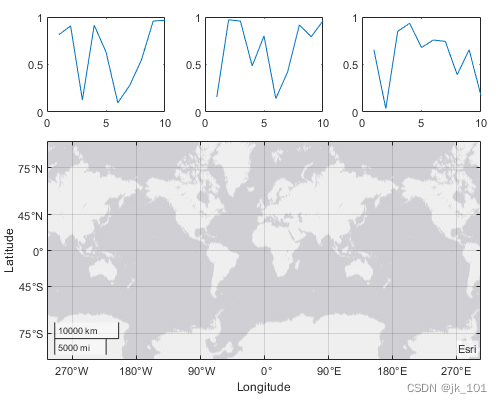
通过调用 geoaxes 函数创建一个地理坐标区对象 gax,并将 t 指定为 parent 参数。默认情况下,坐标区进入第一个图块,因此通过将 gax.Layout.Tile 设置为 4 将其移至第四个图块。通过将 gax.Layout.TileSpan 设置为 [2 3],使坐标区占据图块的 2×3 区域。
gax = geoaxes(t);
gax.Layout.Tile = 4;
gax.Layout.TileSpan = [2 3];
如图所示:
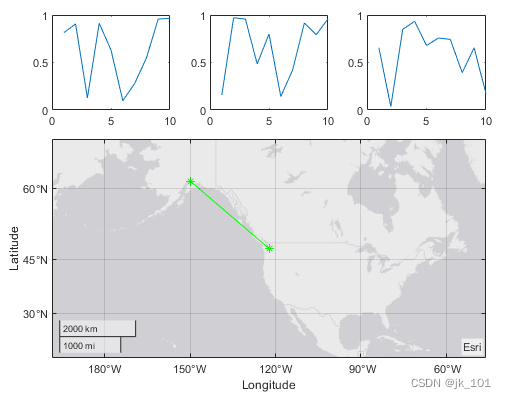
调用 geoplot 函数。然后为坐标区配置地图中心和缩放级别。
geoplot(gax,[47.62 61.20],[-122.33 -149.90],'g-*')
gax.MapCenter = [47.62 -122.33];
gax.ZoomLevel = 2;
如图所示:
以下示例中带标签的矩形展示了网格中的图块和使用默认 TileIndexing 方案布局的外侧图块。实际上,该网格不可见,外侧图块也不占用空间,除非用坐标区填充它们。在每个示例中,边框较粗的矩形反映的是当前选中的图块。
tilelocation | 说明 | 示例 |
|---|---|---|
| 正整数 | 布局中心网格中的一个图块。默认情况下,图块编号从 1 开始,从左到右和从上到下递增。 | 创建一个 2×2 布局,并选择网格中的第三个图块。 tiledlayout(2,2) nexttile(3)
|
| 'north'、'south'、'east' 或 'west' | 网格外层的一个图块。 | 创建一个 2×2 布局,并选择网格右侧的 east 图块。 tiledlayout(2,2)
nexttile('east')
|


注意:如果指定的图块为空,nexttile 会将坐标区对象放置到该图块中。如果图块包含坐标区对象或独立可视化,则该对象将成为当前坐标区,因此下一个绘图命令会绘制到该图块中。
边栏推荐
- Vscode knowledge points - Common Errors
- Sword finger offer 25 Merge two sorted linked lists
- 酒仙网IPO被终止:曾拟募资10亿 红杉与东方富海是股东
- The beginning of life
- How to transfer business data with BorgWarner through EDI?
- 超卓航科上市:募资9亿市值超60亿 成襄阳首家科创板企业
- 剑指 Offer 26. 树的子结构
- Fuyuan medicine is listed on the Shanghai Stock Exchange: the market value is 10.5 billion, and Hu Baifan is worth more than 4billion
- Sword finger offer 24 Reverse linked list
- The impact of telecommuting on all aspects of our experience | community essay solicitation
猜你喜欢
Does digicert SSL certificate support Chinese domain name application?

Sword finger offer 21 Adjust the array order so that odd numbers precede even numbers
ETH数据集下载及相关问题

Fuyuan medicine is listed on the Shanghai Stock Exchange: the market value is 10.5 billion, and Hu Baifan is worth more than 4billion

13、Darknet YOLO3
GeoServer:发布PostGIS数据源
TCP拥塞控制详解 | 2. 背景

The computer comes with software to make the background color of the picture transparent (matting white background)

使用知行之桥的API端口,提供资源供合作伙伴访问
Believe in yourself and finish the JVM interview this time
随机推荐
Qwebengineview crash and alternatives
JS20 数组扁平化
ROS知识点——消息过滤器 ( message_filters)
[web technology] 1233 seconds understand web component
Amazon cloud technology community builder application window opens
简单介绍BASE64Encoder的使用
executescalar mysql_ExecuteScalar()
Weili holdings listed on the Hong Kong Stock Exchange: with a market value of HK $500million, it contributed an IPO to Hubei
How to transfer business data with BorgWarner through EDI?
牛客JS2 文件扩展名
[leetcode] 14. Préfixe public le plus long
Use of openpose
Meanings of SNAT, DNAT and masquerade in iptables
Eye of depth (III) -- determinant of matrix
超卓航科上市:募资9亿市值超60亿 成襄阳首家科创板企业
Exploration of mobile application performance tools
ROS knowledge points -- the difference between ros:: nodehandle N and NH ("~")
宝宝巴士创业板IPO被终止:曾拟募资18亿 唐光宇控制47%股权
Soul, a social meta universe platform, rushed to Hong Kong stocks: Tencent is a shareholder with an annual revenue of 1.28 billion
一年顶十年