当前位置:网站首页>Detailed explanation of kubernetes log monitoring system architecture
Detailed explanation of kubernetes log monitoring system architecture
2022-06-23 13:38:00 【51CTO】
1 background
With more and more customers , The complexity of customers' business is increasing , The traditional server level monitoring is too large , And when the alarm needs further investigation , Can't meet the demand , In order to get into the customer business , Ensure the healthy operation of the business , We need to collect the logs of the server system 、 Customer business log , And analyze it , When a fault occurs, the cause of the fault can be located at the first time , Inform the corresponding personnel to deal with , So how to collect log files , How to render the log file , And when the fault occurs, the first time to inform the corresponding business responsible personnel , It has become a problem for many companies , So the log monitoring system came into being .
2 Architecture design of log monitoring system
2.1 Architecture Composition

2.2 Architecture strategy
Configure the log collection client on the data source side , Responsible for collecting original logs and summarizing them to MQ,MQ choice Kafka Cache and distribute log messages , Back end deployment LogStash, subscribe Kafka topic Internal log messages , And write ES File store .
ElastAlert Determine whether the log message contains information such as errors or exceptions , Through the mail 、 Send it to relevant contacts by SMS, etc ,ES Provide data to Grafana/Kibana Show the data , User access web Interface query real-time log
3 Introduction to log monitoring system
3.1 Data collection
The data acquisition layer is located on the business server cluster , Data collection tools are installed on each business server , Do log collection , Including application logs 、 system log 、 Access logs, etc , Then the original logs collected are sent to the message queue cluster .
Data acquisition tools (Agent) We need to consider :
- Deployment way
- The ease of deployment
- Business intrusion
- resource consumption
At present, the mainstream open source log collection tools are :Logstash,Filebeat,Fluentd etc.
Logstash
Logstash Is an open source data collection engine , With real-time pipeline function .Logstash It can dynamically unify data from different data sources , And standardize the data to your chosen destination
- The advantage is its flexibility , It provides a lot of plug-ins , Detailed documentation and straightforward configuration format make it applicable in a variety of scenarios . And now
ELK The whole technology stack is widely used in many companies , So basically, we can find a lot of related learning resources - The disadvantage is its performance and resource consumption . Although its performance has greatly improved in recent years , It's much slower than its substitutes , It can be a problem in the case of large amounts of data . Another problem is that it doesn't currently support caching .
Filebeat
Filebeat Is a lightweight log transfer tool , Its existence is making up for Logstash The shortcomings of ,Filebeat As a lightweight log transfer tool, you can push logs to Kafka、Logstash、ElasticSearch、Redis
- The advantage is that it's just a binary without any dependencies . It takes up very little resources , Even though it's very young , Formal because it's simple , So there's little that can go wrong , So its reliability is very high .
- The disadvantage is that
Filebeat The scope of application is very limited , So in some scenarios we have problems . for example , If you use Logstash As a downstream pipeline , We also have performance problems . Because of that Filebeat It's expanding . At the beginning of the , It can only send logs to Logstash and Elasticsearch, Now it can send logs to Kafka and Redis.
Fluentd
Fluentd The purpose of creation is to use it as much as possible JSON Output as log , Therefore, the transmission tool and its downstream transmission line do not need to guess the types of fields in the substring . So it provides libraries for almost all languages , It also means that it can be inserted into a custom program .
- Advantage is
Fluentd The plug-in uses Ruby Language development is very easy to write and maintain . So it's a lot , Almost all source and target stores have plug-ins . It also means that it can be used Fluentd To connect everything . - The disadvantage is that
Fluentd It's not very flexible . But you can still parse unstructured data through regular expressions . Although performance is good in most scenarios , But it's not the best , Its buffer only exists with the output , Single threaded core and Ruby GIL The plug-in implemented means that its performance is limited under large nodes .
in summary ,Filebeat With very few resources 、 Lightweight 、 High reliability 、 Simple deployment , Therefore, the data acquisition layer tool adopts Filebeat
3.2 Message queue
As the business expands , Daily quality is growing , There are more and more product lines connected to log services , It's a rush hour , Write to ES The performance of the system will be reduced ,cpu Full , There is a risk of cluster downtime at any time . therefore , You need to introduce a message queue for Peak shaving and valley filling . The original log is sent to Kafka+Zookeeper After clustering , Centralized storage , here ,filebeat It's the producer of information , Stored messages can be consumed at any time .
3.3 Data analysis
LogStash As a consumer , Will go to Kafka+zookeeper Cluster nodes pull the original logs in real time , Then analyze the original log according to the rules 、 cleaning 、 Filter , Finally, forward the cleaned log to Elasticsearch colony .
3.4 Data persistence storage
Elasticsearch The cluster is receiving Logstash After sending the data , Perform write to disk , Build index library and other operations , Finally, the structured data is stored in Elasticsearch On the cluster
3.5 Data query display
Kibana/Grafana It's a visual data display platform , When there is a data retrieval request , It is from Elasticsearch Read data on the cluster , Then visualization and multi-dimensional analysis are carried out
4 Installation and deployment
4.1 Environmental preparation
The server | Running software | Deployment way |
10.1.1.11 | Nginx + Filebeat | Binary system |
10.1.1.12 | Kafka + Zookeeper | docker-compose |
10.1.1.13 | ES + Logstash | docker-compose + Binary system |
10.1.1.14 | Kibana + Grafana | Binary system |
4.2 docker The deployment environment
stay 10.1.1.12 and 10.1.1.13 Upper Department
4.2.1 install docker
       [[email protected]_zoo ~]

       # yum install -y yum-utils device-mapper-persistent-data lvm2


[[email protected]_zoo ~]

       # yum-config-manager --add-repo http://mirrors.aliyun.com/docker-ce/linux/centos/docker-ce.repo


[[email protected]_zoo ~]

       # yum -y install docker-ce


docker

       -v


[[email protected]_zoo ~]

       # docker -v


Docker version

       20.10.6, build 370c289
- 1.
- 2.
- 3.
- 4.
- 5.
- 6.
4.2.2 Configuration accelerator
       [[email protected]_zoo ~]

       # sudo mkdir -p /etc/docker


[[email protected]_zoo ~]

       # sudo tee /etc/docker/daemon.json <<-'EOF'


{


       "registry-mirrors": [

       "https://su9ppkb0.mirror.aliyuncs.com"]


}


EOF


[[email protected]_zoo ~]

       # systemctl daemon-reload


[[email protected]_zoo ~]

       # systemctl start docker


[[email protected]_zoo ~]

       # systemctl enable docker
- 1.
- 2.
- 3.
- 4.
- 5.
- 6.
- 7.
- 8.
- 9.
4.2.3 install docker-compose
       [[email protected]_zoo ~]

       # yum install docker-compose -y


[[email protected]_zoo ~]

       # docker-compose -v


docker-compose version

       1.18.0, build 8dd22a9
- 1.
- 2.
- 3.
4.3 Deploy ES colony
4.3.1 Environment configuration
       #  Optimize the kernel , Yes es Support


[[email protected]_logst es]

       # echo 'vm.max_map_count=262144' >> /etc/sysctl.conf


[[email protected]_logst es]

       # sysctl -p


       #  Configuration variables


[[email protected]_logst es]

       # echo 'ELK_VERSION=7.5.1' > .env


       #  Turn on IPv4 forward


[[email protected]_logst es]

       # echo "net.ipv4.ip_forward = 1" /usr/lib/sysctl.d/00-system.conf


[[email protected]_logst es]

       # systemctl restart network


[[email protected]_logst es]

       # systemctl restart docker
- 1.
- 2.
- 3.
- 4.
- 5.
- 6.
- 7.
- 8.
- 9.
- 10.
- 11.
4.3.2 Prepare directory
4.3.3 Prepare the configuration file
cat /data/es/docker-compose.yml
version
'3.3'
services
es01
build
context
elasticsearch/
args
ELK_VERSION
$ELK_VERSION
container_name
es01
volumes
type
bind
source
/data/es/config/elasticsearch.yml
target
/usr/share/elasticsearch/config/elasticsearch.yml
read_only
true
type
volume
source
data-es1
target
/usr/share/elasticsearch/data
ports
9200:9200
9300:9300
environment
node.name=es01
cluster.name=es-docker-cluster
discovery.seed_hosts=es02,es03
cluster.initial_master_nodes=es01,es02,es03
"ES_JAVA_OPTS=-Xms512m -Xmx512m"
ulimits
memlock
soft
-1
hard
-1
networks
elastic
es02
build
context
elasticsearch/
args
ELK_VERSION
$ELK_VERSION
container_name
es02
volumes
type
bind
source
/data/es/config/elasticsearch.yml
target
/usr/share/elasticsearch/config/elasticsearch.yml
read_only
true
type
volume
source
data-es2
target
/usr/share/elasticsearch/data
environment
node.name=es02
cluster.name=es-docker-cluster
discovery.seed_hosts=es01,es03
cluster.initial_master_nodes=es01,es02,es03
bootstrap.memory_lock=true
"ES_JAVA_OPTS=-Xms512m -Xmx512m"
ulimits
memlock
soft
-1
hard
-1
networks
elastic
es03
build
context
elasticsearch/
args
ELK_VERSION
$ELK_VERSION
container_name
es03
volumes
type
bind
source
/data/es/config/elasticsearch.yml
target
/usr/share/elasticsearch/config/elasticsearch.yml
read_only
true
type
volume
source
data-es3
target
/usr/share/elasticsearch/data
environment
node.name=es03
cluster.name=es-docker-cluster
discovery.seed_hosts=es01,es02
cluster.initial_master_nodes=es01,es02,es03
bootstrap.memory_lock=true
"ES_JAVA_OPTS=-Xms512m -Xmx512m"
ulimits
memlock
soft
-1
hard
-1
networks
elastic
volumes
data-es1
driver
local
driver_opts
type
none
o
bind
device
/data/es/data-es1
data-es2
driver
local
driver_opts
type
none
o
bind
device
/data/es/data-es2
data-es3
driver
local
driver_opts
type
none
o
bind
device
/data/es/data-es3
networks
elastic
driver
bridge
- 1.
- 2.
- 3.
- 4.
- 5.
- 6.
- 7.
- 8.
- 9.
- 10.
- 11.
- 12.
- 13.
- 14.
- 15.
- 16.
- 17.
- 18.
- 19.
- 20.
- 21.
- 22.
- 23.
- 24.
- 25.
- 26.
- 27.
- 28.
- 29.
- 30.
- 31.
- 32.
- 33.
- 34.
- 35.
- 36.
- 37.
- 38.
- 39.
- 40.
- 41.
- 42.
- 43.
- 44.
- 45.
- 46.
- 47.
- 48.
- 49.
- 50.
- 51.
- 52.
- 53.
- 54.
- 55.
- 56.
- 57.
- 58.
- 59.
- 60.
- 61.
- 62.
- 63.
- 64.
- 65.
- 66.
- 67.
- 68.
- 69.
- 70.
- 71.
- 72.
- 73.
- 74.
- 75.
- 76.
- 77.
- 78.
- 79.
- 80.
- 81.
- 82.
- 83.
- 84.
- 85.
- 86.
- 87.
- 88.
- 89.
- 90.
- 91.
- 92.
- 93.
- 94.
- 95.
- 96.
- 97.
- 98.
- 99.
- 100.
- 101.
- 102.
- 103.
- 104.
- 105.
- 106.
- 107.
- 108.
- 109.
- 110.
- 111.
/data/es/elasticsearch/Dockerfile
/data/es/config/elasticsearch.yml
Catalog Overview
       [[email protected]_logst data]

       # pwd


/data


[[email protected]_logst data]

       # tree


.


       `-- es


        |-- config


        | `

       -- elasticsearch.yml


    |-- data-es1


    |-- data-es2


    |-- data-es3


    |-- docker-compose.yml


       `-- elasticsearch


        `

       -- Dockerfile


       6 directories,

       3 files
- 1.
- 2.
- 3.
- 4.
- 5.
- 6.
- 7.
- 8.
- 9.
- 10.
- 11.
- 12.
- 13.
- 14.
- 15.
4.3.4 start-up ES colony
       [[email protected]_logst es]

       # docker-compose up -d


Starting es02 ...


Starting es03 ...


Starting es01 ...

       done


[[email protected]_logst es]

       # docker-compose ps


Name              Command               State                         Ports


       --

       --

       --

       --

       --

       --

       --

       --

       --

       --

       --

       --

       --

       --

       --

       --

       --

       --

       --

       --

       --

       --

       --

       --

       --

       --

       --

       --

       --

       --

       --

       --

       --

       --

       --

       --

       --

       --

       --

       --

       --

       --

       --

       --

       --

       --

       --

       --

       --


es01   /usr/local/bin/docker-entr ...   Up

       0.0.0.0:9200->9200/tcp,:::9200->9200/tcp,

       9300/tcp


es02   /usr/local/bin/docker-entr ...   Up

       9200/tcp,

       9300/tcp


es03   /usr/local/bin/docker-entr ...   Up

       9200/tcp,

       9300/tcp
- 1.
- 2.
- 3.
- 4.
- 5.
- 6.
- 7.
- 8.
- 9.
- 10.
- 11.
       [[email protected]_logst es]

       # curl 10.1.1.13:9200


{


       "name" :

       "es01",


       "cluster_name" :

       "es-docker-cluster",


       "cluster_uuid" :

       "P5FnRclnSBCkO_wPAMJPow",


       "version" : {


       "number" :

       "7.5.1",


       "build_flavor" :

       "default",


       "build_type" :

       "docker",


       "build_hash" :

       "3ae9ac9a93c95bd0cdc054951cf95d88e1e18d96",


       "build_date" :

       "2019-12-16T22:57:37.835892Z",


       "build_snapshot" :

       false,


       "lucene_version" :

       "8.3.0",


       "minimum_wire_compatibility_version" :

       "6.8.0",


       "minimum_index_compatibility_version" :

       "6.0.0-beta1"


  },


       "tagline" :

       "You Know, for Search"


}
- 1.
- 2.
- 3.
- 4.
- 5.
- 6.
- 7.
- 8.
- 9.
- 10.
- 11.
- 12.
- 13.
- 14.
- 15.
- 16.
- 17.
- 18.
thus ,ES Cluster deployment is complete .
4.4 Deploy Kibana
4.4.1 install Kibana
       [[email protected]_gra ~]

       # mkdir /data/kibana && cd /data/kibana


[[email protected]_gra kibana]

       # wget https://artifacts.elastic.co/downloads/kibana/kibana-7.5.1-x86_64.rpm
- 1.
- 2.
       #  install


[[email protected]_gra kibana]

       # yum install -y kibana-7.5.1-x86_64.rpm


[[email protected]_gra kibana]

       # systemctl enable kibana.service


[[email protected]_gra kibana]

       # systemctl start kibana.service


       #  Modify the configuration file


[[email protected]_gra kibana]

       # grep -Ev "^#|^$" /etc/kibana/kibana.yml


server.port:

       5601


server.host:

       "localhost"


elasticsearch.hosts: [

       "http://10.1.1.13:9200"]


i18n.locale:

       "zh-CN"


       #  To configure hosts


       10.1.1.13 es01 es02 es03
- 1.
- 2.
- 3.
- 4.
- 5.
- 6.
- 7.
- 8.
- 9.
- 10.
- 11.
- 12.
- 13.
- 14.
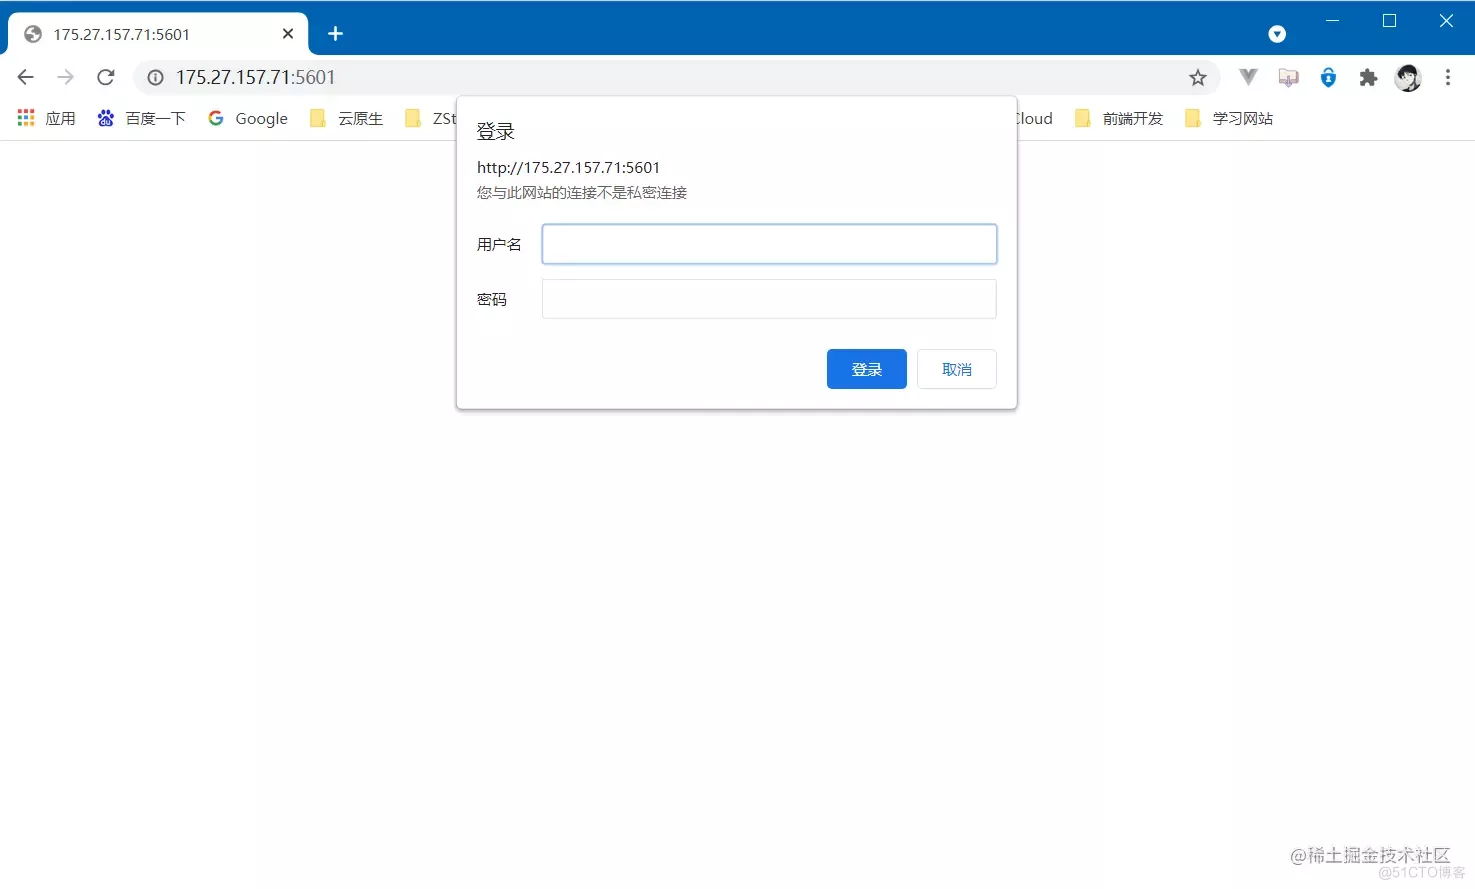
4.4.2 install Nginx
       # because kibana from 5.5 Version start , It doesn't provide authentication , Use official X-Pack Mode charge , Here the nginx The agent of certification .


       #yum install nginx


[[email protected]_gra ~]

       # yum install -y nginx


       # To configure kiban User name password authentication login


[[email protected]_gra ~]

       # yum install -y httpd-tools


[[email protected]_gra ~]

       # mkdir -p /etc/nginx/passwd


[[email protected]_gra ~]

       # htpasswd -c -b /etc/nginx/passwd/kibana.passwd kibana [email protected]


       # Enter into nginx Of conf.d Under the table of contents , To configure kibana.conf file


[[email protected]_gra ~]

       # vim /etc/nginx/conf.d/kibana.conf


server {


    listen

       10.58.96.183:5601;


    auth_basic

       "Kibana Auth";


    auth_basic_user_file /etc/nginx/passwd/kibana.passwd;


    location / {


        proxy_pass http://127.0.0.1:5601;


        proxy_redirect off;


    }


}


[[email protected]_gra conf.d]

       # systemctl start nginx


[[email protected]_gra conf.d]

       # systemctl enable nginx
- 1.
- 2.
- 3.
- 4.
- 5.
- 6.
- 7.
- 8.
- 9.
- 10.
- 11.
- 12.
- 13.
- 14.
- 15.
- 16.
- 17.
- 18.
- 19.
- 20.
- 21.
- 22.
4.4.2 visit Kibana

4.5 Deploy Kafka colony
4.5.1 Prepare the configuration file
version
'2'
services
zoo1
image
wurstmeister/zookeeper
restart
always
hostname
zoo1
container_name
zoo1
ports
2184:2181
volumes
"/data/kafka/volume/zoo1/data:/data"
"/data/kafka/volume/zoo1/datalog:/datalog"
environment
ZOO_MY_ID
1
ZOO_SERVERS
server.1=0.0.0.0
2888
3888 server.2=zoo2
2888
3888 server.3=zoo3
2888
3888
networks
kafka
ipv4_address
172.19.0.11
zoo2
image
wurstmeister/zookeeper
restart
always
hostname
zoo2
container_name
zoo2
ports
2185:2181
volumes
"/data/kafka/volume/zoo2/data:/data"
"/data/kafka/volume/zoo2/datalog:/datalog"
environment
ZOO_MY_ID
2
ZOO_SERVERS
server.1=zoo1
2888
3888 server.2=0.0.0.0
2888
3888 server.3=zoo3
2888
3888
networks
kafka
ipv4_address
172.19.0.12
zoo3
image
wurstmeister/zookeeper
restart
always
hostname
zoo3
container_name
zoo3
ports
2186:2181
volumes
"/data/kafka/volume/zoo3/data:/data"
"/data/kafka/volume/zoo3/datalog:/datalog"
environment
ZOO_MY_ID
3
ZOO_SERVERS
server.1=zoo1
2888
3888 server.2=zoo2
2888
3888 server.3=0.0.0.0
2888
3888
networks
kafka
ipv4_address
172.19.0.13
kafka1
image
wurstmeister/kafka
restart
always
hostname
kafka1
container_name
kafka1
ports
9092:9092
environment
KAFKA_ADVERTISED_HOST_NAME
kafka1
KAFKA_ADVERTISED_PORT
9092
KAFKA_ZOOKEEPER_CONNECT
zoo1
2181,zoo2
2181,zoo3
2181
KAFKA_ADVERTISED_LISTENERS
PLAINTEXT
//kafka1
9092
KAFKA_LISTENERS
PLAINTEXT
//kafka1
9092
volumes
/data/kafka/logs/kafka1/logs:/kafka
external_links
zoo1
zoo2
zoo3
networks
kafka
ipv4_address
172.19.0.14
kafka2
image
wurstmeister/kafka
restart
always
hostname
kafka2
container_name
kafka2
ports
9093:9093
environment
KAFKA_ADVERTISED_HOST_NAME
kafka2
KAFKA_ADVERTISED_PORT
9093
KAFKA_ZOOKEEPER_CONNECT
zoo1
2181,zoo2
2181,zoo3
2181
KAFKA_ADVERTISED_LISTENERS
PLAINTEXT
//kafka2
9093
KAFKA_LISTENERS
PLAINTEXT
//kafka2
9093
volumes
/data/kafka/logs/kafka2/logs:/kafka
external_links
zoo1
zoo2
zoo3
networks
kafka
ipv4_address
172.19.0.15
kafka3
image
wurstmeister/kafka
restart
always
hostname
kafka3
container_name
kafka3
ports
9094:9094
environment
KAFKA_ADVERTISED_HOST_NAME
kafka3
KAFKA_ADVERTISED_PORT
9094
KAFKA_ZOOKEEPER_CONNECT
zoo1
2181,zoo2
2181,zoo3
2181
KAFKA_ADVERTISED_LISTENERS
PLAINTEXT
//kafka3
9094
KAFKA_LISTENERS
PLAINTEXT
//kafka3
9094
volumes
/data/kafka/logs/kafka3/logs:/kafka
external_links
zoo1
zoo2
zoo3
networks
kafka
ipv4_address
172.19.0.16
networks
kafka
external
name
kafka
- 1.
- 2.
- 3.
- 4.
- 5.
- 6.
- 7.
- 8.
- 9.
- 10.
- 11.
- 12.
- 13.
- 14.
- 15.
- 16.
- 17.
- 18.
- 19.
- 20.
- 21.
- 22.
- 23.
- 24.
- 25.
- 26.
- 27.
- 28.
- 29.
- 30.
- 31.
- 32.
- 33.
- 34.
- 35.
- 36.
- 37.
- 38.
- 39.
- 40.
- 41.
- 42.
- 43.
- 44.
- 45.
- 46.
- 47.
- 48.
- 49.
- 50.
- 51.
- 52.
- 53.
- 54.
- 55.
- 56.
- 57.
- 58.
- 59.
- 60.
- 61.
- 62.
- 63.
- 64.
- 65.
- 66.
- 67.
- 68.
- 69.
- 70.
- 71.
- 72.
- 73.
- 74.
- 75.
- 76.
- 77.
- 78.
- 79.
- 80.
- 81.
- 82.
- 83.
- 84.
- 85.
- 86.
- 87.
- 88.
- 89.
- 90.
- 91.
- 92.
- 93.
- 94.
- 95.
- 96.
- 97.
- 98.
- 99.
- 100.
- 101.
- 102.
- 103.
- 104.
- 105.
- 106.
- 107.
- 108.
- 109.
- 110.
- 111.
- 112.
- 113.
- 114.
- 115.
- 116.
- 117.
- 118.
- 119.
- 120.
- 121.
- 122.
- 123.
- 124.
- 125.
- 126.
- 127.
4.5.2 start-up Kafka colony
       #  Creating networks


[[email protected]_zoo kafka]

       # docker network create --subnet=172.19.0.0/24 kafka


       #  Start cluster


[[email protected]_zoo kafka]

       # docker-compose up -d


Creating zoo2 ...

       done


Creating zoo3 ...


Creating kafka1 ...


Creating zoo1 ...


Creating kafka2 ...


Creating zoo2 ...


       #  View the cluster status


[[email protected]_zoo kafka]

       # docker-compose ps


 Name               Command               State                                  Ports


       --

       --

       --

       --

       --

       --

       --

       --

       --

       --

       --

       --

       --

       --

       --

       --

       --

       --

       --

       --

       --

       --

       --

       --

       --

       --

       --

       --

       --

       --

       --

       --

       --

       --

       --

       --

       --

       --

       --

       --

       --

       --

       --

       --

       --

       --

       --

       --

       --

       --

       --

       --

       --

       --

       --

       --

       --

       --

       --


kafka1   start-kafka.sh                   Up

       0.0.0.0:9092->9092/tcp,:::9092->9092/tcp


kafka2   start-kafka.sh                   Up

       0.0.0.0:9093->9093/tcp,:::9093->9093/tcp


kafka3   start-kafka.sh                   Up

       0.0.0.0:9094->9094/tcp,:::9094->9094/tcp


zoo1     /bin/sh

       -c /usr/sbin/sshd  ...   Up

       0.0.0.0:2184->2181/tcp,:::2184->2181/tcp,

       22/tcp,

       2888/tcp,

       3888/tcp


zoo2     /bin/sh

       -c /usr/sbin/sshd  ...   Up

       0.0.0.0:2185->2181/tcp,:::2185->2181/tcp,

       22/tcp,

       2888/tcp,

       3888/tcp


zoo3     /bin/sh

       -c /usr/sbin/sshd  ...   Up

       0.0.0.0:2186->2181/tcp,:::2186->2181/tcp,

       22/tcp,

       2888/tcp,

       3888/tcp
- 1.
- 2.
- 3.
- 4.
- 5.
- 6.
- 7.
- 8.
- 9.
- 10.
- 11.
- 12.
- 13.
- 14.
- 15.
- 16.
- 17.
- 18.
- 19.
- 20.
- 21.
- 22.
4.6 Deploy Filebeat
4.6.1 install Filebeat
       [[email protected]_ng filebeat]

       # mkdir /data/filebeat && cd /data/filebeat


[[email protected]_ng filebeat]

       # wget https://artifacts.elastic.co/downloads/beats/filebeat/filebeat-6.8.5-linux-x86_64.tar.gz


[[email protected]_ng filebeat]

       # mv filebeat-6.8.5-linux-x86_64 /usr/local/filebeat
- 1.
- 2.
- 3.
4.6.2 To configure Filebeat
Back up the default profile
New configuration file , Read nginx journal
filebeat.inputs
type
log
access
enabled
true
json.keys_under_root
true
json.overwrite_keys
true
json.add_error_key
true
paths
/var/log/nginx/access.log
fields
source
nginx-access
setup.ilm.enabled
false
output.kafka
enabled
true
hosts
"10.1.1.12:9092"
"10.1.1.12:9093"
"10.1.1.12:9094"
topic
"elk-%{[fields.source]}"
partition.hash
reachable_only
true
compression
gzip
max_message_bytes
1000000
bulk_max_size
2048
- 1.
- 2.
- 3.
- 4.
- 5.
- 6.
- 7.
- 8.
- 9.
- 10.
- 11.
- 12.
- 13.
- 14.
- 15.
- 16.
- 17.
- 18.
- 19.
- 20.
- 21.
- 22.
- 23.
4.6.3 start-up Filebeat
       [[email protected]_ng filebeat]

       # nohup ./filebeat -e -c filebeat.yml &


[1]

       6624


[[email protected]_ng filebeat]

       # nohup: ignoring input and appending output to ‘nohup.out’
- 1.
- 2.
- 3.
After that, it worked , Can be accurately output to kafka
4.7 Deploy LogStash
4.7.1 install LogStash
       [[email protected]_logst ~]

       # yum install java -y


[[email protected]_logst ~]

       # mkdir /data/logstash && cd /data/logstash


[[email protected]_logst ~]

       # wget https://artifacts.elastic.co/downloads/logstash/logstash-7.0.0.tar.gz


[[email protected]_logst logstash]

       # tar zxf logstash-7.0.0.tar.gz


[[email protected]_logst logstash]

       # mv logstash-7.0.0 /usr/local/logstash
- 1.
- 2.
- 3.
- 4.
- 5.
4.7.2 To configure LogStash
       [[email protected]_logst logstash]

       # cd /usr/local/logstash/config/


[[email protected]_logst config]

       # mv logstash-sample.conf logstash-sample.conf.bak
- 1.
- 2.
New configuration file logstash-sample.conf
input
kafka
bootstrap_servers =>
"10.1.1.12:9092,10.1.1.12:9093,10.1.1.12:9094"
auto_offset_reset =>
"latest"
topics_pattern =>
"elk-.*"
codec =>
"json"
consumer_threads => 5
decorate_events =>
"true"
filter
geoip
target =>
"geoip"
source =>
"client_ip"
add_field =>
"[geoip][coordinates]"
"%{[geoip][longitude]}"
add_field =>
"[geoip][coordinates]"
"%{[geoip][latitude]}"
remove_field =>
"[geoip][latitude]"
"[geoip][longitude]"
"[geoip][country_code]"
"[geoip][country_code2]"
"[geoip][country_code3]"
"[geoip][timezone]"
"[geoip][continent_code]"
"[geoip][region_code]"
mutate
convert =>
"size"
"integer"
convert =>
"status"
"integer"
convert =>
"responsetime"
"float"
convert =>
"upstreamtime"
"float"
convert =>
"[geoip][coordinates]"
"float"
remove_field =>
"ecs"
"agent"
"host"
"cloud"
"@version"
"input"
"logs_type"
useragent
source =>
"http_user_agent"
target =>
"ua"
remove_field =>
"[ua][minor]"
"[ua][major]"
"[ua][build]"
"[ua][patch]"
"[ua][os_minor]"
"[ua][os_major]"
output
elasticsearch
# Logstash Output to ES
hosts =>
"10.1.1.13:9200"
index =>
"%{[fields][source]}-%{+YYYY-MM-dd}"
stdout
codec => rubydebug
- 1.
- 2.
- 3.
- 4.
- 5.
- 6.
- 7.
- 8.
- 9.
- 10.
- 11.
- 12.
- 13.
- 14.
- 15.
- 16.
- 17.
- 18.
- 19.
- 20.
- 21.
- 22.
- 23.
- 24.
- 25.
- 26.
- 27.
- 28.
- 29.
- 30.
- 31.
- 32.
- 33.
- 34.
- 35.
- 36.
- 37.
- 38.
- 39.
- 40.
- 41.
- 42.
- 43.
- 44.
4.8 To configure Kibana


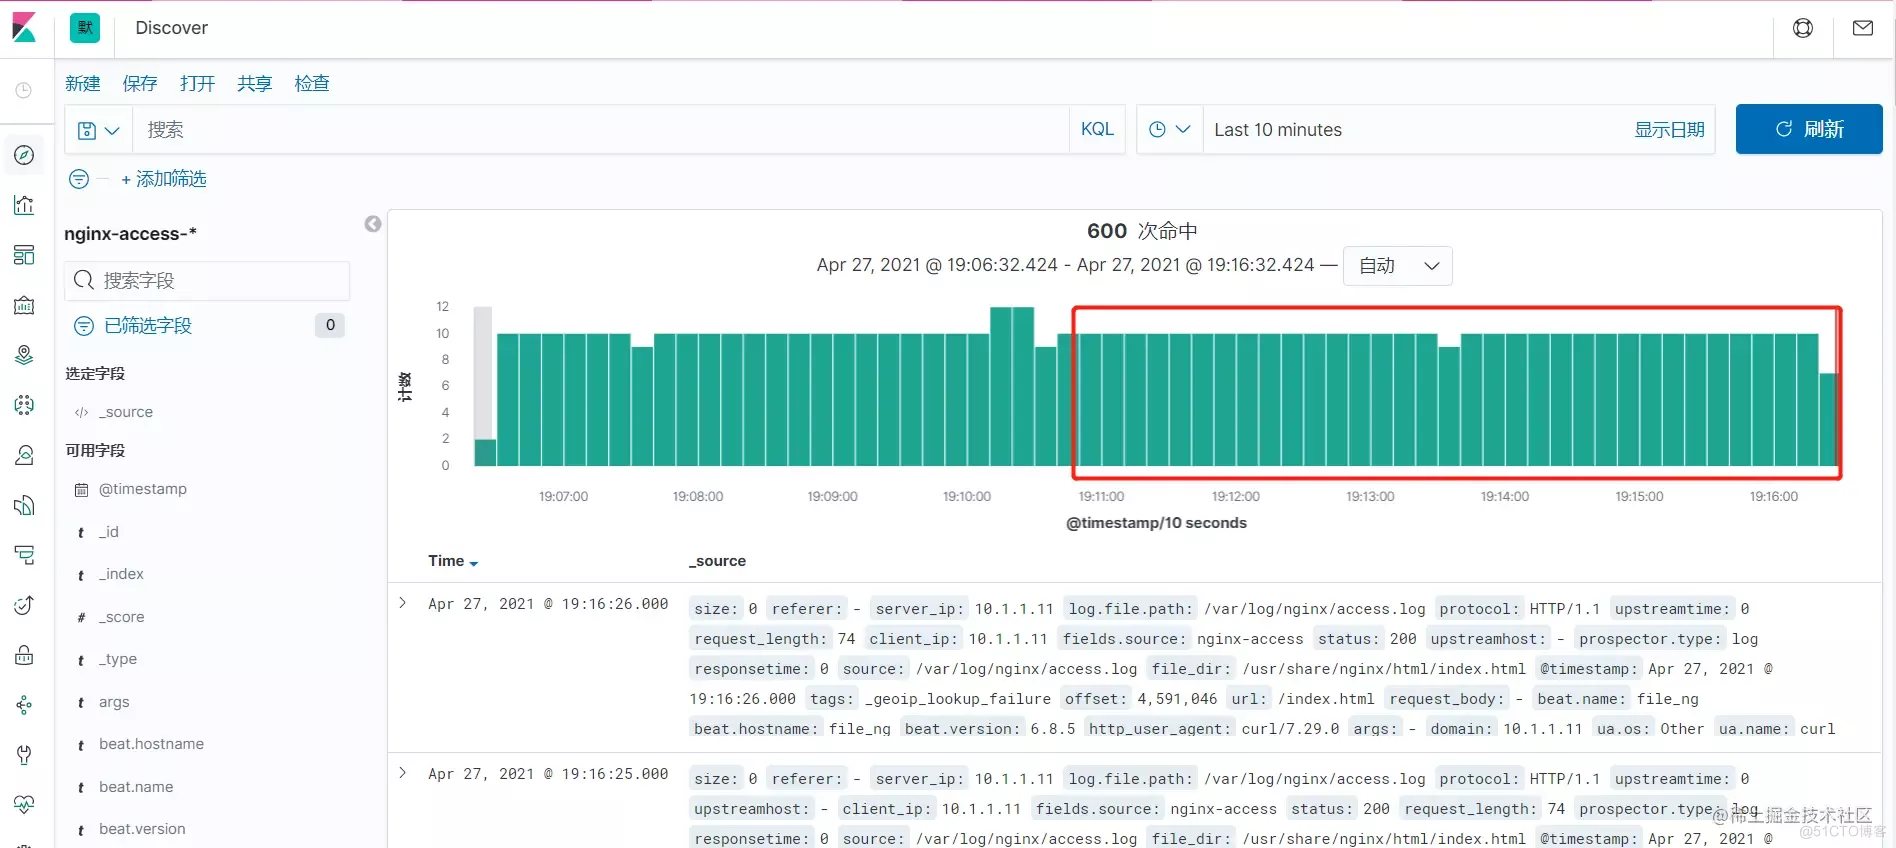
4.9 Analog fault
simulation LogStash fault

Wait a while , see Kibana journal , Find out Filebeat The collected logs are not stored in ES in , By Kibana Exhibition

Start again LogStash
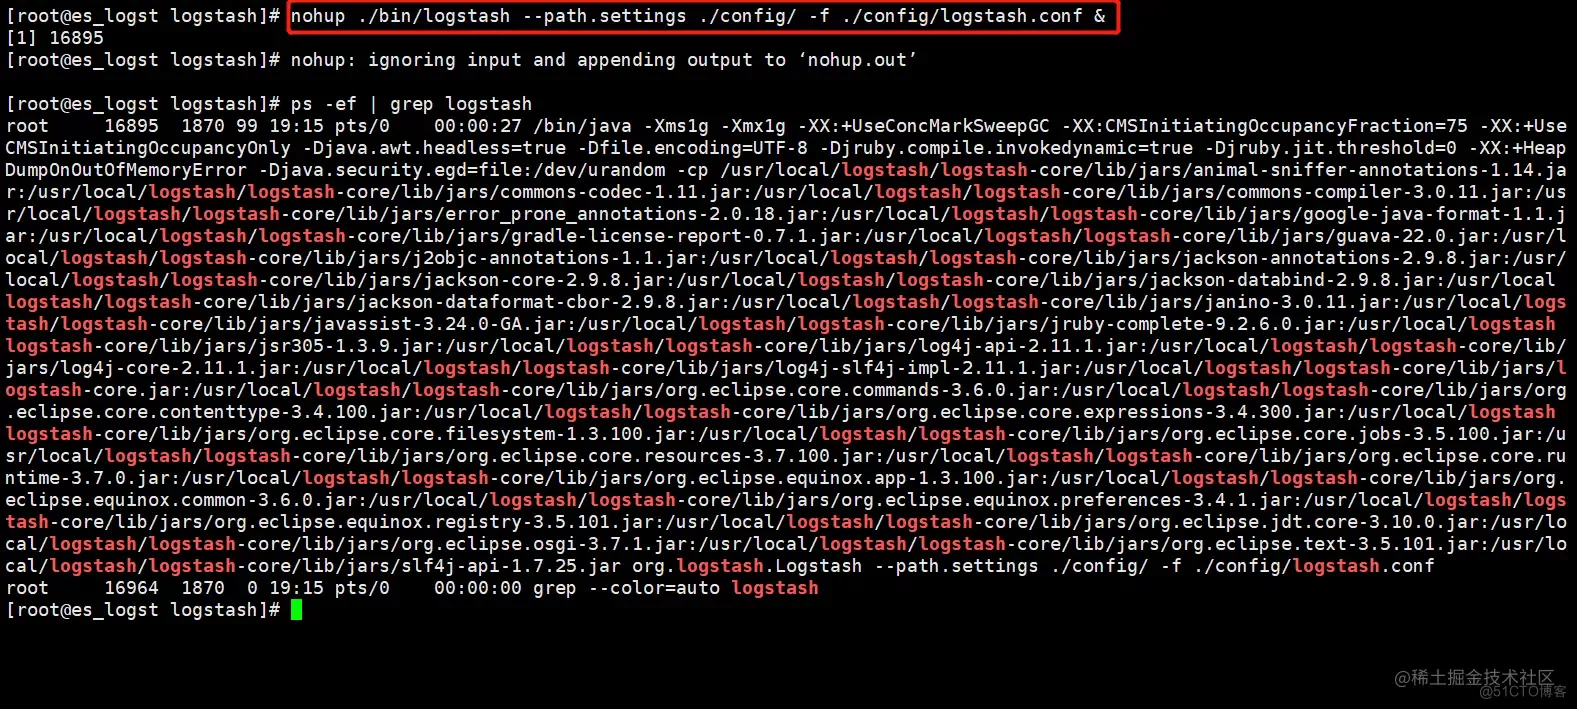
You can see ,LogStash During this time of failure , Whether the unreported log has been completed ,LogStash After normal operation , from Kafka Consume information that is not consumed , write in ES in ,Kibana All log information can be displayed normally , The problem of log loss caused by some component failures is avoided
5 Fault records
5.1 Kibana Boot failure
5.1.1 The fault phenomenon
5.1.2 Error log
       [[email protected]_gra log]# journalctl -u kibana


Apr 27 14:58:24 kibana_gra kibana[12671]: {"type":"log","@timestamp":"2021-04-27T06:58:24Z","tags":["warning","migrations"],"pid":12671,"message":"Another Kibana instance appears to be migrating the index. Waiting for that migration to complete. If no other Kibana instance is attempting migrations, you can get past this message by deleting index .kibana_2 and restarting Kibana."}
- 1.
- 2.
5.1.3 Solution
       [[email protected]_logst logstash]# curl -XDELETE http://localhost:9200/.kibana_2


{"acknowledged":true}
- 1.
- 2.
边栏推荐
- Principle analysis of three methods for exchanging two numbers
- Js: get the maximum zindex (Z-index) value of the page
- 理财产品长期是几年?新手最好买长期还是短期?
- 从类、API、框架三个层面学习如何设计可复用软件的学习心得
- Dataset之GermanCreditData:GermanCreditData数据集的简介、下载、使用方法之详细攻略
- Architecture design methods in technical practice
- 90%的人都不懂的泛型,泛型的缺陷和应用场景
- AAIG看全球6月刊(上)发布|AI人格真的觉醒了吗?NLP哪个细分方向最具社会价值?Get新观点新启发~
- Is it safe for flush to open an account online? What should we pay attention to
- How to use androd gradle module dependency replacement
猜你喜欢

在线文本过滤小于指定长度工具

Best practices for auto plug-ins and automatic batch processing in openvinotm 2022.1

You call this shit MQ?

Getting started with reverse debugging - learn about PE structure files

Go写文件的权限 WriteFile(filename, data, 0644)?

Quartus call & Design d Trigger - simulation & time sequence Wave Verification

20 years' Shanghai station D question Walker (two points, concise)

Generics, generic defects and application scenarios that 90% of people do not understand

64 channel telephone +2-channel Gigabit Ethernet 64 channel PCM telephone optical transceiver voice telephone to optical fiber

How to write vite plug-ins
随机推荐
美国的国家公园概览
RestCloud ETL解决shell脚本参数化
You call this shit MQ?
Hanyuan hi tech 8-way telephone +1-way 100M Ethernet RJ11 telephone optical transceiver 8-way PCM telephone optical transceiver
首次曝光!唯一全域最高等级背后的阿里云云原生安全全景图
4k-hdmi optical transceiver 1 channel [email protected] Hdmi2.0 optical transceiver HDMI HD video optical transceiver
20 years' Shanghai station D question Walker (two points, concise)
KDD 2022 | epileptic wave prediction based on hierarchical graph diffusion learning
在线文本实体抽取能力,助力应用解析海量文本数据
Yyds dry inventory solution sword finger offer: judge whether it is a balanced binary tree
Overview of national parks in the United States
The two 985 universities share the same president! School: true
【深入理解TcaplusDB技术】单据受理之事务执行
服务稳定性治理
quartus調用&設計D觸發器——仿真&時序波驗證
Online text entity extraction capability helps applications analyze massive text data
32-way telephone +2-way Gigabit Ethernet 32-way PCM telephone optical transceiver supports FXO port FXS voice telephone to optical fiber
R language dplyr package arrange function sorts dataframe data and sorts dataframe data through multiple data columns (ascending sort by default)
Gradle Build Cache引发的Task缓存编译问题怎么解决
Groovy map operation