当前位置:网站首页>Matplotlib(三)通过plt.subplots创建子绘图
Matplotlib(三)通过plt.subplots创建子绘图
2022-07-29 17:24:00 【我什么都布吉岛】
plt.subplots调用后将会产生一个图表(Figure)和默认网格(Grid),与此同时提供一个合理的控制策略布局子绘图。
一、只有子图的绘制
如果没有提供参数给subplots将会返回:
- Figure
- 一个Axes对象
例子:
fig, ax = plt.subplots()
ax.plot(x, y)
ax.set_title('A single plot')

二、单个方向堆叠子图
堆叠子图就需要用到额外的可选参数,分别是子图的行和列数,如果你只传递一个数字,默认列数为1,行堆叠。
比如:
fig, axs = plt.subplots(2)
fig.suptitle('Vertically stacked subplots')
axs[0].plot(x, y)
axs[1].plot(x, -y)

当然如果你的子图比较少,可以考虑用元组接收axes对象:
fig, (ax1, ax2) = plt.subplots(2)
fig.suptitle('Vertically stacked subplots')
ax1.plot(x, y)
ax2.plot(x, -y)
如果想要按照行排列,将参数改成(1,2)即可。
三、行列方向扩展子图
如果行列扩展子图,那么axes返回的则是一个二维Numpy数组。利用axe的flat属性,可以批量对轴进行赋值。
fig, axs = plt.subplots(2, 2)
axs[0, 0].plot(x, y)
axs[0, 0].set_title('Axis [0, 0]')# 等价于axes[0][0]
axs[0, 1].plot(x, y, 'tab:orange')
axs[0, 1].set_title('Axis [0, 1]')
axs[1, 0].plot(x, -y, 'tab:green')
axs[1, 0].set_title('Axis [1, 0]')
axs[1, 1].plot(x, -y, 'tab:red')
axs[1, 1].set_title('Axis [1, 1]')

for ax in axs.flat:
    ax.set(xlabel='x-label', ylabel='y-label')

# Hide x labels and tick labels for top plots and y ticks for right plots.
for ax in axs.flat:
    ax.label_outer()
当然你可以用单个轴对象接收:
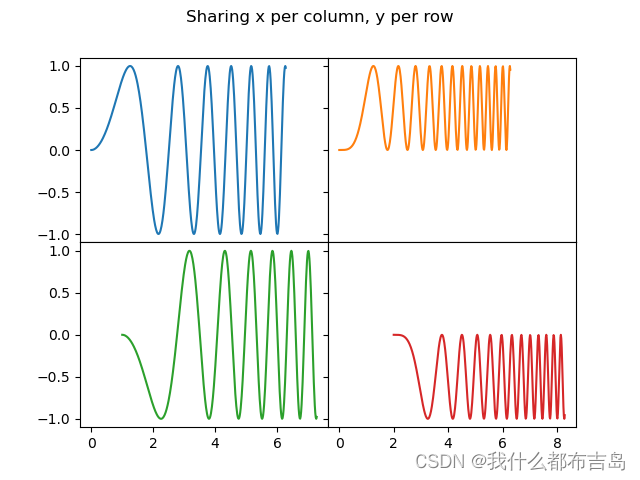
fig, ((ax1, ax2), (ax3, ax4)) = plt.subplots(2, 2)
fig.suptitle('Sharing x per column, y per row')
ax1.plot(x, y)
ax2.plot(x, y**2, 'tab:orange')
ax3.plot(x, -y, 'tab:green')
ax4.plot(x, -y**2, 'tab:red')

for ax in fig.get_axes():
    ax.label_outer()
四、共享轴
默认情况下,每个子图都是独立创建的。看下面这个例子:
fig, (ax1, ax2) = plt.subplots(2)
fig.suptitle('Axes values are scaled individually by default')
ax1.plot(x, y)
ax2.plot(x + 1, -y)

可以看出两者的横坐标刻度并不对齐,那么应该如何设置共享?答:在subplot创建之时使用sharex=True和sharedy=True分别创建X轴共享或者Y轴共享。
将上边的例子修改为以下:
fig, (ax1, ax2) = plt.subplots(2, sharex=True)
fig.suptitle('Aligning x-axis using sharex')
ax1.plot(x, y)
ax2.plot(x + 1, -y)
结果如下:
OK,看上去确实统一了坐标轴,除此,python帮你移除了多余的坐标刻度,上面中间的刻度被删除了。
如果你觉得中间的留白不太舒服的话,也有办法去除。方法是通过GridSpec对象,但是使用上就比较麻烦了,因为你需要自己创建一个figure并使用add_gridspec返回这个对象,然后再通过subplot进行接下来的操作。直接看例子吧:
fig = plt.figure()
gs = fig.add_gridspec(3, hspace=0)
axs = gs.subplots(sharex=True, sharey=True)
fig.suptitle('Sharing both axes')
axs[0].plot(x, y ** 2)
axs[1].plot(x, 0.3 * y, 'o')
axs[2].plot(x, y, '+')

# Hide x labels and tick labels for all but bottom plot.
for ax in axs:
    ax.label_outer()

这里还用到了轴的label_outer方法,这是用来隐藏非边界的坐标轴的。“share”在这里的意思是:共享一个坐标轴,也就意味着刻度的位置是对齐的。
请注意,修改sharex和sharey是全局修改的,所以你如果想让每一行和每一列共享一个坐标轴,可以考虑用sharex='col', sharey='row'。
fig = plt.figure()
gs = fig.add_gridspec(2, 2, hspace=0, wspace=0)
(ax1, ax2), (ax3, ax4) = gs.subplots(sharex='col', sharey='row')
fig.suptitle('Sharing x per column, y per row')
ax1.plot(x, y)
ax2.plot(x, y**2, 'tab:orange')
ax3.plot(x + 1, -y, 'tab:green')
ax4.plot(x + 2, -y**2, 'tab:red')

for ax in axs.flat:
    ax.label_outer()
如果你需要关联更加复杂的共享轴关系,可以创建出来使用axe的成员sharex、sharey进行设置:
fig, axs = plt.subplots(2, 2)
axs[0, 0].plot(x, y)
axs[0, 0].set_title("main")
axs[1, 0].plot(x, y**2)
axs[1, 0].set_title("shares x with main")
axs[1, 0].sharex(axs[0, 0])
axs[0, 1].plot(x + 1, y + 1)
axs[0, 1].set_title("unrelated")
axs[1, 1].plot(x + 2, y + 2)
axs[1, 1].set_title("also unrelated")
fig.tight_layout()# 让绘图更加紧凑

五、极坐标子图
fig, (ax1, ax2) = plt.subplots(1, 2, subplot_kw=dict(projection='polar'))
ax1.plot(x, y)
ax2.plot(x, y ** 2)
plt.show()

边栏推荐
- 手动SET返回PageInfo对象
- 【Mysql系列】01_查询+排序
- 「记录」MMDetection入门篇
- leetcode53 -- 最大数组和
- The service failure agent how to get things
- JupyterNotebook安装插件管理包过程中报错( AttributeError module ‘tornado.web‘ has no attribute ‘asynchronous‘ )
- lua-调试技巧
- 一个redis工具类解决缓存击穿,缓存穿透
- [Network] Routing Routing Policy
- Which is better, traditional render farm or cloud render farm?
猜你喜欢


随机推荐
针不戳!腾讯云架构师出品的《MySQL性能优化和高可用架构实践》
【南瓜书ML】(task5)支持向量机的数学推导(更新ing)
硬核!世界顶级级架构师编写2580页DDD领域驱动设计笔记,也太强了!
P4769 [NOI2018] Bubble Sort (Combinatorics)
使用LIMIT分页
三轮电摩专用之48V动力锂电池组-产品规格书
大佬们一个 sql 优化问题。我有个4千万的表。然后加了一个字段,只有10+条数据会给值,其他行数据
机器学习:知道模型评估中的SSE、“肘”部法、SC系数和CH系数的实现原理
Xatlas source code parsing (7)
[memory] grandma's song
最大化平均值
macro definition small method
Babbitt | Metaverse Daily Must Read: Seven consecutive quarters of losses, Meta Metaverse division Q2 loss of $ 2.8 billion, Zuckerberg said this situation may continue for years ...
Mathematical Analysis_Proof_Two Important Limits (Tongji Version)
[Code Hoof Set Novice Village 600 Questions] Given an integer n, find all the values of x and y in floor(n/x)=y
redis cluster 集群,终极方案?
浅析无人机发展趋势以及如何实现EasyDSS+无人机视频推流?
译文推荐 | 调试 BookKeeper 协议 - 无界 Ledger
「记录」MMDetection入门篇
js选择多张图片对比功能插件