当前位置:网站首页>About statistical power
About statistical power
2022-07-05 18:13:00 【Dreamer DBA】
The statistical power of a hypothesis test is the probability of detecting an effect, if there is a true effect present to detect. Power can be calculated and reported for a completed experiment to comment on the confidence one might have in the conclusions drawn from the results of the study.
- Statistical power is the probability of a hypothesis test of finding an effect if there is an effect to be found.
- A power analysis can be used to estimate the minimum sample size required for an experiment, given a desired significance level, effect size, and statistical power.
- How to calculate and plot power analysis for the Student’s t-test in Python in order to effectively design an experiment.
1.1 Tutorial Overview
This tutorial is divided into four parts; they are:
- Statistical Hypothesis Testing
- What Is Statistical Power?
- Power Analysis
- Student’s t-Test Power Analysis
1.2 Statistical Hypothesis Testing
A statistical hypothesis test makes an assumption about the outcome, called the null hypothesis( Null hypothesis ).
The Pearson’s correlation test is often interpreted using a p-value, which is the probability of observing the result given that the null hypothesis is true, not the reverse, as is often the case with misinterpretations.
p-value (p): Probability of obtaining a result equal to or more extreme than was observed in the data.
In interpreting the p-value of a significance test, you must specify a significance level, often referred to as the Greek lower case letter alpha (α). A common value for the significance level is 5% written as 0.05. The p-value is interested in the context of the chosen significance level. A result of a significance test is claimed to be statistically significant if the p-value is less than the significance level. This means that the null hypothesis (that there is no result) is rejected.
- p-value ≤ alpha: significant result, reject null hypothesis, distributions differ (H1).
- p-value > alpha: not significant result, fail to reject null hypothesis, distributions same (H0).
- Significance level (alpha): Boundary for specifying a statistically significant finding when interpreting the p-value.
Given the p-value, we could make an error in our interpretation. There are two types of errors; they are:
- Type I Error. Reject the null hypothesis when there is in fact no significant effect (false positive). The p-value is optimistically small.
- Type II Error. Not reject the null hypothesis when there is a significant effect (false negative). The p-value is pessimistically large.
1.3 What Is Statistical Power?
Statistical power, or the power of a hypothesis test is the probability that the test correctly rejects the null hypothesis. That is, the probability of a true positive result. It is only useful when the null hypothesis is rejected.
The higher the statistical power for a given experiment, the lower the probability of making a Type II (false negative) error. That is the higher the probability of detecting an effect when there is an effect. In fact, the power is precisely the inverse of the probability of a Type II error.
Power = 1 − Type II Error
Or
P r(True Positive) = 1 − P r(False Negative)
- Low Statistical Power: Large risk of committing Type II errors, e.g. a false negative.
- High Statistical Power: Small risk of committing Type II errors.
Experimental results with too low statistical power will lead to invalid conclusions about the meaning of the results. Therefore a minimum level of statistical power must be sought. It is common to design experiments with a statistical power of 80% or better, e.g. 0.80. This means a 20% probability of encountering a Type II area. This different to the 5% likelihood of encountering a Type I error for the standard value for the significance level.
1.4 Power Analysis
Statistical power is one piece in a puzzle that has four related parts; they are:
- Effect Size. The quantified magnitude of a result present in the population. Effect size is calculated using a specific statistical measure, such as Pearson’s correlation coefficient for the relationship between variables or Cohen’s d for the difference between groups.
- Sample Size. The number of observations in the sample.
- Significance. The significance level used in the statistical test, e.g. alpha. Often set to 5% or 0.05.
- Statistical Power. The probability of accepting the alternative hypothesis if it is true.
All four variables are related. For example, a larger sample size can make an effect easier to detect, and the statistical power can be increased in a test by increasing the significance level. A power analysis involves estimating one of these four parameters given values for three other parameters. This is a powerful tool in both the design and in the analysis of experiments that we wish to interpret using statistical hypothesis tests. For example, the statistical power can be estimated given an effect size, sample size and significance level. Alternately, the sample size can be estimated given different desired levels of significance.
As a practitioner, we can start with sensible defaults for some parameters, such as a significance level of 0.05 and a power level of 0.80. We can then estimate a desirable minimum effect size, specific to the experiment being performed. A power analysis can then be used to estimate the minimum sample size required. In addition, multiple power analyses can be performed to provide a curve of one parameter against another, such as the change in the size of an effect in an experiment given changes to the sample size. More elaborate plots can be created varying three of the parameters. This is a useful tool for experimental design.
1.5 Student's t-Test Power Analysis
We can make the idea of statistical power and power analysis concrete with a worked example. In this section, we will look at the Student’s t-test, which is a statistical hypothesis test for comparing the means from two samples of Gaussian variables. The assumption, or null hypothesis, of the test is that the sample populations have the same mean, e.g. that there is no difference between the samples or that the samples are drawn from the same underlying population. The test will calculate a p-value that can be interpreted as to whether the samples are the same (fail to reject the null hypothesis), or there is a statistically significant difference between the samples (reject the null hypothesis). A common significance level for interpreting the p-value is 5% or 0.05.
- Significance level (alpha): 5% or 0.05.
The size of the effect of comparing two groups can be quantified with an effect size measure. A common measure for comparing the difference in the mean from two groups is the Cohen’s d measure. It calculates a standard score that describes the difference in terms of the number of standard deviations that the means are different. A large effect size for Cohen’s d is 0.80 or higher, as is commonly accepted when using the measure.
- Effect Size: Cohen’s d of at least 0.80.
We can use the default and assume a minimum statistical power of 80% or 0.8.
- Statistical Power: 80% or 0.80
For a given experiment with these defaults, we may be interested in estimating a suitable sample size. That is, how many observations are required from each sample in order to at least detect an effect of 0.80 with an 80% chance of detecting the effect if it is true (20% of a Type II error) and a 5% chance of detecting an effect if there is no such effect (Type I error). We can solve this using a power analysis. The Statsmodels library provides the TTestIndPower class for calculating a power analysis for the Student’s t-test with independent samples. Of note is the TTestPower class that can perform the same analysis for the paired Student’s t-test. The function solve power() can be used to calculate one of the four parameters in a power analysis. In our case, we are interested in calculating the sample size. We can use the function by providing the three pieces of information we know (alpha, effect, and power) and setting the size of argument we wish to calculate the answer of (nobs1) to None. This tells the function what to calculate. A note on sample size: the function has an argument called ratio that is the ratio of the number of samples in one sample to the other. If both samples are expected to have the same number of observations, then the ratio is 1.0. If, for example, the second sample is expected to have half as many observations, then the ratio would be 0.5. The TTestIndPower instance must be created, then we can call the solve power() with our arguments to estimate the sample size for the experiment.
# estimate sample size via power analysis
from statsmodels.stats.power import TTestIndPower
# parameters for power analysis
effect = 0.8
alpha = 0.05
power = 0.8
# perform power analysis
analysis = TTestIndPower()
result = analysis.solve_power(effect,power=power,nobs1=None,ratio=1.0,alpha=alpha)
print('Sample Size: %.3f'% result)
Running the example calculates and prints the estimated number of samples for the experiment as 25. This would be a suggested minimum number of samples required to see an effect of the desired size.

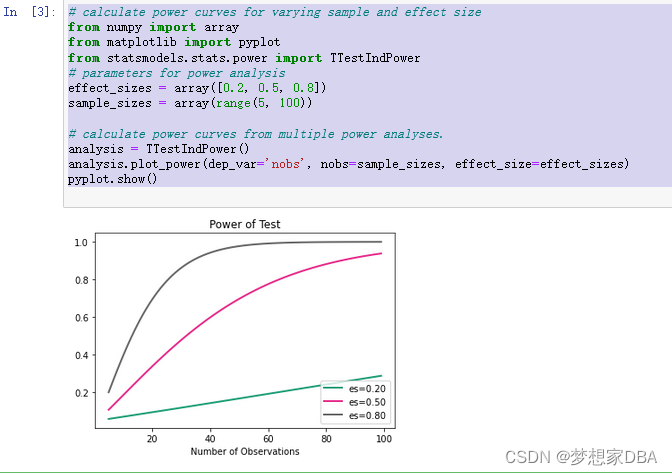
we can go one step further and calculate power curves.Power curves are line plots that show how the change in variables.such as effect size and sample size, impact the power of the statistical test.
The plot_power() function can be used to create power curves. The dependent variable (xaxis) must be specified by name in the dep_var argument. Arrays of values can then be specified for the sample size (nobs), effect size (effect size), and significance (alpha) parameters. One or multiple curves will then be plotted showing the impact on statistical power. For example, we can assume a significance of 0.05 (the default for the function) and explore the change in sample size between 5 and 100 with low, medium, and high effect sizes.
# calculate power curves for varying sample and effect size
from numpy import array
from matplotlib import pyplot
from statsmodels.stats.power import TTestIndPower
# parameters for power analysis
effect_sizes = array([0.2, 0.5, 0.8])
sample_sizes = array(range(5, 100))

# calculate power curves from multiple power analyses.
analysis = TTestIndPower()
analysis.plot_power(dep_var='nobs', nobs=sample_sizes, effect_size=effect_sizes)
pyplot.show()
Running the example create the plot showing the impact on statistical power(y-axis) for three different effect size (es) the sample size(x-axis) is increased. We can see that if we are interested in a large effect that a point of diminishing returns in terms of statistical power occurs at around 40-to-50 observations.
边栏推荐
- 第十一届中国云计算标准和应用大会 | 华云数据成为全国信标委云计算标准工作组云迁移专题组副组长单位副组长单位
- 图片数据不够?我做了一个免费的图像增强软件
- 彻底理解为什么网络 I/O 会被阻塞?
- 破解湖+仓混合架构顽疾,星环科技推出自主可控云原生湖仓一体平台
- node_exporter内存使用率不显示
- Simulate the hundred prisoner problem
- 分享:中兴 远航 30 pro root 解锁BL magisk ZTE 7532N 8040N 9041N 刷机 刷面具原厂刷机包 root方法下载
- 记一次使用Windbg分析内存“泄漏”的案例
- Memory management chapter of Kobayashi coding
- 通过SOCKS代理渗透整个内网
猜你喜欢

第十一届中国云计算标准和应用大会 | 华云数据成为全国信标委云计算标准工作组云迁移专题组副组长单位副组长单位
Find the first k small element select_ k
Can communication of nano
ConvMAE(2022-05)
Record a case of using WinDbg to analyze memory "leakage"

Nanjing University: Discussion on the training program of digital talents in the new era
![Maximum artificial island [how to make all nodes of a connected component record the total number of nodes? + number the connected component]](/img/8b/a60fc36115580f018445e4c2a28a9d.png)
Maximum artificial island [how to make all nodes of a connected component record the total number of nodes? + number the connected component]
![[JMeter] advanced writing method of JMeter script: all variables, parameters (parameters can be configured by Jenkins), functions, etc. in the interface automation script realize the complete business](/img/a6/aa0b8d30913dc64f3c0cd891528c40.png)
[JMeter] advanced writing method of JMeter script: all variables, parameters (parameters can be configured by Jenkins), functions, etc. in the interface automation script realize the complete business
《力扣刷题计划》复制带随机指针的链表

图扑软件数字孪生 | 基于 BIM 技术的可视化管理系统
随机推荐
写作写作写作写作
IDC report: Tencent cloud database ranks top 2 in the relational database market!
记一次使用Windbg分析内存“泄漏”的案例
开户注册股票炒股安全吗?有没有风险的?靠谱吗?
How to improve the thermal management in PCB design with the effective placement of thermal through holes?
Failed to virtualize table with JMeter
怎么选择外盘期货平台最正规安全?
彻底理解为什么网络 I/O 会被阻塞?
EasyCVR平台通过接口编辑通道出现报错“ID不能为空”,是什么原因?
使用QT遍历Json文档及搜索子对象
Image classification, just look at me!
Eliminate the writing of 'if () else{}'
Configure pytorch environment in Anaconda - win10 system (small white packet meeting)
Multithreading (I) processes and threads
Leetcode daily question: the first unique character in the string
[performance test] full link voltage test
寻找第k小元素 前k小元素 select_k
buuctf-pwn write-ups (9)
How can cluster deployment solve the needs of massive video access and large concurrency?
EasyCVR接入设备开启音频后,视频无法正常播放是什么原因?