当前位置:网站首页>Teach you how to draw a map with ArcGIS [thermal map]
Teach you how to draw a map with ArcGIS [thermal map]
2022-07-28 20:27:00 【Cute and strange】
Today, the senior brother of the laboratory taught us to use Arcgis drawing , After learning, write a blog to record it for fear of forgetting , In fact, I don't have a comprehensive and systematic understanding of this software now , This blog estimates that it is the first time to use help like me Arcgis Let's have a hand , As for some cool operations, they are not included , But if I get 了 , Be sure to blog again to share records ~ by the way , The version I used was Arcgis10.2
1. Import map data + Basic settings
file --> Add data --> Add data , Then add shp file

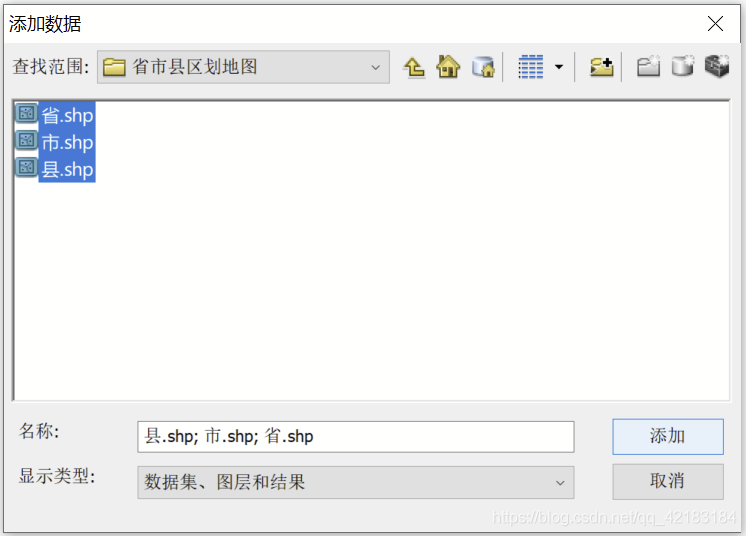
Then you can see the picture , I have added three shp file , Can be interpreted as ps There are three layers , These three layers are “ county ”、“ City ”、“ province ”.

Knowledge points are coming !! On the blackboard
- Check the box next to , You can choose this layer to display or hide .( Too simple , No demonstration )
- Each layer can be changed by dragging , Who is in the front , Just show who .( But be careful , I have to point out what I marked , That is, select in “ List in drawing order ” Only in this mode can you drag , Otherwise, it cannot be dragged .)

- You can display multiple layers by setting transparency
Right click the layer you want to set , choice “ attribute ”, stay “ Show ” Set transparency inside . In this way, you can see multiple layers at the same time !


- Set map provinces / City / County fill in the blank , Outline thickness 、 Color .
Click the color block of the corresponding layer , Enter the setting interface , Follow the prompts to set .

Then you can see the length of the figure after setting ~

2. Import numerical data + Basic settings
Next, import some numerical data , Draw a heat map , The data is different City To classify , It is divided into 11 class . Because I want to classify cities , So the fields in my data are [ City name s1-id, type ,...], The data is imported here , I hope sid This field can be associated with the city name of the map , In this way, you can automatically pair , Then make a picture ~
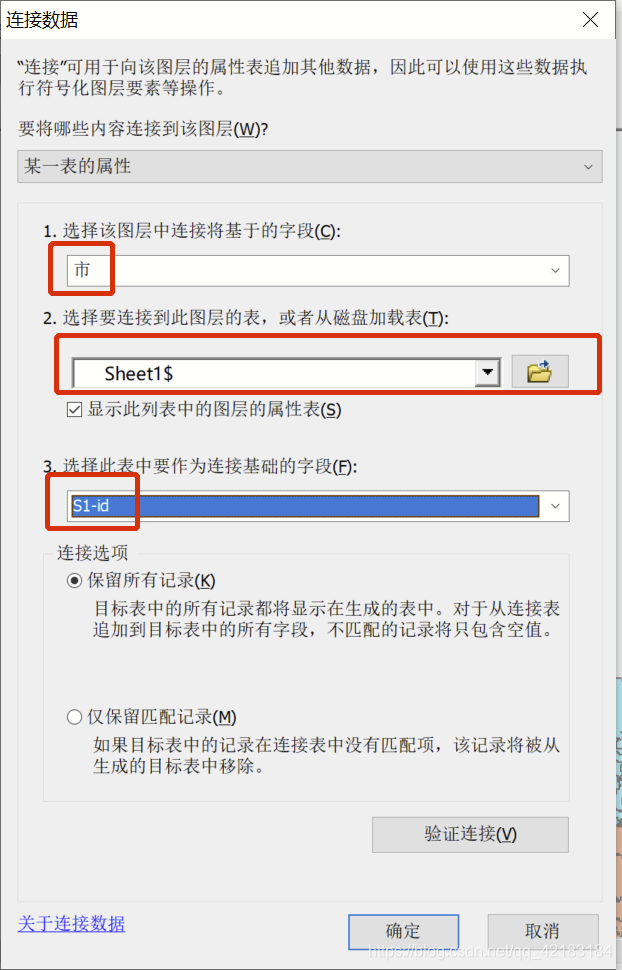
Because it is the classification of cities , So I chose “ City ” This layer , Right click , choice “ Connection and association ”-->“ Connect ”
- yes shp Fields in the file , Choose the city
- Is the data file to be connected , I'm here for a excel
- yes excel Inside the city column and shp The matching field in the city (s1-id The value of the field is Beijing , Chongqing City ... These city names )
After import , May exist .shp The city name in the file does not match the city name in the data table , As a result, it cannot be related , It needs to be modified at this time .shp The city name in the document , Unify the two !
( In fact, it is possible to change the city name in the data sheet , But elder martial brother said , If there are multiple data tables to draw, you need to change them many times , Change directly .shp Only change the file once , Be smart, hahaha )

After the data table is opened , Ascending order , You can immediately find the city that doesn't match .

There are two possible reasons for not matching .1. shp and excel The city names are inconsistent 2.excel There is no such city
Statistics are needed for the first kind , You cannot directly modify this table now , Need to open edit mode , Then you can modify the table directly

The watch is done , Then right click the city layer , choice “ attribute ”, Enter layer properties

The value here , It is the value of each city corresponding to the data table I imported , class , Just a few different colors . Click OK to draw the picture !

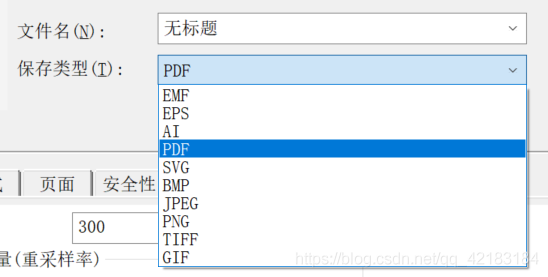
3. Derived data / picture
In this way, data is exported , You can continue editing next time

In this way, the exported image ,pdf And many other formats are available ~

TIPS: Just installed Arcgis The font of the toolbar is very small , I suggest you increase it . Right click first Arcgis The icon , choice “ attribute ”, Then operate as shown in the figure :

边栏推荐
- User, user group related operations
- Durham High Lord (classic DP)
- Common instructions of vim software
- Maximum exchange [greedy thought & monotonic stack implementation]
- 进制及数的表示 2
- NEIL: Extracting Visual Knowledge from Web Data
- C语言简单实例 1
- 2、 Relationship between software operation and memory
- [C language] 5000 word super detailed explanation of various operations of the sequence table
- lattice
猜你喜欢

Data mining (data preprocessing) -- Notes

树行表达方式
![[C language] guessing numbers game](/img/ac/81a82404618487861b67e35f18d13f.png)
[C language] guessing numbers game
![[C language] function](/img/81/c185e2bb5eccc13433483f9558f52a.png)
[C language] function

产品力大幅提升 新款福特探险者发布

Explain RESNET residual network in detail
![[C language] header file of complex number four operations and complex number operations](/img/f9/b389fe5367f1fa6cd18aaac856bc0d.png)
[C language] header file of complex number four operations and complex number operations

9. Pointer of C language (4) pointer and one-dimensional array, pointer operation

Leetcode-297 serialization and deserialization of binary tree

How to use pycharm to quickly create a flask project
随机推荐
How to automatically store email attachments in SharePoint
[C language] shutdown game [loop and switch statement]
Wildcard ssl/tls certificate
[C language] string reverse order implementation (recursion and iteration)
plt. What does it mean when linestyle, marker, color equals none in plot()
C language - data storage
Linxu 【基本指令】
Raspberry Pie 3 connected to WiFi
C语言简单实例 1
Communication learning static routing across regional networks
Reverse string
Tree row expression
Raspberrypico serial communication
【实验分享】CCIE—BGP反射器实验
Maximum exchange [greedy thought & monotonic stack implementation]
Regular symbol description
zfoo增加类似于mydog的路由
[C language] guessing numbers game [function]
树行表达方式
[C language] random number generation and `include < time. H > 'learning