当前位置:网站首页>[image detection] SAR image change detection based on depth difference and pcanet with matlab code
[image detection] SAR image change detection based on depth difference and pcanet with matlab code
2022-06-12 06:49:00 【Matlab scientific research studio】
1 brief introduction
DPPCANet It is a robust deep learning method , It is used to detect the change of unbalanced multi temporal SAR image , It mainly includes 1) Generate variance chart ;2) parallel FCM clustering , Provide training sample pseudo tags ;3) Based on sampling PCANet+SVM Models are constructed to classify oversampling and undersampling pixels .
2 Part of the code
% notice:% The training samples are randomly generated, so the results are slightly different% clear;% clc;% close all;addpath('./utils');addpath('./liblinear');pool_size = 3;w = 7;b = 0.16;T_num = 11;% Import Dataim1 = imread('./pic/B1.tif');im2 = imread('./pic/B2.tif');im_gt = imread('./pic/BGT.tif');im1 = double(im1(:,:,1));im2 = double(im2(:,:,1));im_gt = double(im_gt(:,:,1));% Compute the deep difference imagefprintf('... ... compute the deep difference image ... ...\n');im1 = WP(im1,pool_size);im2 = WP(im2,pool_size);DI_or = di_gen(im1,im2); % Calculate log-ratio imageDDI = Normalized(CWP(DI_or,T_num)); % Calculate deep different image[DDIMAP1,DDIMAP2]=DDIMAP(DI_or,T_num,w,b); % Computing mapped DDI% Gabor feature extractionfprintf('... ... Gabor feature extraction... ...\n');[f1_all,fea_1] = Gabor_fea(DDIMAP1);[f2_all,fea_2] = Gabor_fea(DDIMAP2);%Parallel FCM clusteringfprintf('... ... parallelclustering begin ... ...\n');im_lab = parallelclustering(fea_1,DDIMAP1,fea_2,DDIMAP2);% Clustering results are saved in im_lab% Changed pixels as 1% Unchanged pixels is marked as 0% Classification modelPatSize = 5; % PatSize must be oddim_lab = 1-im_lab;% PCANetPCANet_SVM_train;PCANet_SVM_test;[Ylen, Xlen] = size(im_gt);% DenoisingPreRes = reshape(PreRes, Ylen, Xlen);[lab_pre,num] = bwlabel(~PreRes);for i = 1:numidx = find(lab_pre==i);if numel(idx) <= 20lab_pre(idx)=0;endend%Save resultslab_pre = lab_pre>0;res = uint8(lab_pre)*255;pic = res;[TP,TN,FP,FN,MC,MU,FPR,FNR,OER,PCC,Kappa] = PE(res,im_gt);list = [TP,TN,FP,FN,MC,MU,FPR,FNR,OER,PCC,Kappa];imwrite(pic, 'changemap.png');save('result.mat','list');figureim1 = imread('./pic/B1.tif');im2 = imread('./pic/B2.tif');subplot(131);imshow(im1);title(' chart 1')subplot(132);imshow(im2);title(' chart 2')subplot(133);imshow(pic);title(' Detection diagram ')
3 Simulation results

4 reference
About bloggers : Good at intelligent optimization algorithms 、 Neural networks predict 、 signal processing 、 Cellular automata 、 The image processing 、 Path planning 、 UAV and other fields Matlab Simulation , relevant matlab Code problems can be exchanged by private letter .
Some theories cite network literature , If there is infringement, contact the blogger to delete .
边栏推荐
- Leetcode: Sword finger offer 66 Build product array [application of pre and post infix]
- PHP development environment construction and database addition, deletion, modification and query
- MySQL group query to obtain the latest data date function of each group
- Meituan won the first place in fewclue in the small sample learning list! Prompt learning+ self training practice
- 美团获得小样本学习榜单FewCLUE第一!Prompt Learning+自训练实战
- Codeforces Round #793 (Div. 2) A B C
- Whether the modification of basic type and reference type is valid
- LeetCode-1741. Find total time spent per employee
- Android studio uses database to realize login and registration interface function
- Set [list] to find out the subscript of repeated elements in the list (display the position of the subscript)
猜你喜欢

2021 robocom world robot developer competition - undergraduate group (Preliminary)

Detailed explanation of convirt paper (medical pictures)

leetcode:剑指 Offer 67. 把字符串转换成整数【模拟 + 分割 +讨论】
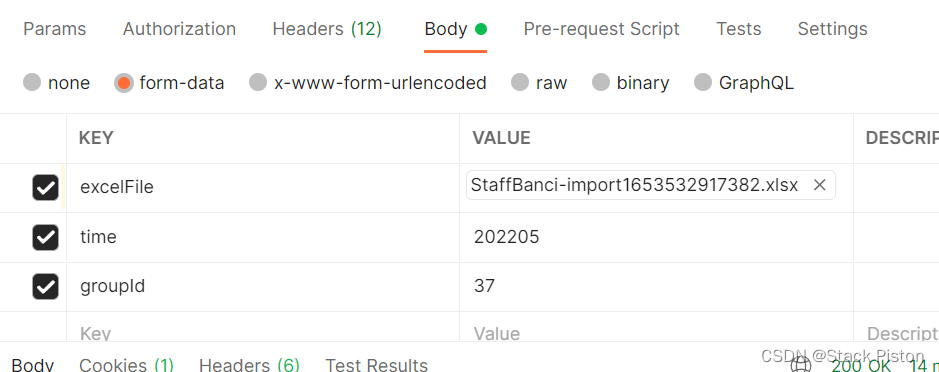
Upload file (post form submission form data)
![Leetcode: Sword finger offer 63 Maximum profit of stock [record prefix minimum and or no brain segment tree]](/img/3a/3bba4fc11469b4cf31c38e35a81ac1.png)
Leetcode: Sword finger offer 63 Maximum profit of stock [record prefix minimum and or no brain segment tree]

Leetcode January 13 daily question 747 At least twice the maximum number of other numbers

Drawing grid navigation by opencv map reading

Reentrantlock underlying AQS source code analysis
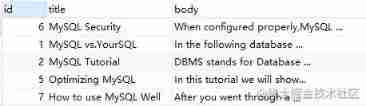
Are you still using like+% for MySQL fuzzy query?
"I was laid off by a big factory"
随机推荐
June 9th training day - bit operation
Torch models trained in higher versions report errors in lower versions
platform driver
The principle of SQL injection is to build sqli labs, and SQL injection is simple and practical
上传文件(post表单提交form-data)
Tomato learning notes -vscade configuring makefile (using task.jason and launch.jason)
June training day 6 - sliding window
Bid farewell to the charged xshell, and the free function of tabby is more powerful
Leetcode: Sword finger offer 67 Convert string to integer [simulation + segmentation + discussion]
LeetCode-1078. Bigram participle
8. form label
leetcode 35. Search insert location
ConVIRT论文详解(医疗图片)
Vscode Common plug - in
A journey of database full SQL analysis and audit system performance optimization
【数据聚类】本专栏中涉及数据集、可视化及注意事项
报表工具的二次革命
Leetcode January 13 daily question 747 At least twice the maximum number of other numbers
LeetCode-1154. Day of the year
PHP read / write cookie