当前位置:网站首页>Detailed explanation of top and free commands
Detailed explanation of top and free commands
2022-06-29 07:39:00 【Wangzewen 666】
top And free Detailed command
top command
In the O & M interview top Commands are asked more frequently than other commands , because top It is too important for the operation and maintenance personnel , It can not only be used to view process information 、CPU、 Memory 、 System status, etc . The operation and maintenance personnel can maintain the system accordingly .
// In this interface , Use P In order to CPU Use case to sort ;M To sort by memory usage ;N In order to PID To sort and display ;T It is displayed in the cumulative sorting of process usage time ;k To someone pid A signal , To kill the process ;r To someone pid Re customize one nice value ( That is what we often call priority );q Is used to exit top The interaction mode of
 // This is top Command output content , Some people will feel very confused , Actually top The command can view the content you want to view according to the parameters
| Parameters | effect |
|---|---|
| -d | Specify the time interval between every two screen information refreshes . |
| -p | By specifying the monitoring process ID To just monitor the status of a process . |
| -q | This option will make the top Refresh without any delay . |
| -S | Specify the cumulative mode |
| -s | send top The command runs in safe mode . This will remove the potential danger of interactive commands . |
| -i | send top Do not show any idle or zombie processes |
| -c | Show the entire command, not just the command name |
// When you are in top Interactive mode of press 1 It can monitor every logic of you CPU The state of 
// Press f You can enter this view , Press q You can exit this view 
// Press ”shift+>” perhaps ”shift+<” It can be done to "%CPU" Sort 
top The first line of the command
// The first line is task queue information 
- 21:50:47 Indicates the current system time
- up 6:26 It indicates how long the current system has been running , The format is , Hours : minute
- 2 users Indicates the number of users currently logged in to the system
- load average: 0.00, 0.00, 0.00 This represents the system load , That is, the average length of the task queue . All three values are 1 minute , The smaller the three values, the better , The system load is low in Yueming , higher than 5 It means that the system is heavily loaded .
top The second line of the command
// The second line represents the process information of the system 
- 208 total Represents the total number of processes in the current system
- 1 running Indicates the number of processes currently running in the system
- 207 sleeping Indicates the number of current system sleep processes
- 0 stopped Indicates the number of processes stopped by the current system
- 0 zombie Indicates the number of zombie processes in the current system
top The third line of the command
// The third line represents the system CPU Information about 
- 0.0 us Indicates the occupancy of user space CPU Percent of
- 0.2 sy Indicates the kernel space occupation CPU Percent of
- 0.0 ni It indicates that the priority of the process in the user process space has been changed CPU percentage
- 99.8 id I'm free CPU percentage
- 0.0 wa Waiting for input and output CPU Time percentage
- 0.0 hi Indicates hard interrupt occupancy CPU Percent of
- 0.0 si Indicates soft interrupt occupancy CPU Percent of
- 0.0 st For virtual CPU The situation of , Indicates that the virtual machine has stolen CPU Time
top The fourth line of the command
// The fourth line is the memory information of the system 
- 1800.6 total Represents the total amount of physical memory
- 1010.9 free Indicates the total amount of free memory
- 382.3 used Indicates the total amount of physical memory used
- 407.5 buff/cache Indicates the amount of memory used as the kernel cache
top The fifth line of the command
// The fifth line shows the information of the exchange partition of the system 
- 2092.0 total Indicates the total number of swap partitions
- 2092.0 free Indicates the total number of free swap areas
- 0.0 used Indicates the total number of swap partitions used
- 1255.4 avail Mem Represents the amount of physical memory that can be used for the next allocation of the process
top The sixth line of the command

- PID Represents the of the process id
- USER Which user owns the process
- PR Indicates priority
- NI nice Values are all our priorities , Negative values have high priority , Positive values have a lower priority than negative values
- VIRT Total virtual memory used by the process , Unit is kb,VIRT=SWAP( Swap partition )+RES
- RES Represents the 、 Physical memory size not swapped out , Unit is kb.RES=CODE+DATA
- CODE Represents the physical memory occupied by executable code , Unit is kb.
- SHR Indicates the size of the shared memory , The unit is also kb
- S Represents the state of the process .D= Uninterrupted sleep ;R= function ’;S= sleep ;T= track / stop it ;Z= Zombie process
- %CPU It represents the last update to the present CPU Percentage of time used
- %MEM Represents the percentage of physical memory used by the process
- TIME+ Represents the process used CPU Total time , Company 1/100 second
- COMMAND Indicates the command name / Command line
- WCHAN Indicates if the process is sleeping , The system function name in sleep is displayed
- nFLT Number of page errors
- nDRT Last write to now , Number of pages modified .
free command
// free The command is used to view the system memory , But in a static way top The orders are different .free Command is also one of the most frequently asked commands in the O & M interview
[[email protected] ~]# free
              total        used        free      shared  buff/cache   available
Mem:        1843864      390628     1035936        8888      417300     1286336
Swap:       2142204           0     2142204
- total Indicates the total amount of memory , Total physical memory
- used The amount of memory used
- free Represents the amount of free memory
- shared Total memory shared by multiple processes
- buff/cache Number of cache memory
// The relationship between the total amount of memory and the amount of used memory and free memory
total=used+free
There is another important point I don't have here, but I'll list it for you
-/+ buffers/cache
-buffers/cache: Is the amount of memory actually used
+buffers/cache: Amount of memory available .
-buffers/cache This is actually the memory actually used by the process or service ; and +buffers/cache Is the total amount of memory available .
| Parameters | effect |
|---|---|
| -b | Output to the screen in bytes |
| -k | With kb Output to the screen in the form of |
| -m | With mb Output to the screen in the form of |
| -g | With gibibytes Form output to the screen ( This gibibytes I don't understand ) |
| -h | Output to the screen in a human readable manner |
| -l | Display detailed low memory and high memory statistics ( The simple point is that the output content is more detailed ) |
| -t | Show total The sum of |
| -s | Output to the screen in seconds -s2, Output to the screen every two seconds |
| -c | How many times to print and then exit ,-c3, Is to print three times to the screen and then exit |
| -w | Interpreted as range output , Is to put buff/cache Output separately . |
| -V | see free Version information for , You can also use --version see |
Here I will not demonstrate the specific use , You can try it yourself , Believe in yourself .
边栏推荐
- 施努卡:3d机器视觉检测系统 3d视觉检测应用行业
- Kingbasees coping with transaction rollback caused by too fast growth of table age
- [qnx hypervisor 2.2 user manual]6.2.1 communication between guests
- 并发幂等性防抖
- Appium 环境搭建
- A hybrid model of machine learning notes time series
- 施努卡:3d视觉检测方案 3d视觉检测应用行业
- Markdown skill tree (9): tables
- 1183: patient queue
- Alternative writing of if else in a project
猜你喜欢
Schnuka: 3D visual inspection scheme 3D visual inspection application industry

【工控老马】PLC六路抢答器系统设计详解

【工控老马】洗衣机PLC程序控制系统设计详解
施努卡:什么是视觉定位系统 视觉定位系统的工作原理

感知健康生活 赋能无界连接 ——为OpenHarmony 3.1生态构建贡献芯海力量
1032 Sharing

Matlab Simulink simulation and analysis of power grid sweep frequency
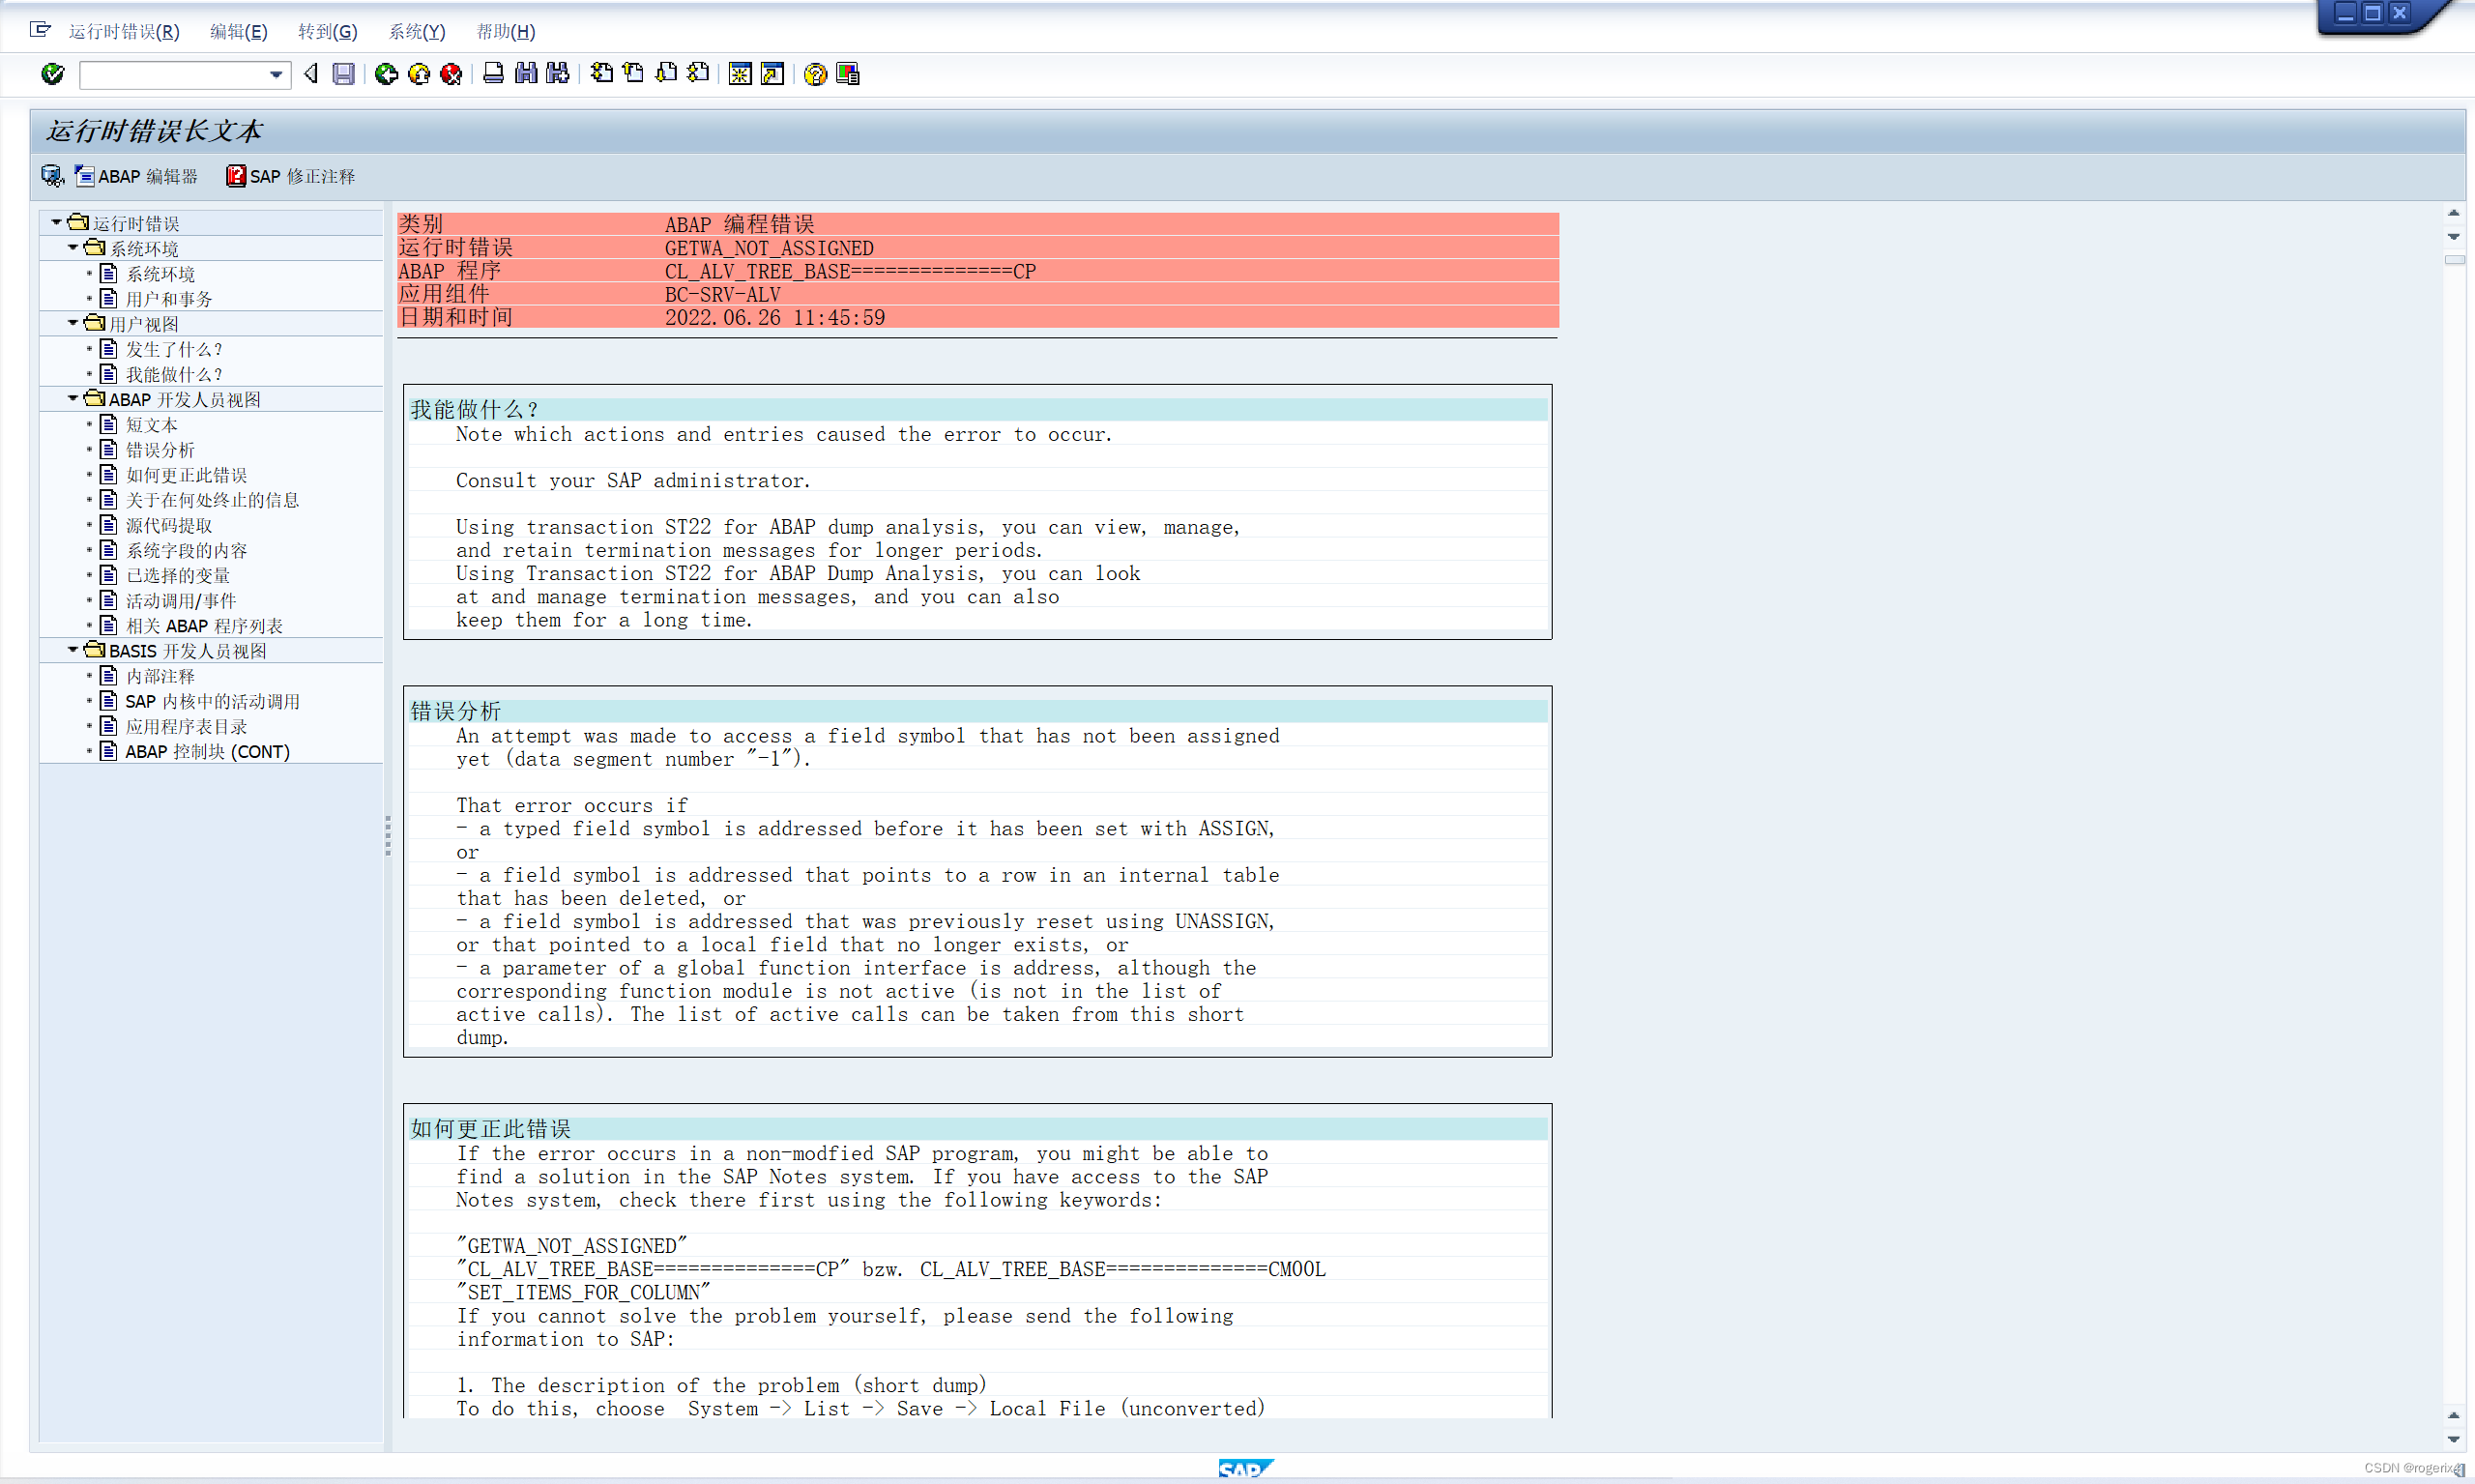
TREE ALV 展开Node或者点击Toolbar按钮时DUMP(CL_ALV_TREE_BASE==============CP|SET_ITEMS_FOR_COLUMN)

cv2.cvtColor

MFC中利用CDockablePane实现悬浮窗
随机推荐
SQL 注入绕过(六)
jmeter 用beanshell导入自己jar包老是查找不到
施努卡:3D视觉识别系统 3D视觉检测原理
[translation] E-Cloud. Large scale CDN using kubeedge
Autosar SWC在Simulink中Parameter的使用
Kingbasees v8r6 cluster maintenance case - data migration between clusters
Appium自动化测试基础 — ADB常用命令(三)
BeanPostProcessor 和 BeanFactoryPostProcessor
cv2.cvtColor
Deploy Prometheus server service system management
systemd 管理node-exporter
Golang modifying the value of a structure slice
帆船动力学仿真分析
Listen to textarea input through Keyup to change button style
1183: patient queue
Schnuka: 3D visual recognition system 3D visual inspection principle
【工控老马】单片机与西门子S7-200通信原理详解
循环嵌套问题:为什么大循环在内,小循环在外可以提高程序的运行效率
ShapeShifter: Robust Physical Adversarial Attack on Faster R-CNN Object Detector
关于工作方法和高效工作的建议