当前位置:网站首页>Matplotlib剑客行——布局指南与多图实现(更新)
Matplotlib剑客行——布局指南与多图实现(更新)
2022-07-02 06:33:00 【七归】
个性签名:整个建筑最重要的是地基,地基不稳,地动山摇。而学技术更要扎稳基础,关注我,带你稳扎每一板块邻域的基础。
博客主页:七归的博客
收录专栏:Python三剑客之江湖云
南来的北往的,走过路过千万别错过,错过本篇,“精彩”可能与您失之交臂yo
Triple attack(三连击):Comment,Like and Collect—>Attention
文章目录
布局指南
简单示例
在 Matplotlib 中,轴(包括子图)的位置在标准化图形坐标,你的轴标签或标题(有时甚至是刻度标签)超出图形区域,因此需要剪辑。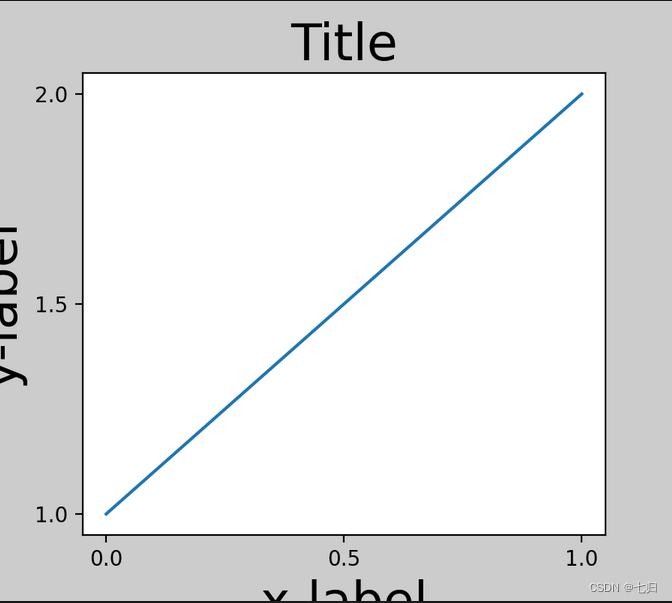
为了防止这种情况,需要调整轴的位置。
- 通过调整子图参数 Figure.subplots_adjust.来手动完成 但是,用 constrained_layout=True关键字参数将自动地进行调整。
- 这个 Figure.tight_layout是自动填充的
- tight_layout()还将调整子图间距以最小化重叠
- tight_layout()可以采用关键字参数 pad , w_pad 和 h_pad ,控制周围的额外填充图形边界和子图之间
fig, ax = plt.subplots(constrained_layout=True)
example_plot(ax, fontsize=24)
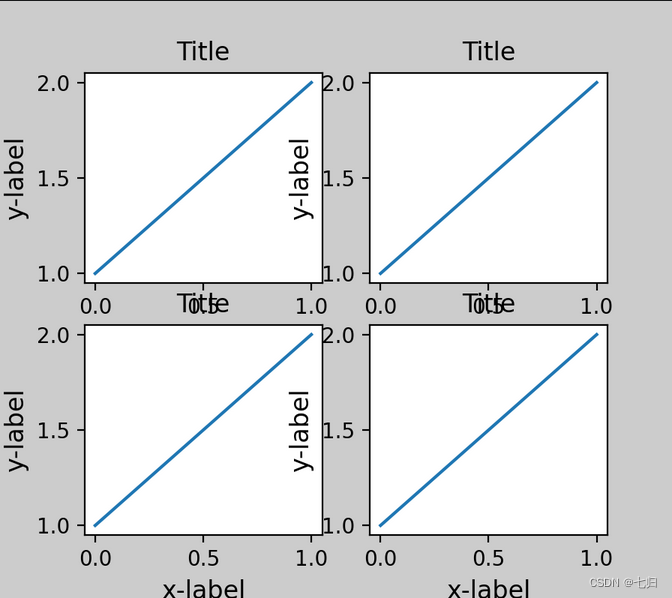
当你有多个子图时,你通常会看到不同的标签轴相互重叠
fig, axs = plt.subplots(2, 2, constrained_layout=False)
for ax in axs.flat:
    example_plot(ax)
- 输出图像:
- 在调用 plt.subplots 指定 constrained_layout=True,使布局得到适当的约束
- tight_layout 函数可以调整子图的相对大小使字符不会重叠
fig, axs = plt.subplots(2, 2, constrained_layout=True)
for ax in axs.flat:
    example_plot(ax)
- 输出图像:

字幕——标题
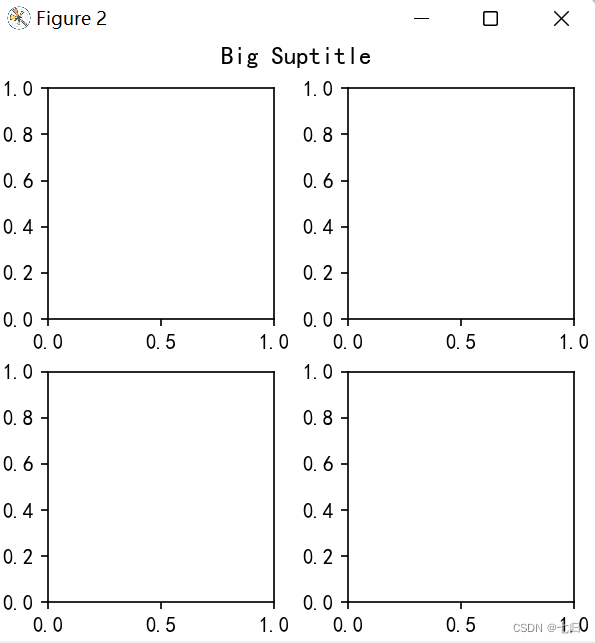
- constrained_layout也可以腾出空间来设置标题 suptitle.
fig, axs = plt.subplots(2, 2, figsize=(4, 4), constrained_layout=True)
fig.suptitle('Big Suptitle')
plt.show()
- 输出图像:
传说——图例
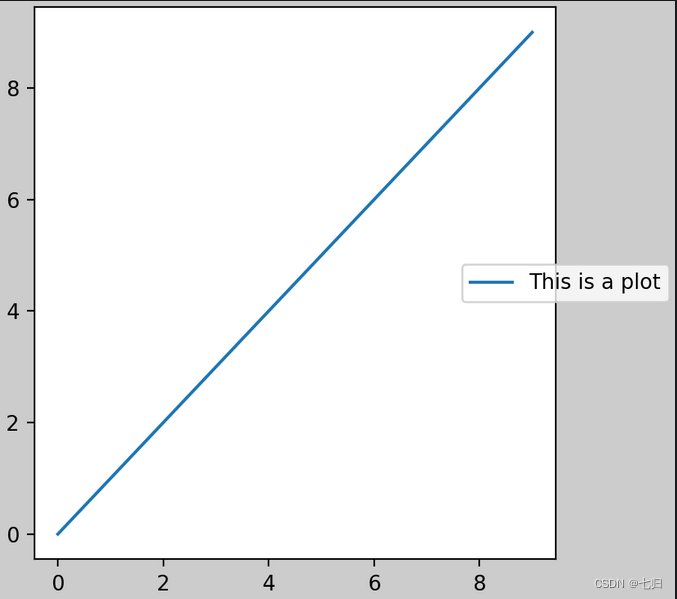
图例可以放置在其父轴之外。 约束布局旨在处理此问题 Axes.legend(). 但是,受约束的布局不处理通过创建的图例 Figure.legend().
fig, ax = plt.subplots(constrained_layout=True)
ax.plot(np.arange(10), label='This is a plot')
ax.legend(loc='center left', bbox_to_anchor=(0.8, 0.5))
- 输出图像:
但是,有多个子图时这将会压缩子图布局的空间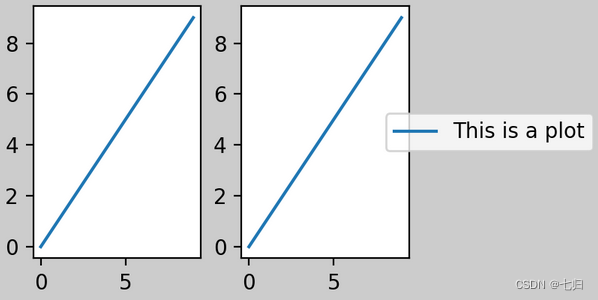
解决这种尴尬的更好方法是简单地使用提供的图例方法 Figure.legend: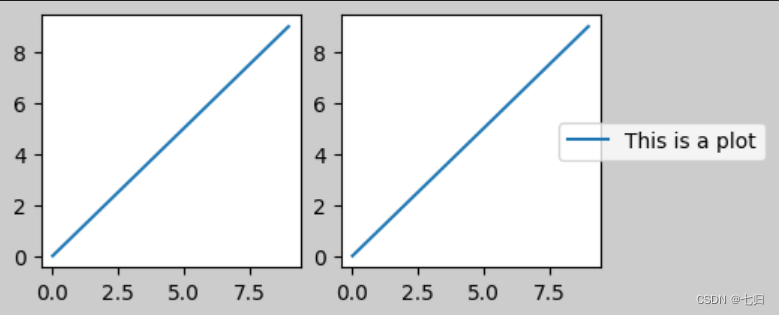
填充与间距
- 轴之间的填充,水平由 w_pad 和 wspace 和垂直由 h_pad 和 hspace
- 这些可以通过 set_constrained_layout_pads( w/h_pad, w/hspace) 编辑
- 子图之间的间距由 wspace 和 hspace 设置
- 也可以通过 plt.subplots_adjust(wspace=0,hspace=0)设定
- wspace,hspace:用于控制宽度和高度的百分比,比如subplot之间的间距
多图实现
多图——plt.subplots
subplots参数
plt.subplots(nrows, ncols, index, sharex, sharey)
- nrows子图的行数
- ncols子图的列数
- index 取子图的索引
- sharex 所有子图使用相同的x轴刻度
- sharey 所有子图使用相同的y轴刻度
- sharex,sharey:是否共享x,y刻度
- figsize 参数可以指定整个画布的大小
当我们调用plot时,如果设置plt.figure(),则会自动调用figure()生成一个figure, 严格的讲,是生成subplots(111)
先创建图表figure,然后生成子图,(2,2,1)代表创建2*2的矩阵表格,然后选择第一个,顺序是从左到右从上到下
在调用subplot时一般需要传入三位数字,分别代表总行数,总列数,当前子图的index
2*2 四个子图 index:1 选择了其中第一个子图
ax1 = plt.subplot(221)
ax2 = plt.subplot(222)
ax3 = plt.subplot(223)
ax4 = plt.subplot(224) 当三位数都小于10时,可以省略中间的逗号,这行命令等价于plt.subplot(2,2,4)
超出,则会报错
plt.subplot(225)
两种实现方式
OO风格
import matplotlib.pyplot as plt
x = ["深圳", "广州", "北京", "上海"]
y = [1, 3, 2, 5]
fig, axs = plt.subplots(2, 2)
# 下标[nrows][ncols]
# 第一张子图
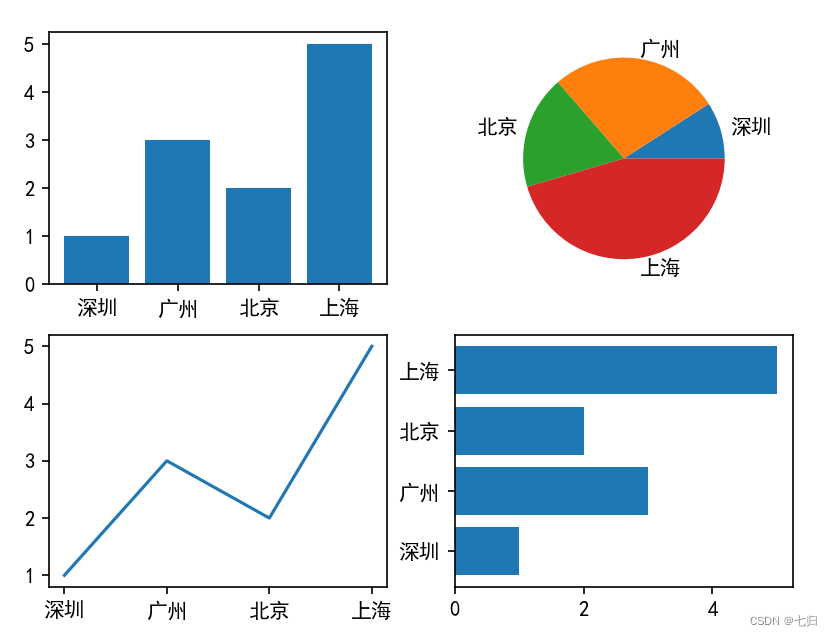
axs[0][0].bar(x, y)
# 第二张子图
axs[0][1].pie(y, labels=x)
# 第三张子图
axs[1][0].plot(x, y)
# 第四张子图
axs[1][1].barh(x, y)
plt.show()
- 输出图像:
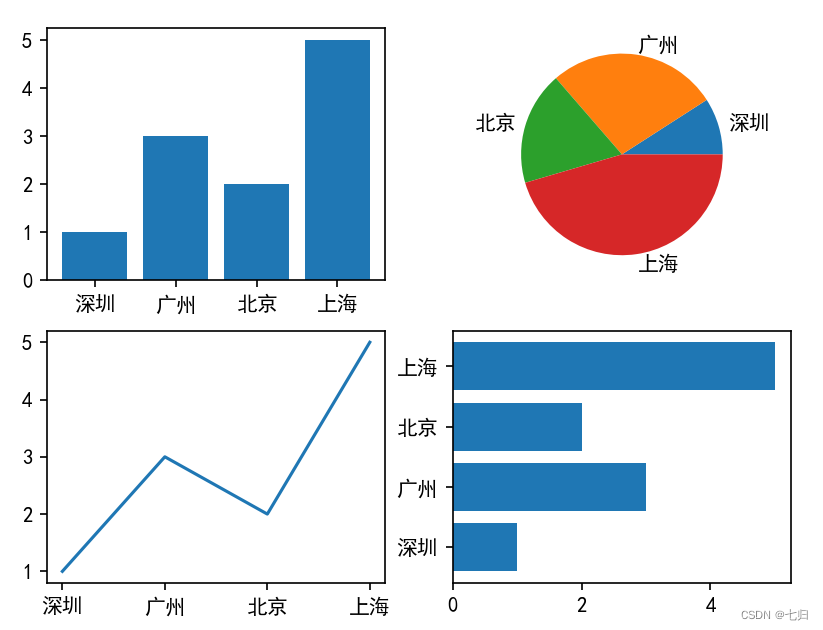
plplot风格
import matplotlib.pyplot as plt

plt.rcParams['font.sans-serif'] = 'Microsoft YaHei'
x = ["深圳", "广州", "北京", "上海"]
y = [1, 3, 2, 5]

# 第一张子图
plt.subplot(2, 2, 1)
plt.bar(x, y)
# 第二张子图
plt.subplot(2, 2, 2)
plt.pie(y, labels=x)
# 第三张子图
plt.subplot(2, 2, 3)
plt.plot(x, y)
# 第四张子图
plt.subplot(2, 2, 4)
plt.barh(x, y)
plt.show()
- 输出图像:
多合一显示——plt.subplot
均匀图中图
- 使用plt.figure创建一个图像窗口.使用plt.subplot来创建小图
- plt.subplot(2,2,1)表示将整个图像窗口分为2行2列, 当前位置为1. 使用plt.plot([0,1],[0,1])在第1个位置创建一个小图。
- plt.subplot(2,2,2)表示将整个图像窗口分为2行2列, 当前位置为2。使用plt.plot([0,1],[0,2])在第2个位置创建一个小图。
- plt.subplot(2,2,3)表示将整个图像窗口分为2行2列,当前位置为3。 plt.subplot(2,2,3)可以简写成plt.subplot(223)。使用plt.plot([0,1],[0,3])在第3个位置创建一个小图。
- plt.subplot(224)表示将整个图像窗口分为2行2列, 当前位置为4。使用plt.plot([0,1],[0,4])在第4个位置创建一个小图。
plt.figure()

plt.subplot(2,2,1)
plt.plot([0,1],[0,1])

plt.subplot(2,2,2)
plt.plot([0,1],[0,2])

plt.subplot(223)
plt.plot([0,1],[0,3])

plt.subplot(224)
plt.plot([0,1],[0,4])
不均匀图中图
- 使用plt.subplot(2,1,1)将整个图像窗口分为2行1列, 当前位置为1。使用plt.plot([0,1],[0,1])在第1个位置创建一个小图。
- 使用plt.subplot(2,3,4)将整个图像窗口分为2行3列, 当前位置为4。使用plt.plot([0,1],[0,2])在第4个位置创建一个小图。
- 上一步中使用plt.subplot(2,1,1)将整个图像窗口分为2行1列, 第1个小图占用了第1个位置, 也就是整个第1行。
- 这一步中使用plt.subplot(2,3,4)将整个图像窗口分为2行3列, 于是整个图像窗口的第1行就变成了3列, 也就是成了3个位置, 于是第2行的第1个位置是整个图像窗口的第4个位置。
plt.subplot(2,1,1)
plt.plot([0,1],[0,1])

plt.subplot(2,3,4)
plt.plot([0,1],[0,2])
- 以此类推,依次创建第5、6位置上的子图
plt.subplot(235)
plt.plot([0,1],[0,3])

plt.subplot(236)
plt.plot([0,1],[0,4])
不均匀子图——add_gridspec
区域切割
- 使用 GridSpec 绘制非均匀子图
- 利用 add_gridspec 可以指定相对宽度比例 width_ratios 和相对高度比例参数 height_ratios
spec = fig.add_gridspec(nrows=2, ncols=2, width_ratios=[1,3],height_ratios=[1,2])
表示将整个画布裁剪为2 行2列的区域,width_ratios=[1, 3]表示横向将两列的宽度按照1:3进行裁剪,同理height_ratios=[1,2]表示纵向按照1:2进行裁剪
x = ["深圳", "广州", "北京", "上海"]
y = [1, 3, 2, 5]
fig = plt.figure(figsize=(10, 8))

spec = fig.add_gridspec(nrows=2, ncols=2, width_ratios=[1, 3], height_ratios=[1, 2])
ax = fig.add_subplot(spec[0, 0])
ax.bar(x, y)

ax = fig.add_subplot(spec[0, 1])
ax.plot(x, y)

ax = fig.add_subplot(spec[1, 0])
ax.pie(y, labels=x)

ax = fig.add_subplot(spec[1, 1])
ax.barh(x, y)
plt.show()
- 输出图像:

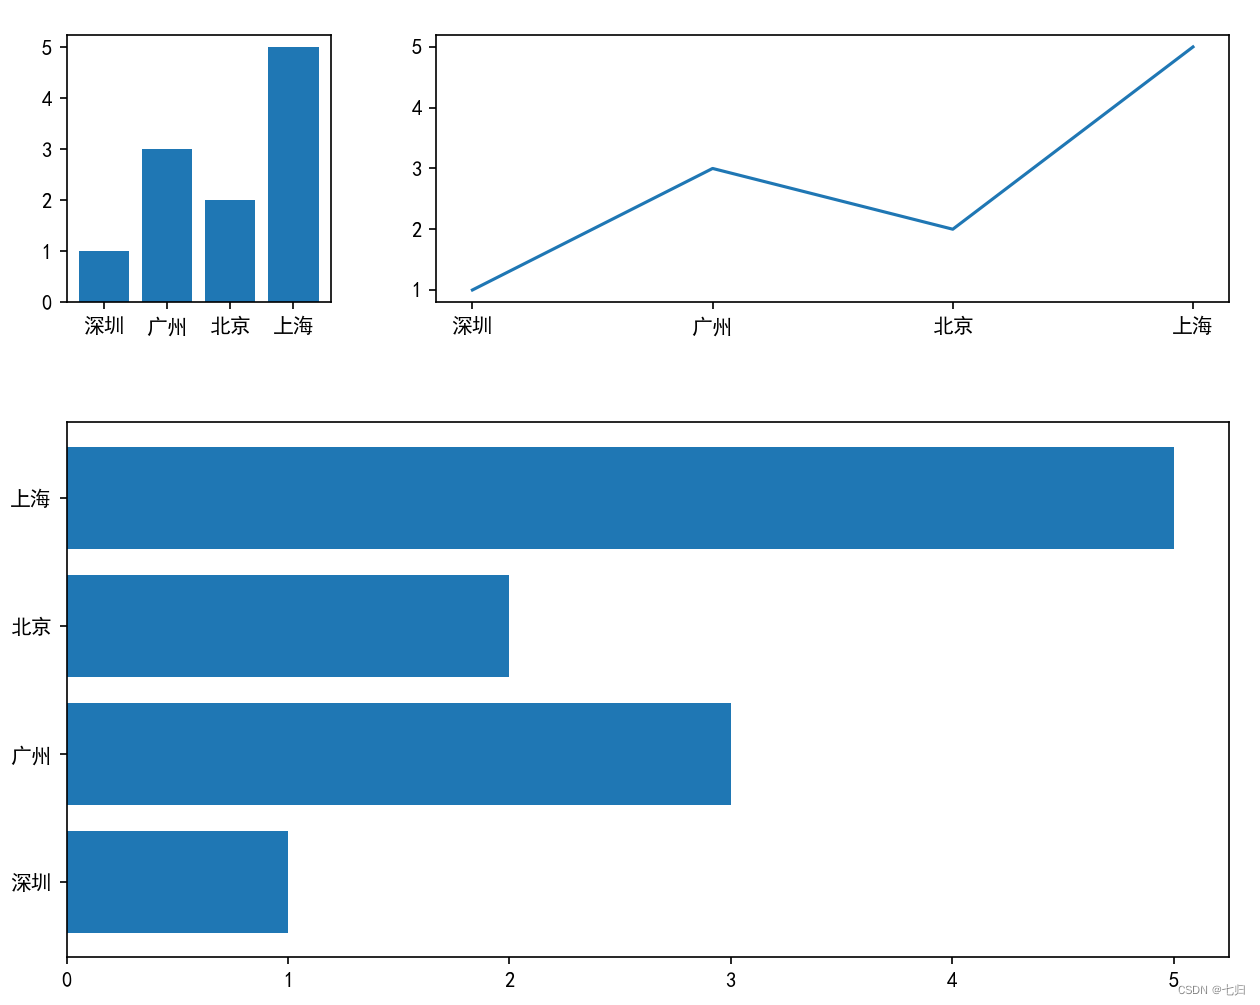
- spec还支持切片的方式,譬如我们将第二行展示为整个条形图
x = ["深圳", "广州", "北京", "上海"]
y = [1, 3, 2, 5]
fig = plt.figure(figsize=(10, 8))

spec = fig.add_gridspec(nrows=2, ncols=2, width_ratios=[1, 3], height_ratios=[1, 2])
ax = fig.add_subplot(spec[0, 0])
ax.bar(x, y)

ax = fig.add_subplot(spec[0, 1])
ax.plot(x, y)

# 第二行整块区域显示条形图
ax = fig.add_subplot(spec[1, :])
ax.barh(x, y)

# 调整各区域之间的距离
plt.subplots_adjust(hspace=0.3, wspace=0.2)
plt.show()
- 输出图像:
添加元素
- ax子图同样可以通过set_title、set_xlable等方法添加子图标题,坐标轴标题等
- 如果需要添加大标题可以通过fig.suptitle()来完成。
边栏推荐
- [staff] common symbols of staff (Hualian clef | treble clef | bass clef | rest | bar line)
- win10使用docker拉取redis镜像报错read-only file system: unknown
- [staff] the lines and spaces of the staff (the nth line and the nth space in the staff | the plus N line and the plus N space on the staff | the plus N line and the plus N space below the staff | the
- gocv拆分颜色通道
- C4D quick start tutorial - C4d mapping
- Talk about the secret of high performance of message queue -- zero copy technology
- 《统计学习方法》——第五章、决策树模型与学习(上)
- Minecraft air Island service
- 十年开发经验的程序员告诉你,你还缺少哪些核心竞争力?
- 1、 QT's core class QObject
猜你喜欢

Web技术发展史
![[staff] the lines and spaces of the staff (the nth line and the nth space in the staff | the plus N line and the plus N space on the staff | the plus N line and the plus N space below the staff | the](/img/dc/c0ea188ef353ded86759dbe9b29df3.jpg)
[staff] the lines and spaces of the staff (the nth line and the nth space in the staff | the plus N line and the plus N space on the staff | the plus N line and the plus N space below the staff | the

聊聊消息队列高性能的秘密——零拷贝技术

Cloud computing in my eyes - PAAS (platform as a service)
![[staff] time mark and note duration (staff time mark | full note rest | half note rest | quarter note rest | eighth note rest | sixteenth note rest | thirty second note rest)](/img/7f/2cd789339237b7a881bfed7b7545a9.jpg)
[staff] time mark and note duration (staff time mark | full note rest | half note rest | quarter note rest | eighth note rest | sixteenth note rest | thirty second note rest)

【Go实战基础】gin 如何自定义和使用一个中间件
Matplotlib剑客行——没有工具用代码也能画图的造型师

Redis zadd导致的一次线上问题排查和处理
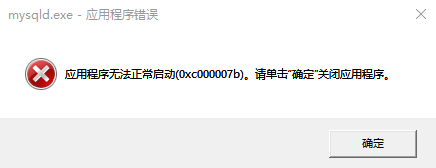
During MySQL installation, mysqld Exe reports that the application cannot start normally (0xc000007b)`

Service de groupe minecraft
随机推荐
Move a string of numbers backward in sequence
2022/2/14 summary
[staff] the lines and spaces of the staff (the nth line and the nth space in the staff | the plus N line and the plus N space on the staff | the plus N line and the plus N space below the staff | the
Minecraft group service opening
Minecraft air Island service
MYSQL安装出现问题(The service already exists)
C Gaode map obtains the address according to longitude and latitude
Cloud computing in my eyes - PAAS (platform as a service)
win10使用docker拉取redis镜像报错read-only file system: unknown
oracle修改数据库字符集
commands out of sync. did you run multiple statements at once
Minecraft安装资源包
Leetcode sword finger offer brush questions - day 22
Tensorflow2 keras 分类模型
Count the number of various characters in the string
Linux安装Oracle Database 19c RAC
C language implementation of mine sweeping game
Essay: RGB image color separation (with code)
C# 百度地图,高德地图,Google地图(GPS) 经纬度转换
cmd窗口中中文呈现乱码解决方法