当前位置:网站首页>Zabbix_原理架构-安装部署-自定义监控
Zabbix_原理架构-安装部署-自定义监控
2022-06-10 19:01:00 【这个手刹不太灵儿】
原理架构

zabbix是一个c/s架构的软件。
其中,服务器端有一个zabbix server,客户端有一个zabbix agent。server采集到agent的数据放到数据库中(mariadb或mysql)。
web访问的时候,server端还需要安装一个Apache Php(软件包的名字叫httpd,软件名叫apache)
安装步骤
1、安装zabbix相关的软件
安装zabbix服务器的源
[[email protected] ~]# rpm -Uvh https://repo.zabbix.com/zabbix/5.0/rhel/7/x86_64/zabbix-release-5.0-1.el7.noarch.rpm

# CentOS-Base.repo 仓库文件: 用来找到centos官方提供的下载软件的地方的文件 --》藏宝图
# Base 存放centos官方基本软件的仓库
# zabbix.repo 帮助我们找到zabbix官方提供的软件下载地方的文件 --》zabbix臧宝图
上传zabbix相关rpm软件包,安装zabbix相关软件
[[email protected] ~]# cd centos7-zabbix/
[[email protected] centos7-zabbix]# ll
总用量 9124
-rw-r--r-- 1 root root  438076 6月   4 18:46 zabbix-agent-4.4.6-1.el7.x86_64.rpm
-rw-r--r-- 1 root root  307352 6月   4 18:46 zabbix-get-4.4.6-1.el7.x86_64.rpm
-rw-r--r-- 1 root root  795468 6月   4 18:46 zabbix-java-gateway-4.4.6-1.el7.x86_64.rpm
-rw-r--r-- 1 root root  491504 6月   4 18:46 zabbix-js-4.4.6-1.el7.x86_64.rpm
-rw-r--r-- 1 root root  233364 6月   4 18:46 zabbix-nginx-conf-4.4.6-1.el7.noarch.rpm
-rw-r--r-- 1 root root 1011328 6月   4 18:46 zabbix-proxy-mysql-4.4.6-1.el7.x86_64.rpm
-rw-r--r-- 1 root root   14084 6月   4 18:46 zabbix-release-4.4-1.el7.noarch.rpm
-rw-r--r-- 1 root root  338868 6月   4 18:46 zabbix-sender-4.4.6-1.el7.x86_64.rpm
-rw-r--r-- 1 root root 2599260 6月   4 18:46 zabbix-server-mysql-4.4.6-1.el7.x86_64.rpm
-rw-r--r-- 1 root root 3076048 6月   4 18:46 zabbix-web-4.4.6-1.el7.noarch.rpm
-rw-r--r-- 1 root root   11456 6月   4 18:46 zabbix-web-japanese-4.4.6-1.el7.noarch.rpm
-rw-r--r-- 1 root root   10976 6月   4 18:46 zabbix-web-mysql-4.4.6-1.el7.noarch.rpm
[[email protected] centos7-zabbix]# yum install zabbix* -y
2、安装mariadb数据库
安装启动mariadb
[[email protected] ~]# yum install maridb mariadb-server -y
# maridb 客户端
# mariadb-server 服务端
[[email protected] ~]# service mariadb start # 启动mariadb
Redirecting to /bin/systemctl start mariadb.service
[[email protected] ~]# systemctl enable mariadb # 设置开机自启
Created symlink from /etc/systemd/system/multi-user.target.wants/mariadb.service to /usr/lib/systemd/system/mariadb.service.
[[email protected] ~]# mysql -uroot -p # 直接登录,无密码
Enter password:
Welcome to the MariaDB monitor.  Commands end with ; or \g.
Your MariaDB connection id is 2
Server version: 5.5.68-MariaDB MariaDB Server

Copyright (c) 2000, 2018, Oracle, MariaDB Corporation Ab and others.

Type 'help;' or '\h' for help. Type '\c' to clear the current input statement.

MariaDB [(none)]>
新建zabbix库
#指定字符集和校对规则
MariaDB [(none)]> create database zabbix character set utf8 collate utf8_bin;
Query OK, 1 row affected (0.00 sec)
授权zabbix这个用户可以进入mariadb
MariaDB [(none)]>  create user 'zabbix'@'localhost' identified by 'zabbix123';
Query OK, 0 rows affected (0.00 sec)

MariaDB [(none)]> grant all privileges on zabbix.* to 'zabbix'@'localhost';
Query OK, 0 rows affected (0.00 sec)
导入zabbix的表到mariadb的zabbix数据库里面
# 这个表是zabbix系统提供的
[[email protected] zabbix-server-mysql-4.4.6]# zcat create.sql.gz|mysql -uzabbix -p'zabbix123' zabbix
3、检查下selinux和防火墙状态,建议关闭
[[email protected] zabbix-server-mysql-4.4.6]# vim /etc/selinux/config
SELINUX=disabled # 修改这一行
[[email protected] zabbix]# service firewalld stop
Redirecting to /bin/systemctl stop firewalld.service
[[email protected] zabbix]# systemctl disable firewalld.service
4、启动zabbix server进程
# 修改配置文件
[[email protected] zabbix]# vim /etc/zabbix/zabbix_server.conf
91  DBHost=localhost
100 DBName=zabbix
116 DBUser=zabbix
124  DBPassword=zabbix123
# 启动zabbix server服务
[[email protected] zabbix]# service zabbix-server start
Redirecting to /bin/systemctl start zabbix-server.service
# 验证是否启动
[[email protected] zabbix]# netstat -anlupt|grep zabbix
tcp        0      0 0.0.0.0:10051           0.0.0.0:*               LISTEN      12490/zabbix_server
tcp6       0      0 :::10051                :::*                    LISTEN      12490/zabbix_server
# 设置开机自启
[[email protected] zabbix]# systemctl enable zabbix-server
Created symlink from /etc/systemd/system/multi-user.target.wants/zabbix-server.service to /usr/lib/systemd/system/zabbix-server.service.
5、修改前端配置文件,刷新服务
# zabbix前端配置,编辑zabbix前端的php配置
[[email protected] zabbix]# vim /etc/php-fpm.d/zabbix.conf
24 ; php_value[date.timezone] = Asia/Shanghai
# 如果不生效,修改/etc/php.ini
[[email protected] zabbix]# vim /etc/php.in
 878 ;date.timezone =Asia/Shanghai

# 启动以下4个服务
[[email protected] zabbix]# systemctl restart zabbix-server zabbix-agent httpd php-fpm
[[email protected] zabbix]# systemctl enable zabbix-server zabbix-agent httpd php-fpm
# httpd 是提供web服务的一个进程

# 如果有相关报错,可以查看zabbix日志
[[email protected] zabbix]# pwd
/var/log/zabbix
[[email protected] zabbix]# ll
总用量 16
-rw-rw-r-- 1 zabbix zabbix 1021 6月   4 23:42 zabbix_agentd.log
-rw-rw-r-- 1 zabbix zabbix 8976 6月   4 23:43 zabbix_server.log
6、测试验证
[[email protected] zabbix]# zabbix_get -s 127.0.0.1 -p 10050 -k "system.cpu.load[all,avg1]"
0.010000


点击右上角的小人,修改语言为中文
遇到的问题
web服务端口占用
用php写的一个web展示的页面,提供web服务的需要一个软件叫Apache Php。nginx也可以,但是它们都是占用80端口。
[[email protected] zabbix]# service httpd restart
Redirecting to /bin/systemctl restart httpd.service
如果之前机器上面安装了nginx了,就会报错。
添加监控主机
1、准备几台全新的机器,用来作被监控主机
- 一台安装启动nginx,同时关闭防火墙
[[email protected] ~]# yum install epel-release -y
[[email protected] ~]# yum install nginx

[[email protected] ~]# service nginx start
Redirecting to /bin/systemctl start nginx.service
[[email protected] ~]# lsof -i:80

[[email protected] ~]# service firewalld stop
Redirecting to /bin/systemctl stop firewalld.service
[[email protected] ~]# systemctl disable firewalld
- 一台安装mariadb
[[email protected] ~]# lsof -i:3306
COMMAND  PID  USER   FD   TYPE DEVICE SIZE/OFF NODE NAME
mysqld  1452 mysql   35u  IPv6  33122      0t0  TCP *:mysql (LISTEN)
2、从server端scp zabbix-agent软件到agent端,并安装
# server端
[[email protected] centos7-zabbix]# scp zabbix-agent-4.4.6-1.el7.x86_64.rpm 192.168.169.154:/root
# agent端
[[email protected] ~]# pwd
/root
[[email protected] ~]# yum install zabbix-agent-4.4.6-1.el7.x86_64.rpm
3、agrnt端修改配置文件,允许server监控本机
[[email protected] zabbix]# vim zabbix_agentd.conf
 98 Server=192.168.169.160
 139 ServerActive=192.168.169.160
[[email protected] zabbix]# service zabbix-agent restart
Redirecting to /bin/systemctl restart zabbix-agent.service
server端检测是否能获取到数据
[[email protected] centos7-zabbix]# zabbix_get -s 192.168.169.154 -p 10050 -k "system.cpu.load[all,avg1]"
0.020000

[[email protected] centos7-zabbix]# zabbix_get -s 192.168.169.137 -p 10050 -k "system.cpu.load[all,avg1]"
0.260000
4、图形界面配置

1、配置——主机——创建主机(要求客户端配置文件的名字和允许来监控的主机ip地址填好)
选择相应的模板–》应用集(cpu、网络、文件系统等)–》监控项


相关配置概念
模板template
就是很多的应用集、监控项、触发器等设置都配置好了
应用集
各种应用的集合,要查看内存、cpu、磁盘、网络流量、数据库等信息,一个应用集里有很多的监控项。
把某个类型的应用集合到一起组合成一个应用集。
监控项
具体监控的东西,最小单元
关系:监控项——应用集——模板——主机
触发器
报警程序
聚合图形
将很多个图形在一个页面里展示。
添加聚合图形:监测——聚合图形——创建聚合图形

自定义监控(以nginx为例)
zabbix来监控nginx服务
1.nginx服务是否在运行
2.请求数量
获取数据源
[[email protected] nginx]# cd /etc/nginx
# 开启nginx本身的统计功能
[[email protected] nginx]# vim nginx.conf
 47         location /nginx_status {

 48                 stub_status on;
 49         }
 # 刷新nginx服务
[[email protected] nginx]# service nginx restart
Redirecting to /bin/systemctl restart nginx.service
web方式访问,查看效果
输出效果如下所示:
Active connections: 2
server accepts handled requests
 18 18 23
Reading: 0 Writing: 1 Waiting: 1

连接数:建立三次握手的次数
请求数:访问网站的次数  --》发request包的次数

Active connections  Nginx正处理的活动链接数个数;重要
accepts             Nginx启动到现在共接受了多少个连接。
handled             Nginx启动到现在共处理了多少个连接。
requests            Nginx总共处理了请求次数。
Reading             Nginx读取到客户端的 Header 信息数。--》request
Writing             Nginx返回给客户端的 Header 信息数。 --》response
Waiting             Nginx已经处理完正在等候下一次请求指令的驻留链接,开启。
Keep-alive的情况下,Waiting这个值等于active-(reading + writing)。
请求丢失数=(握手数-连接数)可以看出,本次状态显示没有丢失请求。
提供以下状态信息:

Active connections
当前活动的客户端连接数,包括Waiting连接数。
accepts
接受的客户端连接总数。
handled
已处理的连接总数。通常,参数值与accepts 除非达到某些资源限制(例如, worker_connections限制)相同。
requests
客户端请求总数。
Reading
nginx正在读取请求标头的当前连接数。
Writing
nginx正在将响应写回到客户端的当前连接数。
Waiting
监控流程

步骤
1、在agent服务器的指定目录编写脚本
[[email protected] zabbix_agentd.d]# pwd
/etc/zabbix/zabbix_agentd.d
2、编写zabbix-agent的nginx参数配置文件
# server和agent协商获取数据的途径 (键值对的形式)
# zabbix server会调用zabbix_get——》key:nginx_status[active]
# zabbix agent收到后调用nginx.sh 获取对应数据
[[email protected] zabbix_agentd.d]# vim userparameter_nginx.conf
UserParameter=nginx.status[*],/etc/zabbix/zabbix_agentd.d/nginx.sh $1
3、编写在zabbix-agent上的nginx监控脚本
[[email protected] zabbix_agentd.d]# vim nginx.sh
HOST="192.168.169.160"
PORT="80"

    case $1 in
        active)
           /usr/bin/curl --insecure "http://$HOST:$PORT/nginx_status/" 2>/dev/null| grep 'Active' | awk '{print $NF}'
            ;;
        reading)
            /usr/bin/curl --insecure "http://$HOST:$PORT/nginx_status/" 2>/dev/null| grep 'Reading' | awk '{print $2}'
            ;;
        writing)
            /usr/bin/curl --insecure "http://$HOST:$PORT/nginx_status/" 2>/dev/null| grep 'Writing' | awk '{print $4}'
            ;;
        waiting)
             /usr/bin/curl --insecure "http://$HOST:$PORT/nginx_status/" 2>/dev/null| grep 'Waiting' | awk '{print $6}'
            ;;
        accepts)
            /usr/bin/curl --insecure "http://$HOST:$PORT/nginx_status/" 2>/dev/null| awk 'NR==3{print $1}'
            ;;
        ping)
             /sbin/pidof nginx | wc -w
            ;;
        handled)
            /usr/bin/curl --insecure "http://$HOST:$PORT/nginx_status/" 2>/dev/null| awk 'NR==3{print $2}'
            ;;
        requests)
             /usr/bin/curl --insecure "http://$HOST:$PORT/nginx_status/" 2>/dev/null| awk 'NR==3{print $3}'
            ;;
    esac
[[email protected] zabbix_agentd.d]# chmod +x nginx.sh
[[email protected] zabbix_agentd.d]# service zabbix-agent restart
Redirecting to /bin/systemctl restart zabbix-agent.service
4、 命令行验证
[[email protected] zabbix_agentd.d]# zabbix_get -s 192.168.169.154 -k nginx.status[active]
2
[[email protected] zabbix_agentd.d]# zabbix_get -s 192.168.169.154 -k nginx.status[requests]
60
添加监控项
1、创建应用集
配置——主机——zabbix-client-nginx——点击‘应用集’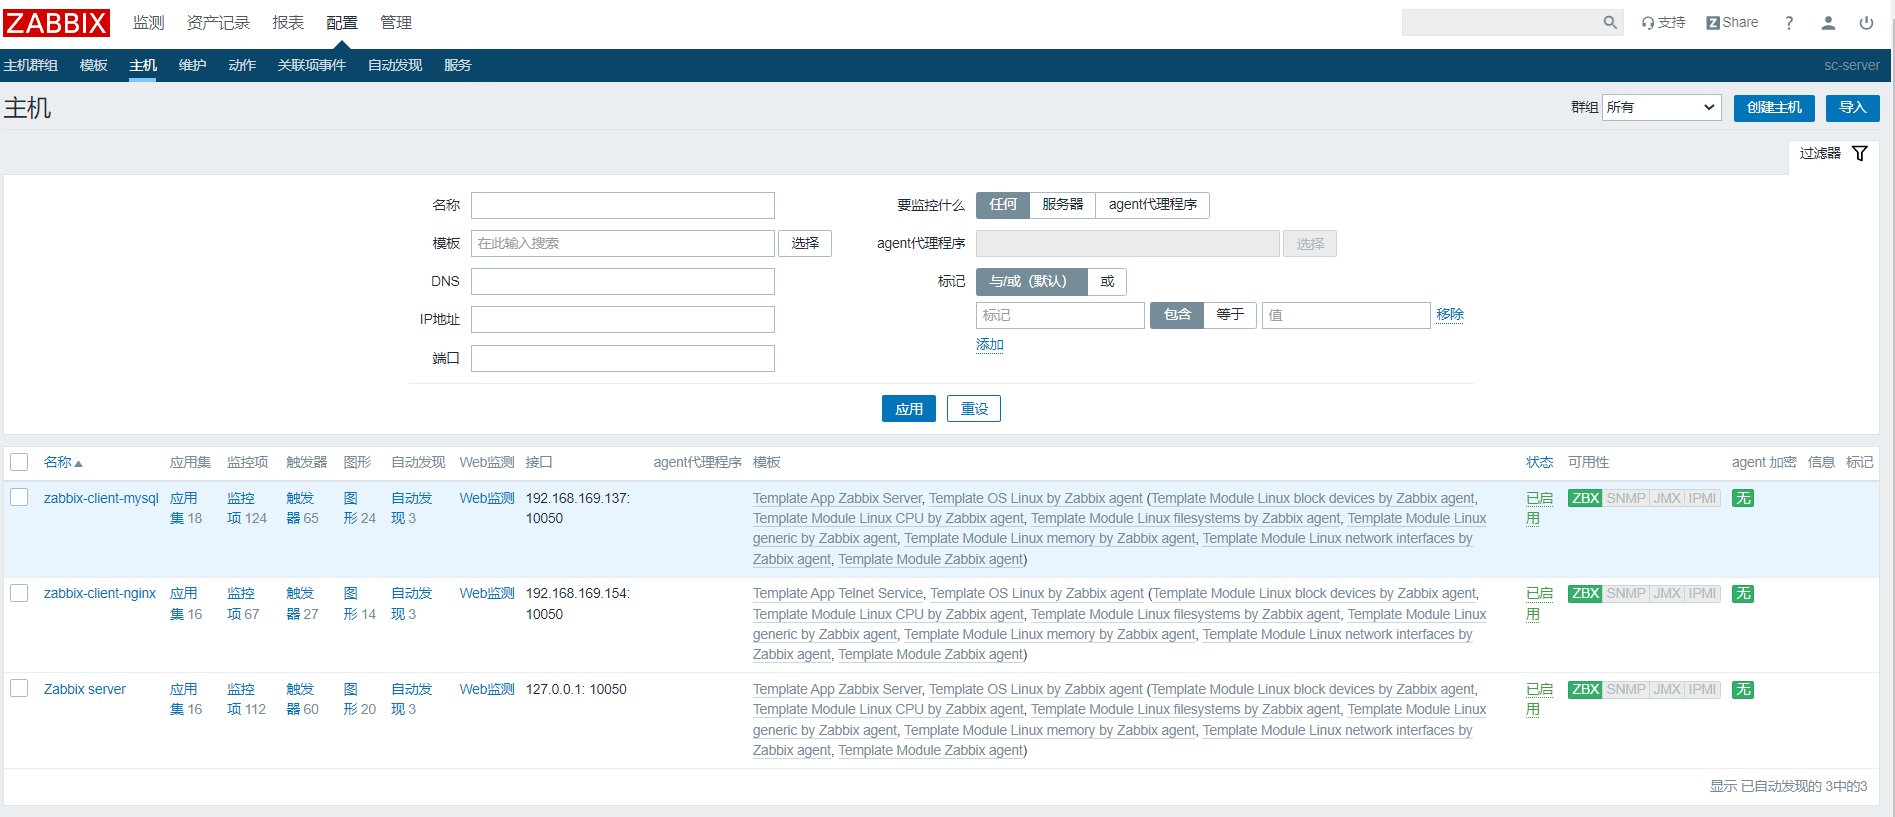
右上角点击 “创建应用集”

应用集已经创建,点击后面的监控项
2、创建监控项
点击右上角 “创建监控项”
填写要添加监控项的信息
监控项添加成功。其他监控项类似,例如:nginx.status[resuest]
3、创建图形调用监控项
配置——主机——zabbix-client-nginx——点击‘图形’
点击右上角“创建图形”
验证是否创建成功
边栏推荐
- seata 还是不支持sqlserver吗?
- 网上开期货账户安全吗?如何避免被骗?
- ZABBIX server trapper Remote Code Execution Vulnerability (cve-2017-2824)
- Computer:成功教你如何使用一招—就能找回以前的密码(曾经保存的密码但当前显示为******号的密码)
- 2022.05.28 (lc_516_longest palindrome subsequence)
- 今年高考期间各考点秩序井然,未发生影响安全的敏感案事件
- Developers changing the world - Yao Guang teenagers playing Tetris
- 2022.05.27 (lc_647_palindrome substring)
- 高考后选择哪所学校?VR全景校园全方位展示
- Spark ShuffleManager
猜你喜欢

Go language learning notes - cross domain configuration, global exception capture | web framework gin (IV)
![[C language] still don't understand the structure? Take a look at this article to give you a preliminary understanding of structure](/img/94/c9c7935aa0c98eb39a34377ad02b10.png)
[C language] still don't understand the structure? Take a look at this article to give you a preliminary understanding of structure

今年高考期间各考点秩序井然,未发生影响安全的敏感案事件

用 Plotly 绘制了几张精湛的图表,美翻了!!

2022.05.28 (lc_516_longest palindrome subsequence)

【FAQ】运动健康服务REST API接口使用过程中常见问题和解决方法总结

Bit operation topic

2022.05.28 (lc_5_longest palindrome substring)

在VR全景中如何添加聚合热点?内容模块如何添加?

推开混合云市场大门,Lenovo xCloud的破局之道
随机推荐
VR全景如何应用在家装中?体验真实的家装效果
今年高考期间各考点秩序井然,未发生影响安全的敏感案事件
[advanced C language] data storage [part I] [ten thousand words summary]
mixin-- 混入
[advanced C language] advanced pointer [Part 1]
Micronet practice: image classification using micronet
改变世界的开发者丨玩转“俄罗斯方块”的瑶光少年
騰訊Libco協程開源庫 源碼分析(二)---- 柿子先從軟的捏 入手示例代碼 正式開始探究源碼
flink啥时候可以支持在sql-client模式下,往yarn上提交任务可以指定applicati
Go语学习笔记 - 跨域配置、全局异常捕获 | Web框架Gin(四)
Recent work
C (pointer 02)
Nature Biotechnol | 李家洋/余泓团队利用平铺删除策略打破性状连锁,突破水稻产量瓶颈
It is forbidden to throw away rotten software. A guide for software test engineers to advance from elementary level to advanced level will help you promote all the way
性能测试方案(计划)模板
Analyse du code source de Tencent libco CO CO - Process open source library
2022.05.23 (lc_300_longest increment subsequence)
Apicloud visual development novice graphic tutorial
Solving Bob's survival problem by trilogy routine
Tencent libco collaboration open source library source code analysis full series summary blog