当前位置:网站首页>[chapter 04 answer sheet recognition based on Hough change]
[chapter 04 answer sheet recognition based on Hough change]
2022-06-22 01:54:00 【Haibao 7】
The whole system MATLAB Deep learning of intelligent driving hough Transformation to realize case application


Function comparison basis , It is not difficult to apply , Mainly tend to image recognition and simple processing .
The main function is as follows
main.m
clc; clear all; close all;
warning off all;
I = imread('images\\1.jpg');
I1 = Image_Normalize(I, 1);
hsize = [3 3];
sigma = 0.5;
I2 = Image_Smooth(I1, hsize, sigma, 1);
I3 = Gray_Convert(I2, 1);
bw2 = Image_Binary(I3, 1);
figure; subplot(1, 2, 1); imshow(I, []); title(' Original image ');
subplot(1, 2, 2); imshow(bw2, []); title(' Binary image ');
[~, ~, xy_long] = Hough_Process(bw2, I1, 1);
angle = Compute_Angle(xy_long);
[I4, bw3] = Image_Rotate(I1, bw2, angle*1.8, 1);
[bw4, Loc1] = Morph_Process(bw3, 1);
[Len, XYn, xy_long] = Hough_Process(bw4, I4, 1);
[bw5, bw6] = Region_Segmation(XYn, bw4, I4, 1);
[stats1, stats2, Line] = Location_Label(bw5, bw6, I4, XYn, Loc1, 1);
[Dom, Aom, Answer, Bn] = Analysis(stats1, stats2, Line, I4);
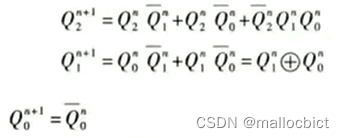
Hough Function transformation
namely Hough_Process.m
function [Len, XYn, xy_long] = Hough_Process(bw, Img, flag)

if nargin < 3
    flag = 1;
end
[H, T, R] = hough(bw);
P = houghpeaks(H, 4, 'threshold', ceil(0.3*max(H(:))));
lines = houghlines(bw, T, R, P, 'FillGap', 50, 'MinLength', 7);
max_len = 0;
for k = 1 : length(lines)
    xy = [lines(k).point1; lines(k).point2];
    len = norm(lines(k).point1-lines(k).point2);
    Len(k) = len;
    if len > max_len
        max_len = len;
        xy_long = xy;
    end
    XY{k} = xy; %  Store information
end
[Len, ind] = sort(Len(:), 'descend'); %  Sort by length
%  Line information sorting
for i = 1 : length(ind)
    XYn{i} = XY{ind(i)};
end
xy_long = XYn{1};
x = xy_long(:, 1);
y = xy_long(:, 2);
if abs(diff(x)) < abs(diff(y))
    x = [mean(x); mean(x)];
else
    y = [0.7*y(1)+0.3*y(2); 0.3*y(1)+0.7*y(2)];
end
xy_long = [x y];
if flag
    figure('units', 'normalized', 'position', [0 0 1 1]);
    subplot(2, 2, 1); imshow(bw); title(' Binary image ', 'FontWeight', 'Bold');
    subplot(2, 2, 2); imshow(H, [], 'XData', T, 'YData', R, 'InitialMagnification', 'fit');
    xlabel('\theta'); ylabel('\rho');
    axis on; axis normal; title(' Hough transform domain ', 'FontWeight', 'Bold')
    subplot(2, 2, 3); imshow(Img); title(' Original image ', 'FontWeight', 'Bold');
    subplot(2, 2, 4); imshow(Img); title(' Area identification image ', 'FontWeight', 'Bold');
    hold on;
    plot(xy_long(:,1), xy_long(:,2), 'LineWidth', 2, 'Color', 'r');
end
Region partition subfunction
Region_Segmation.m
function [bw1, bw2] = Region_Segmation(XY, bw, Img, flag)

if nargin < 4
    flag = 1;
end

for i = 1 : 2
    xy = XY{i};
    XY{i} = [1 xy(1, 2); size(bw, 2) xy(2, 2)];
    ri(i) = round(mean([xy(1,2) xy(2,2)]));
end
minr = min(ri);
maxr = max(ri);
bw1 = bw; bw2 = bw;
bw1(1:minr+5, :) = 0;
bw1(maxr-5:end, :) = 0;
bw2(minr-5:end, :) = 0;
bw2(1:round(minr*0.5), :) = 0;

if flag
    figure('units', 'normalized', 'position', [0 0 1 1]);
    subplot(2, 2, 1); imshow(Img, []); title(' Original image ', 'FontWeight', 'Bold');
    subplot(2, 2, 2); imshow(bw, []); title(' Original binary image ', 'FontWeight', 'Bold');
    hold on;
    for i = 1 : 2
        xy = XY{i};
        plot(xy(:, 1), xy(:, 2), 'r-', 'LineWidth', 2);
    end
    hold off;
    subplot(2, 2, 3); imshow(bw1, []); title(' Lower area image ', 'FontWeight', 'Bold');
    subplot(2, 2, 4); imshow(bw2, []); title(' Upper area image ', 'FontWeight', 'Bold');
end
Other specific function list files 
Full set of file source code –> Portal
边栏推荐
- 大厂英伟达面试题整理123
- 第 08 章 基于知识库的手写体数字识别MATLAB深度学习应用实战
- 第 21 章 路面裂缝检测识别系统设计--matlab深度学习实战
- 【第 17 章 基于 Harris 的角点特征检测--Matlab机器学习项目实战】
- 功能测试——MySQL数据库简介
- Scuba China trip - Suzhou station, online and offline limited time registration channel has been opened!
- 阿里腾讯百度软件测试工程师推荐——软件测试模型之快速原型模型
- GAMES-101-个人总结归纳-Transformation
- AHA C language Chapter 5 the good play is later (Lecture 24-25)
- 2022年中国手机银行年度专题分析
猜你喜欢

LeetCode 41 - 45 动态规划专题
数电期末笔记

Rational rose 安装教程

acwing 836. 合并集合 (并查集)

Five years after graduation, I finally became a software testing engineer with a monthly salary of 13000

第 08 章 基于知识库的手写体数字识别MATLAB深度学习应用实战
【虚幻引擎UE】打包报错出现!FindPin错误的解决办法

第 12 章 基于块匹配的全景图像拼接--Matlab深度学习实战图像处理应用

BSV上的委托合约(2)

Redis cache exceptions and handling scheme summary
随机推荐
Google Earth Engine(GEE)——合并VCI指数和TCI温度得时序影像折线图(危地马拉、萨尔瓦多为例)
LeetCode 41 - 45 动态规划专题
第六届世界智能大会“云”端召开在即
Mysql数据库轻松学07—select语句书写顺序及执行顺序
BSV上的委托合约(2)
NOIP初赛 CSP-J1 CSP-S1 第1轮 初赛 信奥中的数学知识(一)
英伟达笔试面试题整理DIY
How to read a paper
Rational rose 安装教程
High score schemes have been opened to the public, and the second round of the China "software Cup" remote sensing competition is coming!
第 24 章 基于 Simulink 进行图像和视频处理--matlab深度学习实战整理
DAST 黑盒漏洞扫描器 第四篇:扫描性能
Mysql数据库轻松学09—数据分析师常用:数据查询语言DQL之多表查询
[amd comprehensive job search experience sharing 618]
Winform项目控制台调试方式
当零售数字化进入到全新的发展阶段,我们需要将公域和私域进行打通
MBA-day24 最值问题
Benchmarking copilot, the first in China: natural language one click generation method level code aixcoder XL is coming
第298场力扣周赛个人题解
acwing 838. 堆排序 (手写一个堆)