当前位置:网站首页>MATLAB image processing - Otsu threshold segmentation (with code)
MATLAB image processing - Otsu threshold segmentation (with code)
2022-06-12 08:06:00 【HNU_ Liu Yuan】
Catalog
Otsu threshold
Otsu threshold is also called maximum variance threshold , yes 1979 Proposed by Japan's Otsu exhibition in , It is derived from the principle of discrimination and least square method , The basic idea is to maximize the variance between classes , The optimal threshold is obtained .
Algorithm flow
Make ![]() Indicates a picture with the size of
Indicates a picture with the size of ![]() Pixels in a digital image
Pixels in a digital image ![]() Different gray levels ,
Different gray levels ,![]() Indicates that the gray level is
Indicates that the gray level is ![]() The number of pixels , The total number of pixels in the image is
The number of pixels , The total number of pixels in the image is ![]() . The normalized histogram has components
. The normalized histogram has components ![]() , There is
, There is

Now? , Suppose you choose a threshold ![]() , And use it to thresholding the input image into two types
, And use it to thresholding the input image into two types ![]() and
and ![]() , among
, among ![]() The gray value in the image is in the interval
The gray value in the image is in the interval ![]() All pixels in the ,
All pixels in the ,![]() By the gray value in the interval
By the gray value in the interval ![]() All pixels in the . With this threshold , Pixels are classified into classes
All pixels in the . With this threshold , Pixels are classified into classes ![]() The probability of
The probability of ![]() Given by the following cumulative sum :
Given by the following cumulative sum :

Change the angle , It's kind of ![]() Probability of occurrence . Allied , class
Probability of occurrence . Allied , class ![]() The probability of that happening is zero :
The probability of that happening is zero :

Assign to class ![]() The average gray value of is :
The average gray value of is :

Allied , Assign to class ![]() The average gray value of is :
The average gray value of is :

To the first k The cumulative mean value of level ( Average grayscale ) Given by the following formula :

The average gray level of the whole image is given by the following formula :

To evaluate the segmentation quality of the selected threshold , Define the variance between classes σ2![]() by :
by :
![]()
The above formula can be reduced to :

As can be seen from the above formula , Calculate different thresholds k Between class variance ![]() , You just have to calculate m and
, You just have to calculate m and ![]() Two parameters . To get the optimal threshold
Two parameters . To get the optimal threshold ![]() , from
, from ![]() Choose different k Calculate the variance between classes
Choose different k Calculate the variance between classes ![]() , When
, When ![]() Obtained at maximum k Is the maximum variance threshold .
Obtained at maximum k Is the maximum variance threshold .
The flow chart shows

result

As you can see from the diagram , After Otsu threshold segmentation, we can basically get two parts , You can extract parts of the moon from the picture . Can quickly and effectively find the segmentation threshold between classes , But its shortcomings are also obvious , That is, it can only be divided for a single target , Or the objects of interest belong to the same gray range .
Code
clear; clc;
I=rgb2gray(imread('moon.jpg'));
subplot(1, 2, 1)
imshow(I);
xlabel('(a)  original image ');
% level = graythresh(I);      % Use MATLAB  Function to calculate the threshold
% BW = im2bw(I, level);
% subplot(1, 3, 2)
% imshow(BW);
% xlabel('(b) graythresh');
% disp(['graythresh  Calculate the gray threshold :', num2str(level*255)]);
T = Otsu(double(I));     % Use Otsu method to calculate the threshold
disp([' Otsu method to calculate the gray threshold :', num2str(T)])
BW = im2bw(I, T/255);
% Threshold segmentation
subplot(1, 2, 2)
imshow(BW);
xlabel('(c)  Dajin law ');

function ThreshValue = Otsu(Imag)
%  Otsu method to calculate the threshold
%  Input :
%    Imag: Two dimensional array , Numerical values represent grayscale ;
%  Output :
%    ThreshValue: threshold
iMax = max(Imag(:));              %  Maximum
iMin = min(Imag(:));               %  minimum value
T = iMin:iMax;                        %  Gray value range
Tval = zeros(size(T));               %  variance
[iRow, iCol] = size(Imag);        %  Data dimension size
imagSize = iRow*iCol;            %  Number of pixels
%  Traversal gray value , Calculate variance
for i = 1 : length(T)
    TK = T(i);
    iFg = 0;          %  prospects
    iBg = 0;          %  background
    FgSum = 0;    %  Total prospects
    BgSum = 0;    %  Total number of backgrounds
    for j = 1 : iRow
        for k = 1 : iCol
            temp = Imag(j, k);
            if temp > TK
                iFg = iFg + 1;      %  Foreground pixel statistics
                FgSum = FgSum + temp;
            else
                iBg = iBg + 1;      %  Background pixel statistics
                BgSum = BgSum + temp;
            end
        end
    end
    w0 = iFg/imagSize;      %  Foreground ratio
    w1 = iBg/imagSize;     %  Background proportion
    u0 = FgSum/iFg;         %  Average value of foreground gray level
    u1 = BgSum/iBg;        %  Average value of background gray level
    Tval(i) = w0*w1*(u0 - u1)*(u0 - u1);     %  Calculate variance
end
[~, flag] = max(Tval);             %  The maximum subscript
ThreshValue = T(flag);
end边栏推荐
- Improvement of hash function based on life game (continued 1)
- The Poisson regression model (posion) is constructed by GLM function of R language, and the poisgof function of epidisplay package is used to test the goodness of fit of the fitted Poisson regression
- Uni app screenshot with canvas and share friends
- Rich dad, poor dad Abstract
- Mathematical Essays: Notes on the angle between vectors in high dimensional space
- Final review of Discrete Mathematics (predicate logic, set, relation, function, graph, Euler graph and Hamiltonian graph)
- Rnorm function of R language generates positive distribution data, calculates descriptive statistical summary information of vector data using sum function of epidisplay package, and visualizes ordere
- 2.2 链表---设计链表(Leetcode 707)
- Leetcode notes: Weekly contest 275
- MFC中窗口刷新函数详解
猜你喜欢

Meter Reading Instrument(MRI) Remote Terminal Unit electric gas water
Process terminated
C # hide the keyboard input on the console (the input content is not displayed on the window)

Database connection pool and dbutils tool
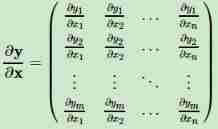
Mathematical knowledge - matrix - matrix / vector derivation
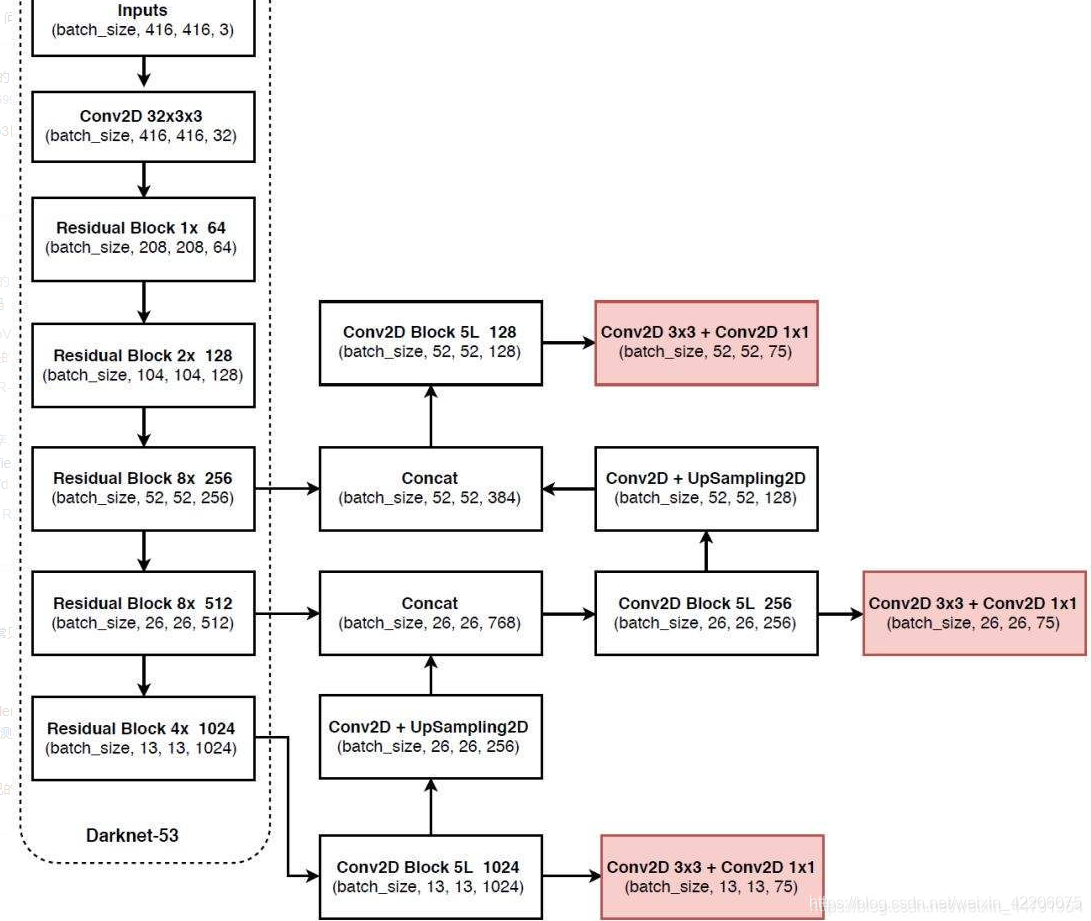
20220526 yolov1-v5

Vision Transformer | Arxiv 2205 - TRT-ViT 面向 TensorRT 的 Vision Transformer
Meter Reading Instrument(MRI) Remote Terminal Unit electric gas water

Clarify the division of IPv4 addresses

Three data exchange modes: line exchange, message exchange and message packet exchange
随机推荐
2D visualization of oil storage, transportation and production, configuration application enables intelligent development of industry
20220607. face recognition
Final review of Discrete Mathematics (predicate logic, set, relation, function, graph, Euler graph and Hamiltonian graph)
Ceres optimizer usage (self use)
The latest hbuilderx editing uni app project runs in the night God simulator
StrVec类 移动拷贝
Meter Reading Instrument(MRI) Remote Terminal Unit electric gas water
Ecmascript6 interview questions
Architecture and performance analysis of convolutional neural network
Ten important properties of determinant
Improvement of hash function based on life game
Model Trick | CVPR 2022 Oral - Stochastic Backpropagation A Memory Efficient Strategy
Classic paper review: palette based photo retrieval
Leetcode notes: Weekly contest 277
Detailed explanation of Google open source sfmlearner paper combining in-depth learning slam -unsupervised learning of depth and ego motion from video
Leetcode notes: biweekly contest 71
Getting started with Jetson nano Series IV: common skills of NVIDIA Jetson nano
802.11 protocol: wireless LAN protocol
Mathematical knowledge - derivation - Basic derivation knowledge
Vision Transformer | CVPR 2022 - Vision Transformer with Deformable Attention