当前位置:网站首页>Primary application case of Excel DuPont analyzer
Primary application case of Excel DuPont analyzer
2022-07-01 05:47:00 【Begin to change】
One 、 Introduce
DuPont analysis (DuPont Analysis) Is the use of several major Financial ratios To comprehensively analyze the financial situation of the enterprise . say concretely , It is used to evaluate the profitability of the company and the level of return on shareholders' equity , Evaluate the enterprise from the financial point of view The performance of A classic method of . Its basic idea is that the enterprise Return on equity It is decomposed into the product of multiple financial ratios , This is helpful to analyze and compare the business performance of enterprises . This method of analysis was first developed in the United States DuPont Use , Hence the name DuPont analysis .

Two 、 Case study
1、 Exhibition


2、 step
First extract the desired data from the original table ( for example 3 Monthly sales cost ), The data at this time is not static , Because the filling pie will be used when filling data ;
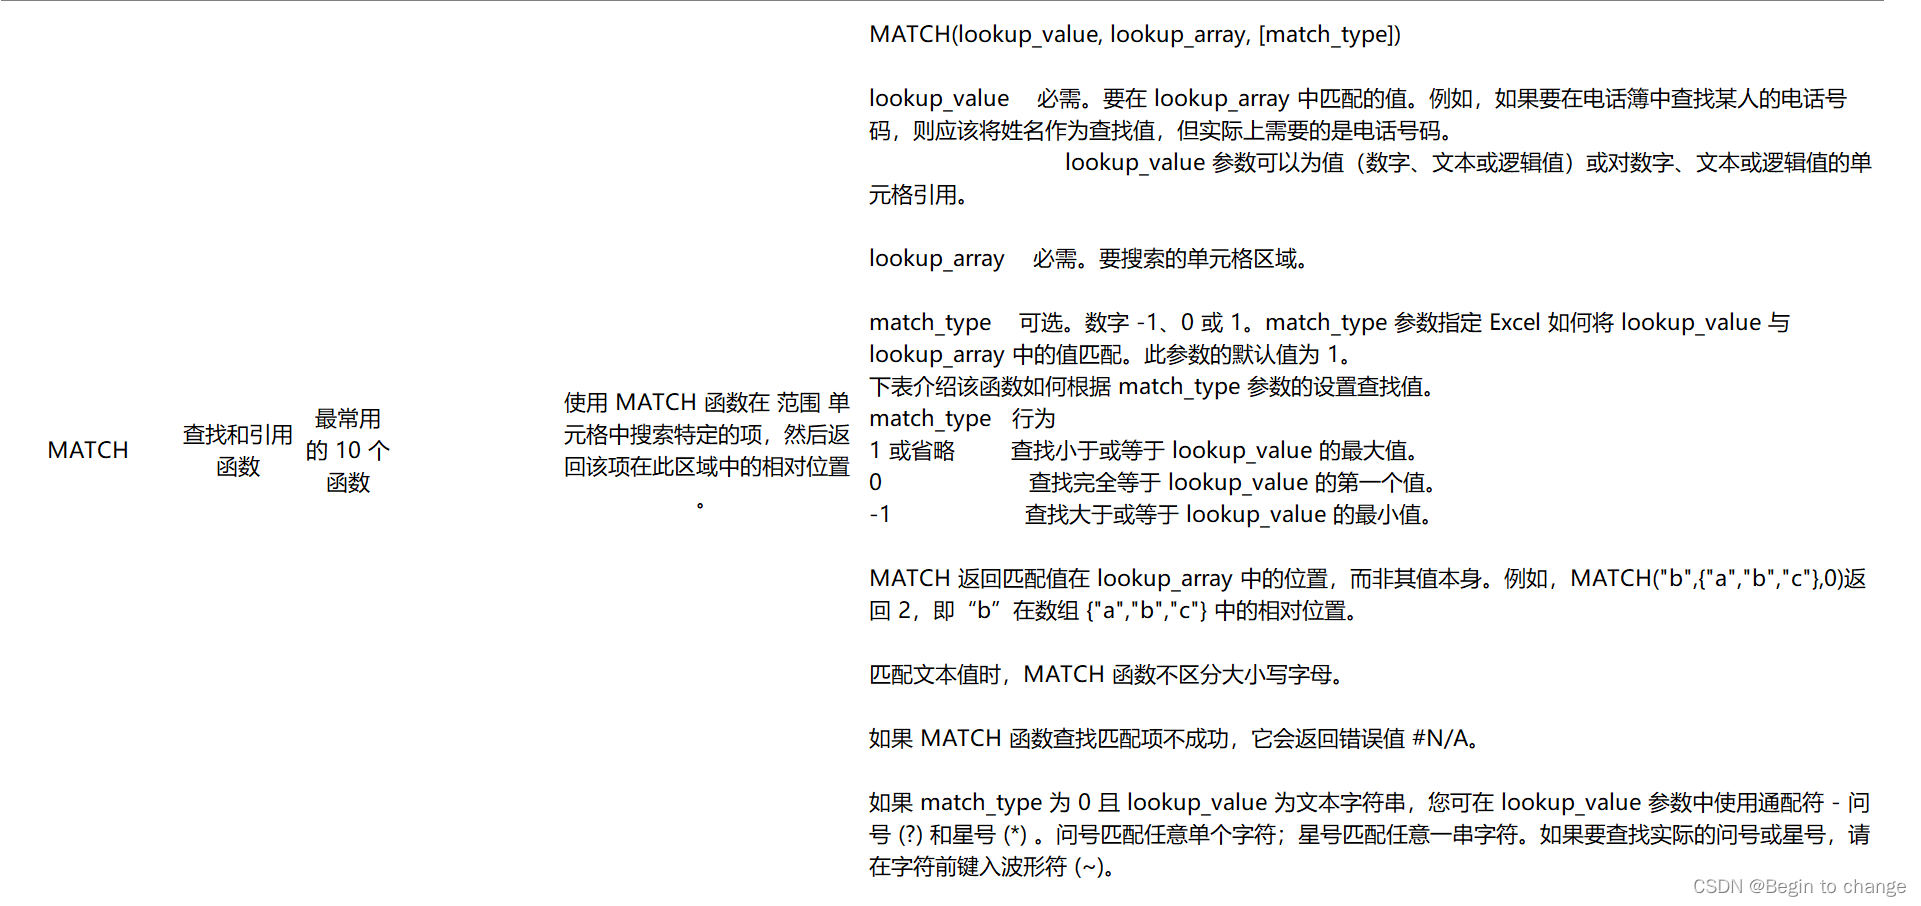
The obtained data is equivalent to obtaining the value in the original data under the condition that the row and column conditions are limited , At this time, the function used is index;
index The first parameter of the function is the range of the cell to be searched ; The second parameter is the row where the data to be searched is located , The third parameter is the column where the data to be searched is located
The data to be searched is dynamic , So you can't write the row and column numbers directly , So we need to introduce another function match;
At this point, the row and column numbers found are what the data needs
The formula :=INDEX($A$1:$G$30,MATCH($I2,$A$1:$A$30,0),MATCH(K$1,$A$1:$G$1,0))
notes :① Because the selected areas are different , So there will be data deviation , Therefore, it is recommended to directly select all
② When determining the line number match A lock is required in the function I, Because the value will change when filling down , And this value is constant
③ When determining the column number match A lock is required in the function 1, Because it is filled to the right ;
Calculation of growth rate : growth rate =(3 Month of data -2 Month of data )/2 Month of data
Format setting

Cell formatting


Get other required data according to the data formula

After the data is established , Reconstruct DuPont analysis table ;
Select the name and growth rate and copy its value , Then paste selectively ;
Construct all the data in turn


Realize the dynamic change of all data ;
The root of all data lies in the data obtained from the original table , That is to say, when choosing different months , The resulting data will change ;
Just make a position change , That is to say 3 The month is variable , Then all the following data will change , the 3 The month is written in dynamic , That is, where the value is equal to the dynamic filter ;

边栏推荐
猜你喜欢

Trust guessing numbers game

Ucosiii --- engineering transplantation
SSM的教务管理系统(免费源码获取)

Scope data export mat

【QT】qt加减乘除之后,保留小数点后两位

My experience from technology to product manager

穿越派·派盘 + Mountain Duck = 数据本地管理

Call us special providers of personal cloud services for College Students

为什么用葫芦儿派盘取代U盘?
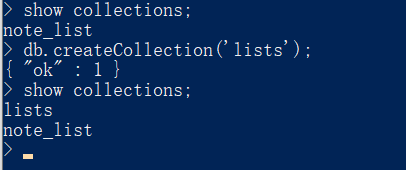
Mongodb學習篇:安裝後的入門第一課

随机推荐
excel可视化
Debug details under pycharm
Simple implementation of database connection pool
Daily code 300 lines learning notes day 11
tese_ Time_ 2h
【笔记】电商订单数据分析实战
【QT】qt加减乘除之后,保留小数点后两位
亲爱的派盘用户,我要向您表白!
码蹄集 - MT3114 · 有趣的平衡 - 用样例通俗地讲解
OpenGL ES: (5) OpenGL的基本概念、OpenGL ES 在屏幕产生图片的过程、OpenGL管线(pipeline)
excel高级绘图技巧100讲(一)-用甘特图来展示项目进度情况
Leetcode top 100 question 2 Add two numbers
千万不要把笔记视频乱放!
Unity 使用Sqlite
SQL必会题之留存率
表格中el-tooltip 实现换行展示
健康照明中应用的LED照明灯
从诺奖知“边缘计算”的未来!
Mongodb learning chapter: introduction after installation lesson 1
Huluer app help