当前位置:网站首页>Detailed explanation of JVM runtime data area and JMM memory model
Detailed explanation of JVM runtime data area and JMM memory model
2022-08-01 08:34:00 【Feifei Technology House】
1. JVM runtime data area
The JVM runtime data area can be divided into five blocks: metaspace, heap, virtual machine stack, native method stack, and program counter.

- Metaspace (method area): It stores class template objects and is an area shared by threads. On disk, there is generally no GC
- Heap space: the area shared by threads, the main position for object creation and GC
- Virtual machine stack: private to the thread, the basic unit is the stack frame, each stack frame corresponds to a method, the stack frame is composed as follows
- Local variable table: store method variable information
- Operand stack: the area where the method runs
- Dynamic linking: point to the method template object, and implement method rewriting together with the virtual method table
- Return address: the return address of the method
- Native method stack: thread private, execution area for native methods
- Program counter: thread private, responsible for recording where the thread executes during the process of thread context switching
2. JMM memory model
Hardware memory model

Usually, when the CPU needs to read the main memory, it will read the part of the main memory into the CPU cache or the internal register, and then perform the operation in the register.When the CPU needs to write the result back to main memory, it flushes the value of the internal registers to the cache, and then at some point flushes the value back to main memory.
In a multiprocessor system, each processor has its own cache, and they share the same main memory, so there is a cache coherency problem.In order to solve the problem of consistency, each processor needs to follow some protocols when accessing the cache, and operate according to the protocol when reading and writing. Such protocols include MSI, MESI, etc.
JMM
The JMM memory model divides the content into two parts: thread private memory and main memory. The corresponding relationship with the hardware memory model we mentioned earlier is as follows:

The interaction between private memory and main memory is controlled by the following eight operations:

3. Visible line and volatile keyword
In a nutshell, the volatile keyword prevents instruction reordering in the form of memory barriers to maintain variable ordering and visibility.
A line of code goes through the following stages from execution to execution:

The volatile keyword has the following two functions:
- Guarantees that volatile-modified shared variables are always visible to all threads, that is, when a thread modifies the value of a volatile-modified shared variable, the new value can always be immediately known to other threads.
- Disable instruction reordering optimization.
The JVM provides four types of memory barrier instructions:
- loadload: between two read operations
- storestore: between two writes
- loadstore: between read and write operations
- storelosd: between writes and reads

边栏推荐
猜你喜欢

网络基础学习
Custom IP used in PCIE
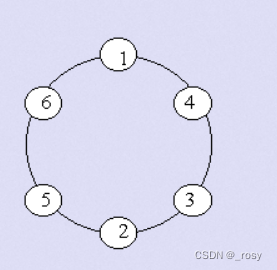
Prime Ring Problem(素数环问题)

Case practice --- Resnet classic convolutional neural network (Mindspore)
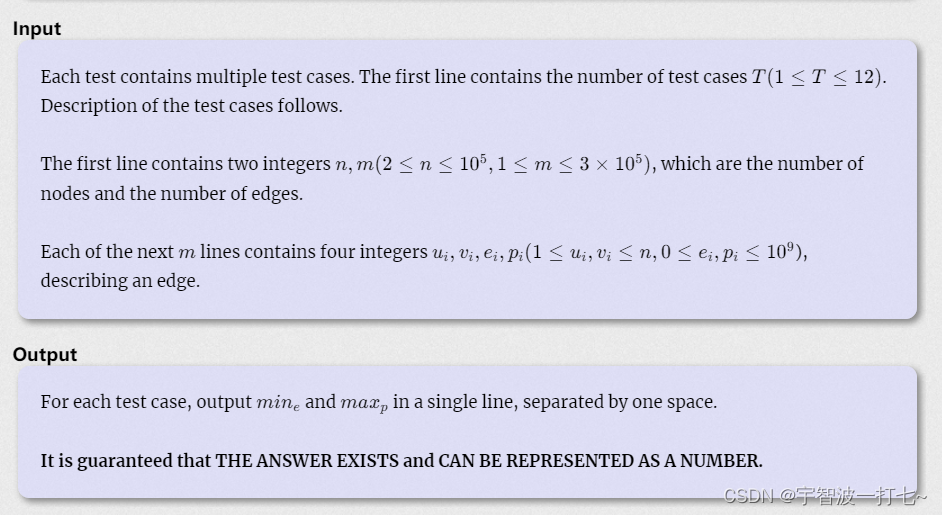
【杭电多校第四场 B题】最短路图+缩点dp
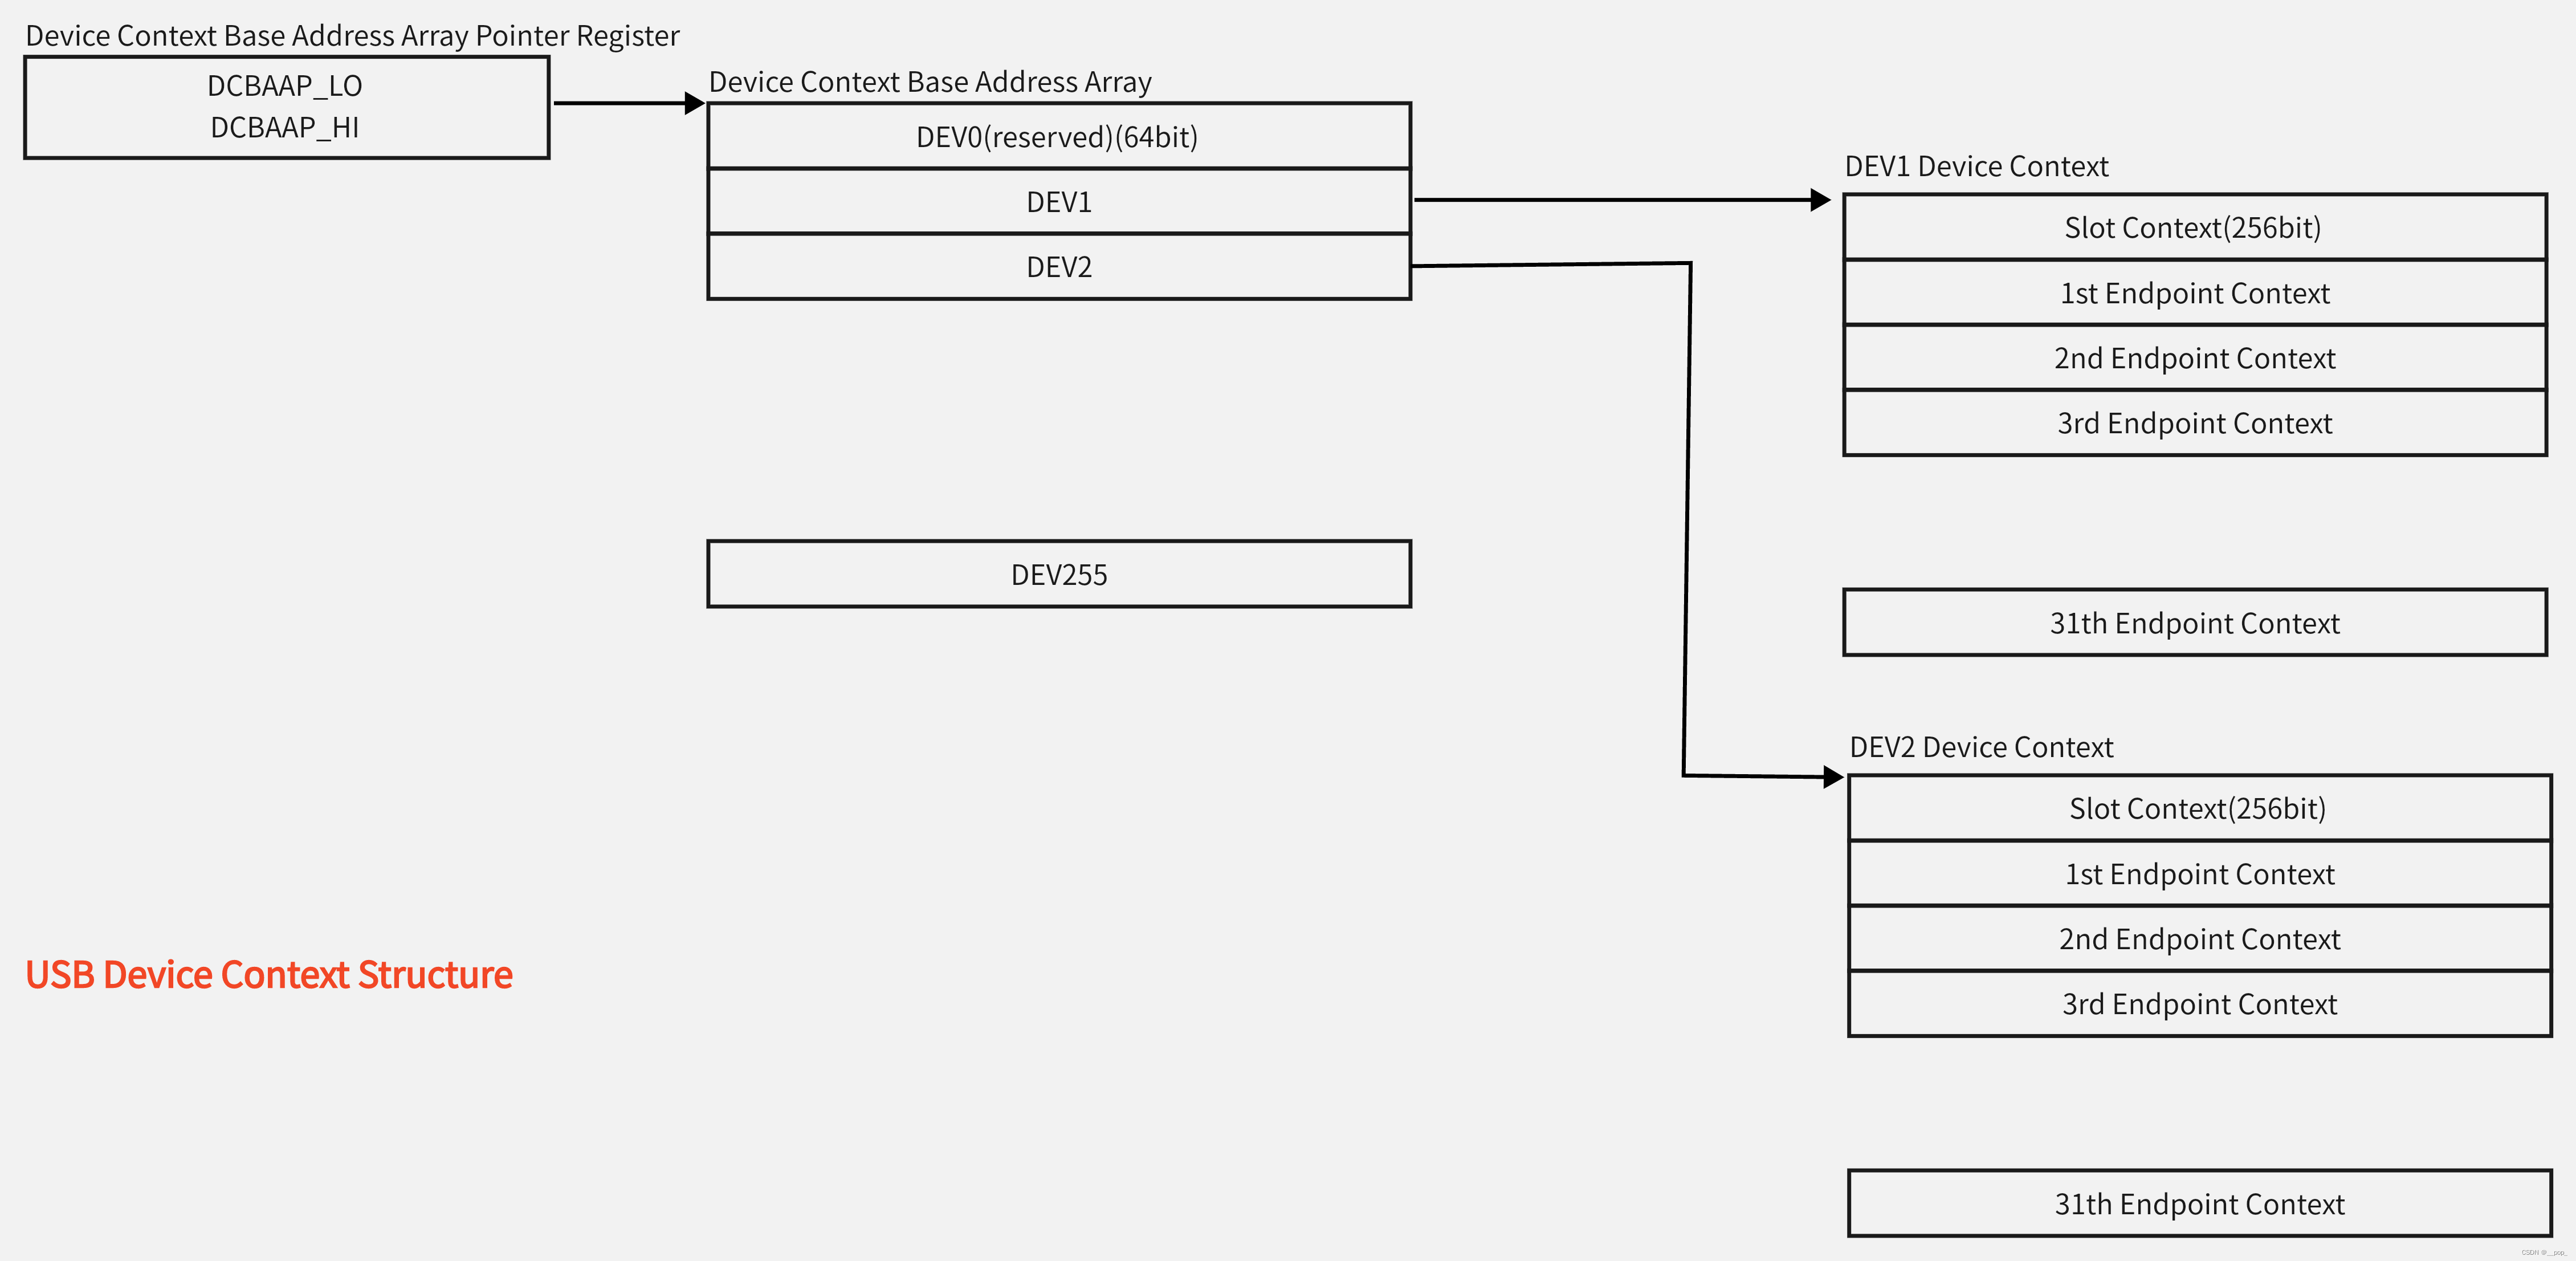
USB 协议 (二) 术语

Microsoft Azure & NVIDIA IoT developers season I | Azure IoT & NVIDIA Jetson development foundation

leetcode-6132:使数组中所有元素都等于零

ACmix 论文精读,并解析其模型结构
JVM 运行时数据区与JMM 内存模型详解
随机推荐
pytest接口自动化测试框架 | 跳过测试类
【MySQL】操作表DML相关语句
【STM32】入门(二):跑马灯-GPIO端口输出控制
zip package all files in the directory (including hidden files/folders)
ogg同步oracle到mysql,字段里面可能有需要转义的字符,怎么配置转义?
pytest接口自动化测试框架 | 单个/多个参数
codeforces每日5题(均1600)-第二十七天
LabVIEW RT中的用户界面更新速度
Case practice --- Resnet classic convolutional neural network (Mindspore)
[Tear AHB-APB Bridge by hand]~ Why aren't the lower two bits of the AHB address bus used to represent the address?
HoloView 在 jyputer lab/notebook 不显示总结
USB Protocol (2) Terminology
小程序更多的手势事件(左右滑动、放大缩小、双击、长按)
请问用flinksql写入数据到clickhouse需要引入什么依赖吗?
22 Niu Ke Duo School 1 I. Chiitoitsu (Probability dp)
Holoview--Introduction
搜索框字符自动补全
VoLTE基础学习系列 | 企业语音网简述
app 自动化 通过工具查看app 元素 (三)
Microsoft Azure & NVIDIA IoT developers season I | Azure IoT & NVIDIA Jetson development foundation