当前位置:网站首页>tensorflow2.0手写数字识别(tensorflow手写体识别)
tensorflow2.0手写数字识别(tensorflow手写体识别)
2022-08-01 12:46:00 【全栈程序员站长】
大家好,又见面了,我是你们的朋友全栈君。
本节笔记作为 Tensorflow 的 Hello World,用 MNIST 手写数字识别来探索 Tensorflow。笔记的内容来自 Tensorflow 中文社区和黄文坚的《Tensorflow 实战》,只作为自己复习总结。
环境:
- Windows 10
- Anaconda 4.3.0
- Spyder
本节笔记主要采用 Softmax Regression 算法,构建一个没有隐层的神经网络来实现 MNIST 手写数字识别。
1. MNIST 数据集加载
MNIST 数据集可以从MNIST官网下载。也可以通过 Tensorflow 提供的 input_data.py进行载入。
由于上述方法下载数据集比较慢,我已经把下载好的数据集上传到CSDN资源中,可以直接下载。
将下载好的数据集放到目录C:/Users/Administrator/.spyder-py3/MNIST_data/下。目录可以根据自己的喜好变换,只是代码中随之改变即可。
通过运行Tensorflow 提供的代码加载数据集:
from tensorflow.examples.tutorials.mnist import input_data

# 获取数据
mnist = input_data.read_data_sets("C:/Users/Administrator/.spyder-py3/MNIST_data/", one_hot=True)MNIST数据集包含55000样本的训练集,5000样本的验证集,10000样本的测试集。 input_data.py 已经将下载好的数据集解压、重构图片和标签数据来组成新的数据集对象。
图像是28像素x28像素大小的灰度图片。空白部分全部为0,有笔迹的地方根据颜色深浅有0~1的取值,因此,每个样本有28×28=784维的特征,相当于展开为1维。
所以,训练集的特征是一个 55000×784 的 Tensor,第一纬度是图片编号,第二维度是图像像素点编号。而训练集的 Label(图片代表的是0~9中哪个数)是一个 55000×10 的 Tensor,10是10个种类的意思,进行 one-hot 编码 即只有一个值为1,其余为0,如数字0,对于 label 为[1,0,0,0,0,0,0,0,0,0]。
2. Softmax Regression 算法
数字都是0~9之间的,一共有10个类别,当对图片进行预测时,Softmax Regression 会对每一种类别估算一个概率,并将概率最大的那个数字作为结果输出。
Softmax Regression 将可以判定为某类的特征相加,然后将这些特征转化为判定是这一个类的概率。我们对图片的所以像素求一个加权和。如某个像素的灰度值大代表很有可能是数字n,这个像素权重就很大,反之,这个权重很有可能为负值。
特征公式:
b i b_i bi 为偏置值,就是这个数据本身的一些倾向。
然后用 softmax 函数把这些特征转换成概率 y y y :
对所有特征计算 softmax,并进行标准化(所有类别输出的概率值和为1):
判定为第 i 类的概率为:
Softmax Regression 流程如下:
转换为矩阵乘法:
写成公式如下:
3.实现模型
import tensorflow as tf
sess = tf.InteractiveSession()
x = tf.placeholder(tf.float32, [None, 784])
W = tf.Variable(tf.zeros([784,10]))
b = tf.Variable(tf.zeros([10]))
y = tf.nn.softmax(tf.matmul(x,W) + b)首先载入 Tensorflow 库,并创建一个新的 InteractiveSession ,之后的运算默认在这个 session 中。
placeholder:输入数据的地方,None代表不限条数的输入,每条是784维的向量Variable:存储模型参数,持久化的
4.训练模型
我们定义一个 loss 函数来描述模型对问题的分类精度。 Loss 越小,模型越精确。这里采用交叉熵:
其中,y 是我们预测的概率分布, y’ 是实际的分布。
y_ = tf.placeholder(tf.float32, [None,10])
cross_entropy = tf.reduce_mean(-tf.reduce_sum(y_ * tf.log(y),reduction_indices=[1]))定义一个 placeholder 用于输入正确值,并计算交叉熵。
接着采用随机梯度下降法,步长为0.5进行训练。
train_step = tf.train.GradientDescentOptimizer(0.5).minimize(cross_entropy)训练模型,让模型循环训练1000次,每次随机从训练集去100条样本,以提高收敛速度。
for i in range(1000):
  batch_xs, batch_ys = mnist.train.next_batch(100)
train_step.run({x: batch_xs, y_: batch_ys})5.评估模型
我们通过判断实际值和预测值是否相同来评估模型,并计算准确率,准确率越高,分类越精确。
6.总结
实现的整个流程:
- 定义算法公式,也就是神经网络前向传播时的计算。
- 定义 loss ,选定优化器,并指定优化器优化 loss。
- 迭代地对数据进行训练。
- 在测试集或验证集上对准确率进行评测。
7.全部代码
import tensorflow as tf

from tensorflow.examples.tutorials.mnist import input_data

# 获取数据
mnist = input_data.read_data_sets("C:/Users/Administrator/.spyder-py3/MNIST_data/", one_hot=True)

print('训练集信息:')
print(mnist.train.images.shape,mnist.train.labels.shape)
print('测试集信息:')
print(mnist.test.images.shape,mnist.test.labels.shape)
print('验证集信息:')
print(mnist.validation.images.shape,mnist.validation.labels.shape)

# 构建图
sess = tf.InteractiveSession()
x = tf.placeholder(tf.float32, [None, 784])
W = tf.Variable(tf.zeros([784,10]))
b = tf.Variable(tf.zeros([10]))

y = tf.nn.softmax(tf.matmul(x,W) + b)

y_ = tf.placeholder(tf.float32, [None,10])
cross_entropy = tf.reduce_mean(-tf.reduce_sum(y_ * tf.log(y),reduction_indices=[1]))
train_step = tf.train.GradientDescentOptimizer(0.5).minimize(cross_entropy)

# 进行训练
tf.global_variables_initializer().run()

for i in range(1000):
  batch_xs, batch_ys = mnist.train.next_batch(100)
  train_step.run({x: batch_xs, y_: batch_ys})

# 模型评估
correct_prediction = tf.equal(tf.argmax(y,1), tf.argmax(y_,1))
accuracy = tf.reduce_mean(tf.cast(correct_prediction, tf.float32))

print('MNIST手写图片准确率:')
print(accuracy.eval({x: mnist.test.images, y_: mnist.test.labels}))发布者:全栈程序员栈长,转载请注明出处:https://javaforall.cn/126515.html原文链接:https://javaforall.cn
边栏推荐
- Alibaba Cloud Official Redis Development Specification
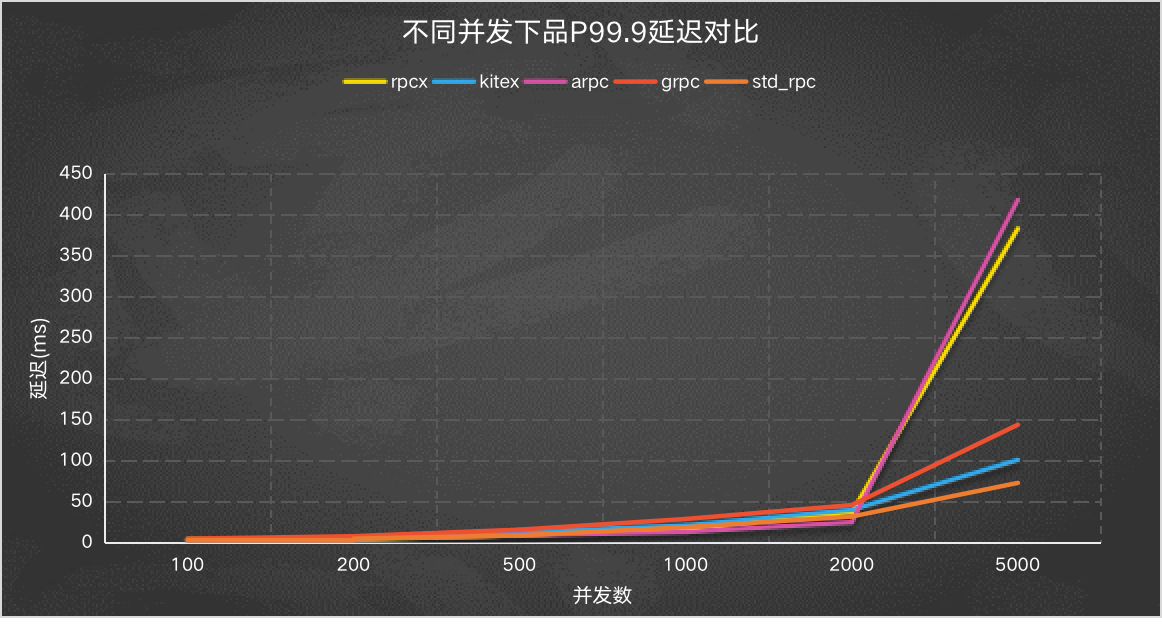
- 2022 Go ecosystem rpc framework Benchmark
- Qt获取文件夹下所有文件
- Istio Meetup China:全栈服务网格 - Aeraki 助你在 Istio 服务网格中管理任何七层流量
- 快速幂---学习笔记
- R language ggplot2 visualization: use the ggdensity function of the ggpubr package to visualize density plots, use the stat_central_tendency function to add mean vertical lines to the density and cust
- How to Integrate Your Service Registry with Istio?
- 如何成功通过 CKA 考试?
- How to successfully pass the CKA exam?
- 如何利用DevExpress控件绘制流程图?看完这篇文章就懂了!
猜你喜欢


随机推荐
实现集中式身份认证管理的案例
SQL函数 %SQLSTRING
《MySQL核心知识》第6章:查询语句
Meshlab & Open3D SOR filtering
Complete Raiders of JS Data Type Conversion
Do wildcard SSL certificates not support multiple domains?
【讲座分享】“营收“看金融
What is MNIST (what does plist mean)
音视频技术开发周刊 | 256
MVVM响应式
LeetCode_动态规划_中等_313.超级丑数
SQL function SQRT
How to Integrate Your Service Registry with Istio?
MNIST是什么(plist是什么意思)
Towhee 每周模型
uniapp读取和写入文件
一文带你读懂云原生、微服务与高可用
软件设计师考点汇总(室内设计师个人总结)
markdown常用数学符号cov(markdown求和符号)
程序员如何优雅地解决线上问题?