当前位置:网站首页>Rank sum ratio comprehensive evaluation method for common models in mathematical modeling
Rank sum ratio comprehensive evaluation method for common models in mathematical modeling
2022-06-25 12:06:00 【Halosec_ Wei】
1、 effect
rsr (RSR) It refers to ranking benefit indicators from small to large 、 Cost indicators are ranked from large to small , Then calculate the rank sum ratio , Finally, statistical regression 、 Grading sort . By rank transformation , Get dimensionless Statistics RSR, With RSR Value is used to sort the evaluation objects directly or by grades , So as to make a comprehensive evaluation of the evaluation object .
2、 Input / output description
Input : At least two or more quantitative variables .
Output : Reflect the comprehensive scores and grades of the assessment indicators in the quantitative evaluation
3、 Case example
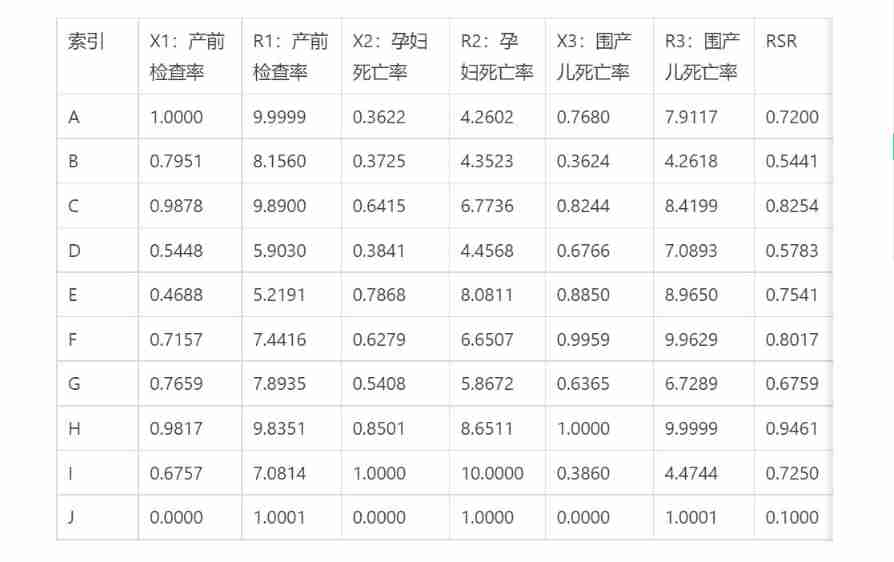
Case study : To a province 10 A comprehensive evaluation of the three indicators of maternal health care in four regions
4、 Case data

Rank sum ratio comprehensive evaluation method (RSR) Case data
5、 Case operation

Step1: New analysis ;
Step2: Upload data ;
Step3: Select the corresponding data to open and preview , Click start analysis after confirmation ;

step4: choice 【 Rank sum ratio comprehensive evaluation method 】;
step5: View the corresponding data format ,【 Rank sum ratio comprehensive evaluation method 】 The characteristic sequence is required to be a quantitative variable , It is divided into positive indicator variables and negative indicator variables , And the sum of the number of positive indicator variables and negative indicator variables is greater than or equal to two items .
step6: Set the rank editing method ( Non integral rank method ( Recommended )、 Whole rank method 、 No treatment )、 Number of grades (3 files 、4 files 、5 files )、 Variable weight ( Entropy weight method 、 Do not set the weight 、 Custom weights ).
step7: Click on 【 To analyze 】, Complete the operation .
6、 Output result analysis
Output results 1: Index weight calculation

Chart description : The weight calculation results of entropy weight method show that , The weight of antenatal examination rate is 29.447%、 The weight of maternal mortality is 36.344%、 The weight of perinatal mortality is 34.209%, The maximum weight of the index is the maternal mortality (36.344%), The minimum value is the antenatal examination rate (29.447%).
Output results 2: Rank value calculation
analysis :X1、X2、X3 It is the result of normalizing the original data in the same direction ,R1、R2、R3 The result of non integral rank coding on the original data .
Output results 3:RSR Distribution table

Chart description : The purpose of the above table is to calculate Probit value ,Probit The value is based on the percentage ( Evaluation rank number /n*100%) stay “ Comparison table of percentage and probability unit ” Got .
● take RSR Values are arranged in descending order ;
● List the frequency of each group ;
● Calculate the cumulative frequency of each group ;
● Identify groups RSR Rank of R And average rank R-;
● Calculate the downward cumulative frequency R- / n × 100 %, The last item is ( 1 − 1 / 4 n ) × 100 % correct ;
● According to the cumulative frequency , Inquire about “ Comparison table of percentage and probability unit ”, Find the corresponding probability unit Probit value ;
● Use... In the table RSR Distribution values as independent variables ,Probit Value as dependent variable , Do a linear regression , The results are shown in the table below .
PS: Detailed comparison table of percentage and probability unit :https://s0.spsspro.com/resources/images/ Comparison table of percentage and probability unit .png
Output results 4: Linear regression

*p<0.05,**p<0.01,***p<0.001
analysis : The probability unit value corresponding to the cumulative frequency Probit Independent variable , With RSR The value is the dependent variable , Calculate the regression equation .
from F The analysis of the test results can lead to , Significance P The value is 0.001**, The level is significant , The regression coefficient is rejected 0 The original hypothesis of , At the same time, the goodness of fit of the model R² by 0.763, The model performs well , Therefore, the model basically meets the requirements . For the collinearity of variables ,VIF All less than 10, So the model has no multicollinearity problem , The model is well constructed . For the collinearity of variables ,VIF All less than 10, So the model has no multicollinearity problem , The model is well constructed .
The formula of the model is as follows : RSR=-0.39+0.203*Probit
Output results 5: Fitting effect picture

Chart description : The figure above shows the original data of this model 、 Model fitting value 、 Model predictions .
Output results 6: Table of critical values for grading sorting

Chart description : The purpose of this step is to get the table of critical values for grading sorting , In especial Probit The critical value corresponds to RSR critical value ( Fit value ); First of all : Percentile threshold and Probit The critical value varies according to the number of levels , These two terms are fixed values and correspond exactly to each other ; second : In the table above RSR critical ( Fit value ) It's based on Probit The critical value is calculated by substituting it into the regression model .
Output results 7: Summary of grading results

Chart description : Grading Level The larger the number, the higher the level , The better the effect . According to the three grades of the results in the above table , region D And regions F Of pregnant women do the best health care , And the region H Of pregnant women do the worst health care .
7、 matters needing attention
If in SPSSPRO Rank sum ratio test , It is hoped that each indicator has a weight ( If there is no weight, it is called RSR, Weighted is called WRSR,RSR yes WRSR Is a special form ), You can select the variable weight on the input page “ Custom weights ” Set the variable weight at .
8、 Model theory
RSR The basic idea of law is : Rank the evaluation indexes , Take the average value of rank as the evaluation standard , It is applicable to the measurement of indicators in different measurement units Comprehensive evaluation of . RSR The basic steps of the method are :
step 1 Construct matrix : Suppose the evaluation object is n individual , The evaluation index is m individual , Build data matrix (n ×m).
step 2 Rank matrix :
(1) Whole rank sum ratio method : take n Of two evaluation objects m The evaluation indexes are arranged into n That's ok m Original data table for Columns . Compile the rank of each index and each evaluation object , Among them, the benefit type indicators are ranked from small to large , Cost indicators are ranked from large to small , Average rank of the same index data . Get the rank matrix , remember
![]()
(2) Non integral rank sum ratio method : To improve RSR The deficiency of rank method , There is a quantitative linear correspondence between the compiled rank and the original index value , To overcome RSR It is easy to lose the quantitative information of the original index value when ranking the method .
For benefit indicators :
![]()
For cost indicators :
![]()

Rij It's No i The... Of the first object j Rank of indicators ,Wj It means the first one j The weight of each indicator , The weight sum is 1.RSRi The greater the value of , It indicates that the better the evaluation object is .
step 4 Calculate the unit of probability
Rank to get RSR( or WRSR) Frequency distribution table , List the frequency of each group f, Calculate the cumulative frequency of each group cf And cumulative frequency p, Convert to probability units probit.
step 5 Calculate the linear regression equation
With probit The value is an argument , With RSR As the dependent variable , Calculate the linear regression equation .
step 6 Grading sort , Calculated according to the regression equation RSR(WRSR) The evaluation objects are sorted according to the estimated value .
9、 reference
[1] Tianfengdiao . Rank sum ratio method and its application [M]. Beijing China Statistics Press ,1993.
[2] Liu Haoran , Tang Shaoliang . be based on TOPSIS Study on the equalization level of basic medical services in Jiangsu Province by rank sum ratio method and rank sum ratio method [J]. Chinese general practice ,2016,19(7):819-823. DOI:10.3969/j.issn.1007-9572.2016.07.017.
10、 Learning Websites
SPSSPRO- Free professional online data analysis platform
Edited on 11-26 16:26
边栏推荐
- 黑馬暢購商城---3.商品管理
- Data Lake survey
- 分享7个神仙壁纸网站,让新的壁纸,给自己小小的雀跃,不陷入年年日日的重复。
- Manually rollback abnormal data
- The cloud native data lake has passed the evaluation and certification of the ICT Institute with its storage, computing, data management and other capabilities
- How far is it from the DBF of VFP to the web salary query system?
- The service layer reports an error. The XXX method invalid bound statement (not found) cannot be found
- Using DBF of VFP to web salary query system
- Kotlin基础
- 黑马畅购商城---6.品牌、规格统计、条件筛选、分页排序、高亮显示
猜你喜欢
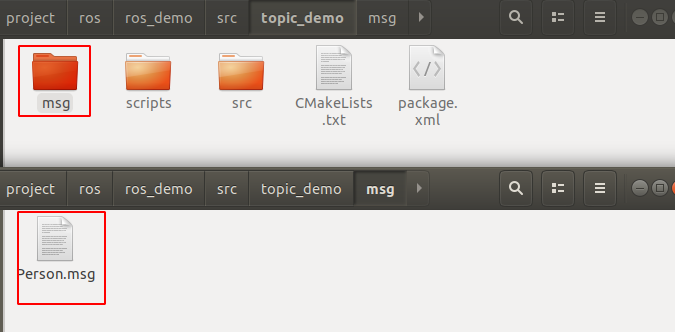
ROS 笔记(06)— 话题消息的定义和使用

Why can't you Ping the website but you can access it?
为什么ping不通网站 但是却可以访问该网站?
Application of analytic hierarchy process in college teaching evaluation system (principle + example + tool)

一套自动化无纸办公系统(OA+审批流)源码:带数据字典

VFP serial port communication is difficult for 9527. Maomao just showed his skill and was defeated by kiss

What are redis avalanche, penetration and breakdown?

黑马畅购商城---1.项目介绍-环境搭建

一款好用的印章设计工具 --(可转为ofd文件)

优品购电商3.0微服务商城项目实战小结
随机推荐
R语言使用epiDisplay包的followup.plot函数可视化多个ID(病例)监测指标的纵向随访图、使用stress.type参数指定强调线的id子集的线条的类型(type)
Under what circumstances will Flink combine operator chains to form operator chains?
Is the online stock trading account opening ID card information safe?
Explain websocket protocol in detail
Kotlin学习笔记
Web project development process
Is it safe to open an account and buy stocks? Who knows
R语言caTools包进行数据划分、scale函数进行数据缩放、e1071包的naiveBayes函数构建朴素贝叶斯模型
依概率收敛
Application of analytic hierarchy process in college teaching evaluation system (principle + example + tool)
Thirty lines of code prevent VFP forms from running repeatedly, and the function supports parameter transfer
20、wpf之MVVM命令绑定
Openfeign uses
Thingpanel publie le client mobile IOT (Multi - images)
一个硬件工程师走过的弯路
网络 | traceroute,路由跟踪命令,用于确定 IP 数据包访问目标地址所经过的路径。
ArcGIS services query filter by time field
一套自动化无纸办公系统(OA+审批流)源码:带数据字典
Update of complex JSON in MySQL
MYSQL中对复杂JSON的更新