当前位置:网站首页>(subplots usage) Matplotlib how to draw multiple subgraphs (axis field)
(subplots usage) Matplotlib how to draw multiple subgraphs (axis field)
2022-07-03 05:09:00 【Interval】
import matplotlib.pyplot as plt
# Prepare the data .
x=np.arange(3)
y1=np.random.rand((3))
y2=np.random.rand((3))
rough
# Get the plot area and subgraph .
fig,(ax1,ax2)=plt.subplots(1,2,figsize=(10,4))# Specify the drawing area as (10,4), And one row and two columns , By default, the two columns each occupy half , namely (5,4)(5,4)
ax1.plot(x,y1)
ax2.plot(x,y2)

fine
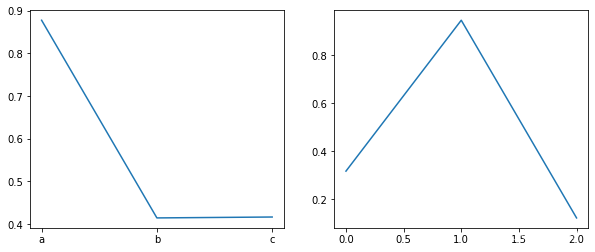
1. scale
The scale sum of the subgraph plt The use of that scale is different .
The latter is :
plt.xticks(x,label)# You can go to x Fill in label value .
But the usage of subgraph is :
ax1.set_xticks(x)# stay x Mark the number at the position of .
ax1.set_xticklabels(label)# stay x Mark label at .
The effect is as follows :
# Get the plot area and subgraph .
fig,(ax1,ax2)=plt.subplots(1,2,figsize=(10,4))# Specify the drawing area as (10,4), And one row and two columns , By default, the two columns each occupy half , namely (5,4)(5,4)
ax1.plot(x,y1)
ax2.plot(x,y2)

ax1.set_xticks(x)# stay x Mark the number at the position of .
# ax1.set_xticklabels(label)# stay x Mark label at .

# Get the plot area and subgraph .
fig,(ax1,ax2)=plt.subplots(1,2,figsize=(10,4))# Specify the drawing area as (10,4), And one row and two columns , By default, the two columns each occupy half , namely (5,4)(5,4)
ax1.plot(x,y1)
ax2.plot(x,y2)

ax1.set_xticks(x)# stay x Mark the number at the position of .
label=["a","b","c"]
ax1.set_xticklabels(label)# stay x Mark label at .
2. size
Now we can see , The whole drawing area we set up above is (10,4), Then the default is half , So how to finely control the size of each subgraph ?
# Get the plot area and subgraph .
fig,(ax1,ax2)=plt.subplots(1,2,figsize=(10,4))# Specify the drawing area as (10,4), And one row and two columns , By default, the two columns each occupy half , namely (5,4)(5,4)
ax1.plot(x,y1)
ax2.plot(x,y2)

ax1.set_position((0.1,0.1,0.8,0.8))# take ax1 The lower left corner of is placed in the drawing area 0.1,0.1 Location (0.1 Refers to the drawing area 10% It means ).ax1 After the lower left corner of is placed , Wide for 80%, High for 80%. Be careful , here ax1 The position of the upper right corner of is 0.9,0.9.
ax2.set_position((0.9,0.9,0.1,0.1))# So here from 0.9 Start , Otherwise it will overlap . Then only account for 0.1, Just finished drawing area .

You can see , A big , One small .
trick
In fact, if you have time , Subgraphs ( Axis domain ) The official document of this class says ,axes Other properties can be seen https://matplotlib.org/stable/api/axes_api.html?highlight=axes#module-matplotlib.axes.
All in all , Have the thought of class ,axes( Subgraphs ) Is in figure( canvas ) Medium . Then why is it difficult to learn when it comes to drawing ? My feeling is that the official for the convenience of everyone , Building subgraphs , We are not going to construct axes class , Instead, call a variety of methods , For example, above
subplots()
It looks like , Easy to get started , Convenient for novices , But it has greatly damaged the understanding of advanced people , Ah .
According to the thought of class , We should be as follows :
First create the drawing area object figure, Then pass this object and the location of the subgraph axes Class in the constructor , Get the subgraph . Then draw .
边栏推荐
- Thesis reading_ ICD code_ MSMN
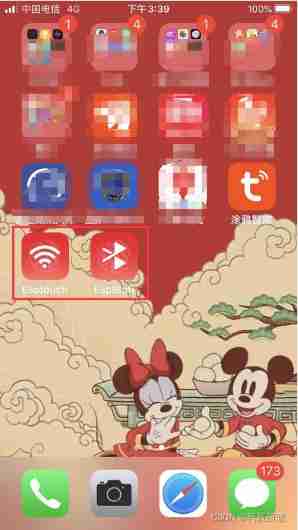
- appium1.22.x 版本後的 appium inspector 需單獨安裝
- Yolov5 network structure + code + application details | CSDN creation punch in
- Automatic voltage rise and fall 5-40v multi string super capacitor charging chip and solution
- 1087 all roads lead to Rome (30 points)
- [basic grammar] C language uses for loop to print Pentagram
- Detailed explanation of yolov5 training own data set
- Notes | numpy-11 Array operation
- Make your own dataset
- Caijing 365 stock internal reference: what's the mystery behind the good father-in-law paying back 50 million?
猜你喜欢

leetcode406. Rebuild the queue based on height
Esp32-c3 learning and testing WiFi (II. Wi Fi distribution - smart_config mode and BlueIf mode)
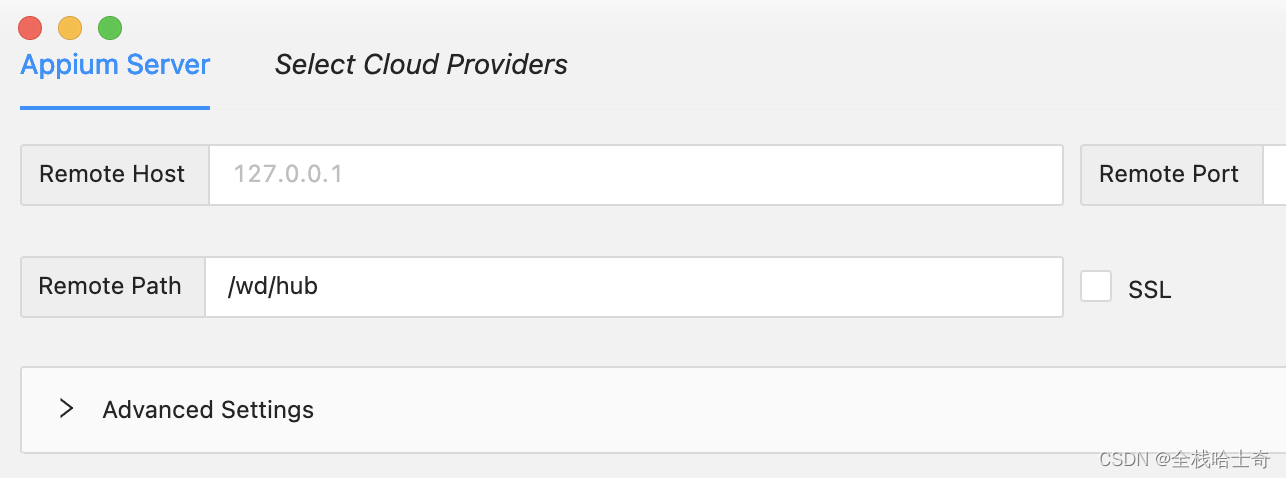
Appium 1.22. L'Inspecteur appium après la version X doit être installé séparément
![[set theory] relationship properties (common relationship properties | relationship properties examples | relationship operation properties)](/img/af/8dfa783c87363a9d75c52e7680d508.jpg)
[set theory] relationship properties (common relationship properties | relationship properties examples | relationship operation properties)

How to connect the network: Chapter 1 CSDN creation punch in
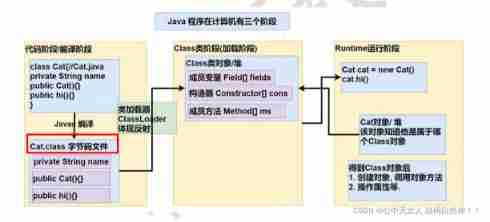
Basic knowledge of reflection (detailed explanation)
Audio Focus Series: write a demo to understand audio focus and audiomananger
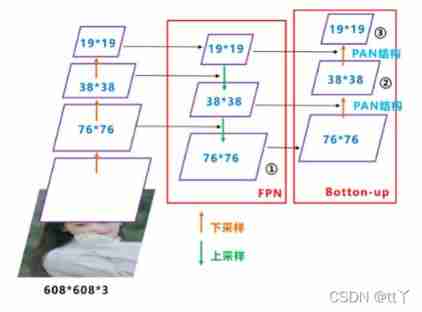
Pan details of deep learning

【批处理DOS-CMD命令-汇总和小结】-CMD窗口的设置与操作命令-关闭cmd窗口、退出cmd环境(exit、exit /b、goto :eof)
Without 50W bride price, my girlfriend was forcibly dragged away. What should I do
随机推荐
Wechat applet waterfall flow and pull up to the bottom
cookie session jwt
[research materials] the fourth quarter report of the survey of Chinese small and micro entrepreneurs in 2021 - Download attached
[set theory] relation properties (transitivity | transitivity examples | transitivity related theorems)
"Pthread.h" not found problem encountered in compiling GCC
The consumption of Internet of things users is only 76 cents, and the price has become the biggest obstacle to the promotion of 5g industrial interconnection
Yolov5 input (I) -- mosaic data enhancement | CSDN creative punch in
Basic use of Metasploit penetration testing framework
Yolov5 input (II) | CSDN creative punch in
Chapter II program design of circular structure
1095 cars on campus (30 points)
Sprintf formatter abnormal exit problem
[backtrader source code analysis 5] rewrite several time number conversion functions in utils with Python
50 practical applications of R language (36) - data visualization from basic to advanced
JS scope
Wechat applet distance and map
M1 Pro install redis
Detailed explanation of yolov5 training own data set
ZABBIX monitoring of lamp architecture (3): zabbix+mysql (to be continued)
Review the configuration of vscode to develop golang