当前位置:网站首页>[excel] PivotChart
[excel] PivotChart
2022-07-04 05:37:00 【When camellia flowers bloom.】
The PivotChart is Excel A very convenient dynamic chart tool
When we need to carry out data statistics and analysis according to the data source with a large amount of data , You can use PivotTables with PivotCharts , With the help of PivotChart to meet the needs of various visual display and data analysis
We can directly create a PivotChart according to the PivotTable , The PivotTable and PivotChart generated in this way share a data cache , It can automatically realize linkage update
This article exercises the data source of PivotChart
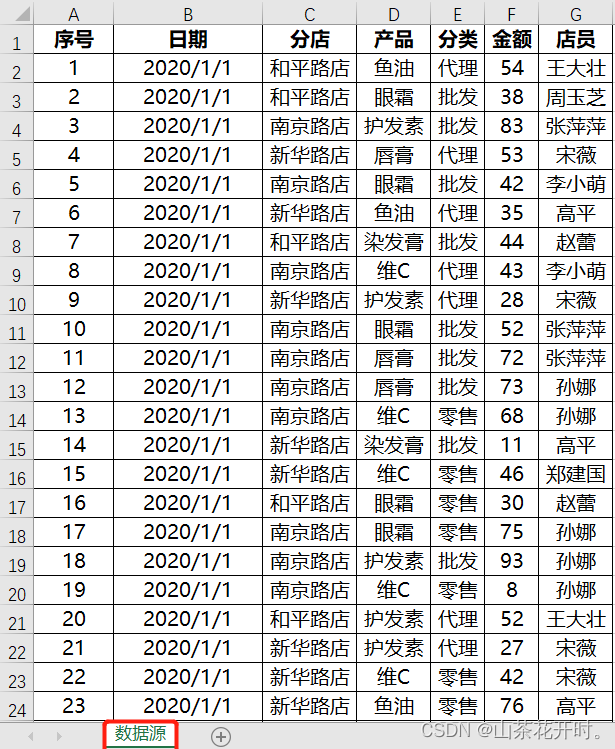
PivotChart ( data source )
https://download.csdn.net/download/Hudas/85504246?spm=1001.2014.3001.5503
 https://download.csdn.net/download/Hudas/85504246?spm=1001.2014.3001.5503
An enterprise 2020 Annual sales data is placed in " data source " In the worksheet , Part of the data is shown in the figure below :
problem 1: Check all months of the year according to the above data sources (1 month -12 month ) Changes in sales Trends
Ideas : Use Broken line diagram Meet the display needs of sales trends
1. Create a PivotTable report based on the data source , The results are shown in the following figure :

2. Create a PivotChart

3. The PivotTable created is as follows , The position of the chart 、 Size and various chart elements support custom settings , The chart type can also be changed as needed

problem 1.2: Check the sales comparison between months
Ideas : The above line chart can be changed to Bar charts

Be careful
What we use here " PivotChart tools " Tabs are contextual tabs , Only when PivotChart is selected will it be displayed on the ribbon , When you navigate to a blank cell , This tab is automatically hidden
The PivotChart after changing the chart type is as follows :

According to the actual demand , Flexibly change the chart type of PivotChart , Meet various data analysis needs of users
problem 2: Beautify the PivotChart
1. Select PivotChart , single click " Design " tab , stay " Chart style " To choose from , When the mouse pointer hovers over the chart style , The chart preview of this style will be displayed automatically , Click the chart style to automatically beautify the PivotChart

2. The PivotChart automatically beautified with chart style is as follows

3. PivotChart has many more filtering buttons than ordinary charts in appearance , Too many filter buttons in the chart will affect the professionalism and cleanliness of the business chart , You can hide these filter buttons

4. The PivotChart after hiding the filter button is shown below

4. Modify chart title 、 Resize the chart

problem 3: Insert slicer to update PivotTable and PivotChart
PivotChart is created on the basis of PivotTable , That is, the data source of PivotChart is PivotTable
Example , Update the PivotTable and PivotChart according to the specified branches and products 、 see
1. Select any cell in the PivotTable ( Such as A3 Cell ), Insert slicer , The operation steps are as follows

2. Select the corresponding project in the slicer according to the actual needs ( Such as " Branch " and " product ") Check box

3. Adjust the position and size of the slicer , Make the whole report layout neat

4. Use slicers to dynamically filter according to user needs , Make PivotTable and PivotChart update together , If you want to check the fish oil in Nanjing Road store throughout the year 12 Month sales comparison , The filtered effect picture is as follows

5. The inserted slicer can not only adjust the position and size , And you can adjust the vertical and horizontal arrangement styles of items in the slicer as needed . for example , If you want to " Branch " The items in the slicer are distributed horizontally , The number of columns can be changed from 1 Change to 3

6. After adjusting the number of columns in the slicer , Readjust the size and position of the slicer

7. In order to make the whole interface more concise 、 major , You can hide unnecessary information , Such as the title of slicer " Branch ". The method is to select the slicer , And then click " Slicer settings " Button

8. eject " Slicer settings " Dialog box

9. Set it up " Branch " Behind slicer , Use the same method to set " product " Slicer , Then readjust the chart layout and slicer position , Embed slicer in PivotChart area , It is convenient for users to filter directly according to their needs

边栏推荐
- Notepad++ -- display related configurations
- Simulink与Arduino串口通信
- LM小型可编程控制器软件(基于CoDeSys)笔记二十一:错误3703
- The data mark is a piece of fat meat, and it is not only China Manfu technology that focuses on this meat
- IP时代来临,电竞酒店如何借好游戏的“东风”?
- PostgreSQL has officially surpassed mysql. Is this guy too strong!
- 如何使用postman实现简单的接口关联【增删改查】
- VB. Net simple processing pictures, black and white (class library - 7)
- Build an Internet of things infrared temperature measuring punch in machine with esp32 / rush to work after the Spring Festival? Baa, no matter how hard you work, you must take your temperature first
- [matlab] communication signal modulation general function - low pass filter
猜你喜欢

LM小型可编程控制器软件(基于CoDeSys)笔记二十二:错误4268/4052

Void convolution, deformable convolution, deformable ROI pooling

VB.net GIF(制作、拆解——优化代码,类库——5)
![BUU-Crypto-[GUET-CTF2019]BabyRSA](/img/87/157066155e8d3a93e30a68eaf1781b.jpg)
BUU-Crypto-[GUET-CTF2019]BabyRSA
LM small programmable controller software (based on CoDeSys) note 22: error 4268/4052

Introduction To AMBA 简单理解

2022危险化学品经营单位安全管理人员上岗证题库及答案

LM small programmable controller software (based on CoDeSys) note XXI: error 3703

724. 寻找数组的中心下标

Unity is connected to the weather system
随机推荐
SQL performance optimization skills
724. Find the central subscript of the array
LabVIEW错误对话框的出现
[wechat applet] template and configuration (wxml, wxss, global and page configuration, network data request)
Zhanrui tankbang | jointly build, cooperate and win-win zhanrui core ecology
Trie number dictionary tree
Solar insect killing system based on single chip microcomputer
[matlab] general function of communication signal modulation - generation of narrow-band Gaussian white noise
2022年R2移动式压力容器充装复训题库及答案
总线的基本概念
Viewing and using binary log of MySQL
Build an Internet of things infrared temperature measuring punch in machine with esp32 / rush to work after the Spring Festival? Baa, no matter how hard you work, you must take your temperature first
BUU-Pwn-test_ your_ nc
[paper summary] zero shot semantic segmentation
Flutter ‘/usr/lib/libswiftCore. dylib‘ (no such file)
FreeRTOS 中 RISC-V-Qemu-virt_GCC 的 锁机制 分析
Unity2D--人物移动并转身
Topological sorting and graphical display of critical path
Halcon图片标定,使得后续图片处理过后变成与模板图片一样
Analysis of classical pointer and array written test questions in C language