当前位置:网站首页>[R] Use grafify for statistical plotting, ANOVA, intervention comparisons, and more!
[R] Use grafify for statistical plotting, ANOVA, intervention comparisons, and more!
2022-08-03 13:09:00 【Demeanor 78】
 This suggests a high qualityR包grafify,
grafifyFunction displays in the following aspects:
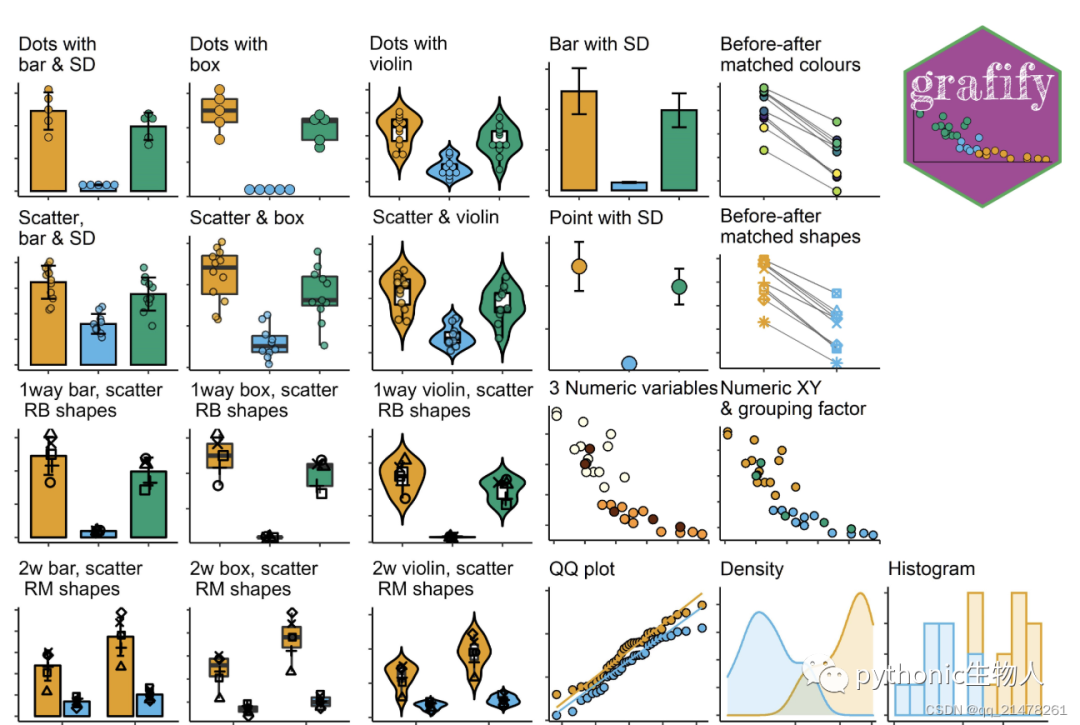
A few lines of code to draw the high level of appearance statistical chart,支持6大类,19种图表 (见上图);
The palette that contains high identification,可与ggplot2良好兼容;
Support the variance analysis (ANOVA),Including randomized block and repeated measurement design;
Support the changes before and after the intervention more (post-hoc comparisons);
模拟1-way和2-way ANOVA设计.
grafify调色盘
Support the following palette,Contains qualitative color scheme(Qualitative colormaps)如okabe_ito、r4Such as color scheme and order(Sequential colormaps)如grey_conti等.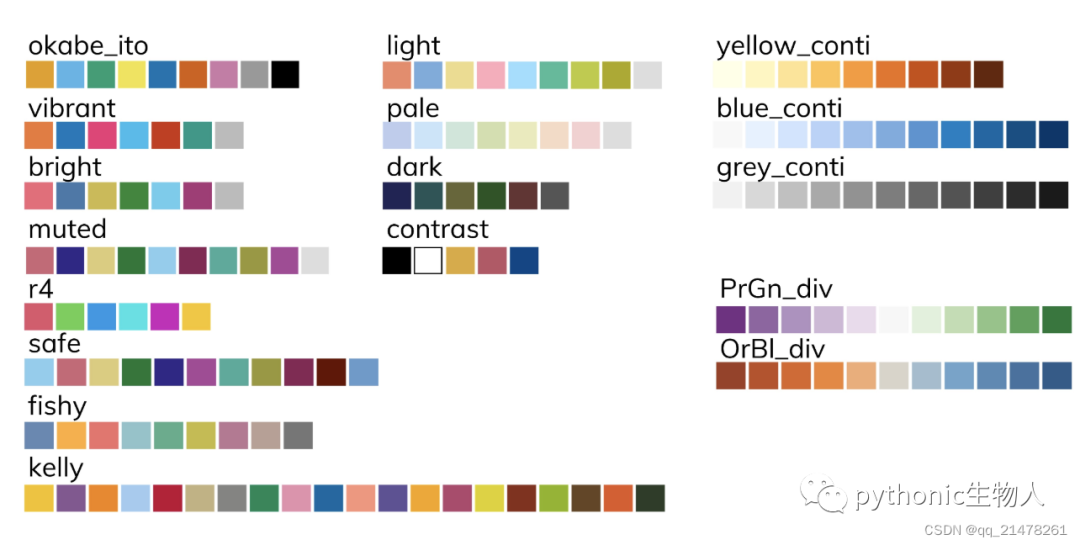 使用方法类似ggplot2,参考 R可视化07|ggplot2图层-标度图层(scale layer)-颜色盘篇
plot_grafify_palette(palette = "kelly") #查看kellyAll color palette number value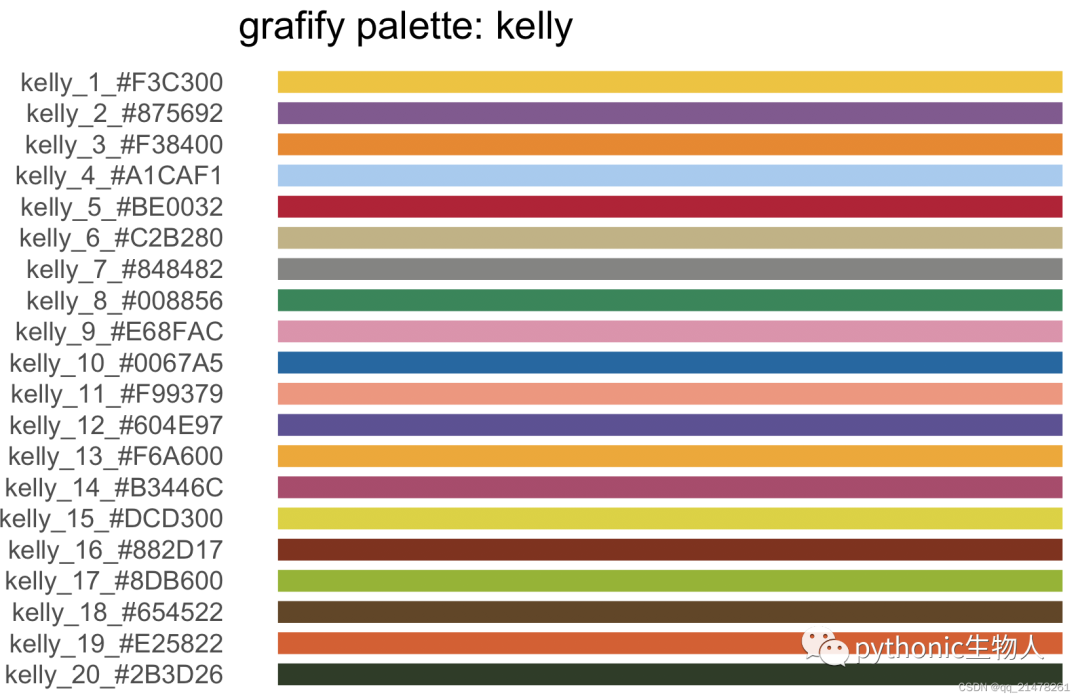
grafify:::graf_palettes #输出grafifyAll the palette color value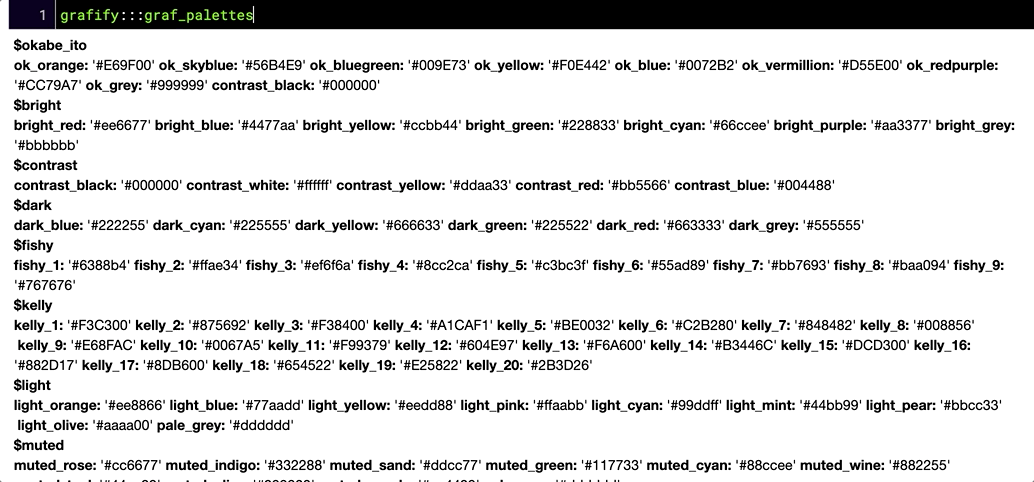
grafify绘制统计图
Statistical figure correspondingRealization method are below the red box里了,Need the class diagram,Use the figure above functions,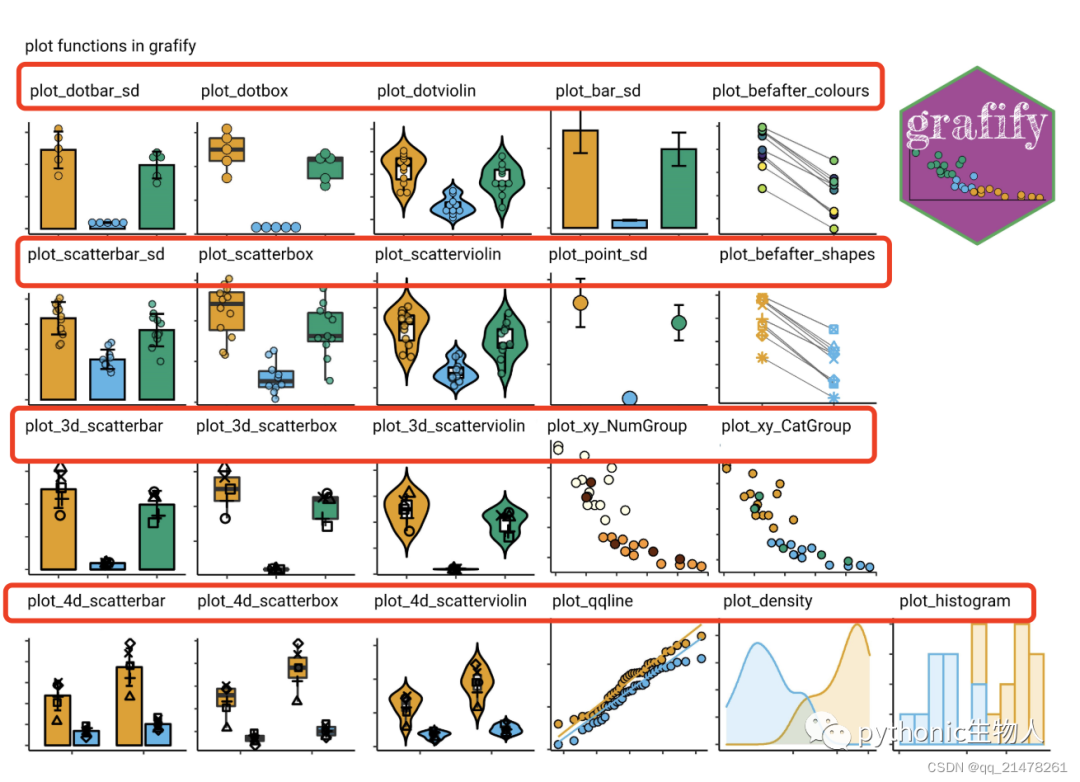 下面简单举例,说明grafify的使用:
demo0
plot_4d_scatterbar()实现3或4个分类变量bar图,
plot_4d_scatterbar(data_2w_Tdeath,
                   Genotype,
                   PI,
                   Time,
                   Experiment,
                   b_alpha = 0.7,
                   ColPal = "vibrant")+
  scale_colour_manual(values = c("black", "grey20"))+
  labs(title = "2way/RM, bars/SD",
       subtitle = "(shapes = randomised blocks)")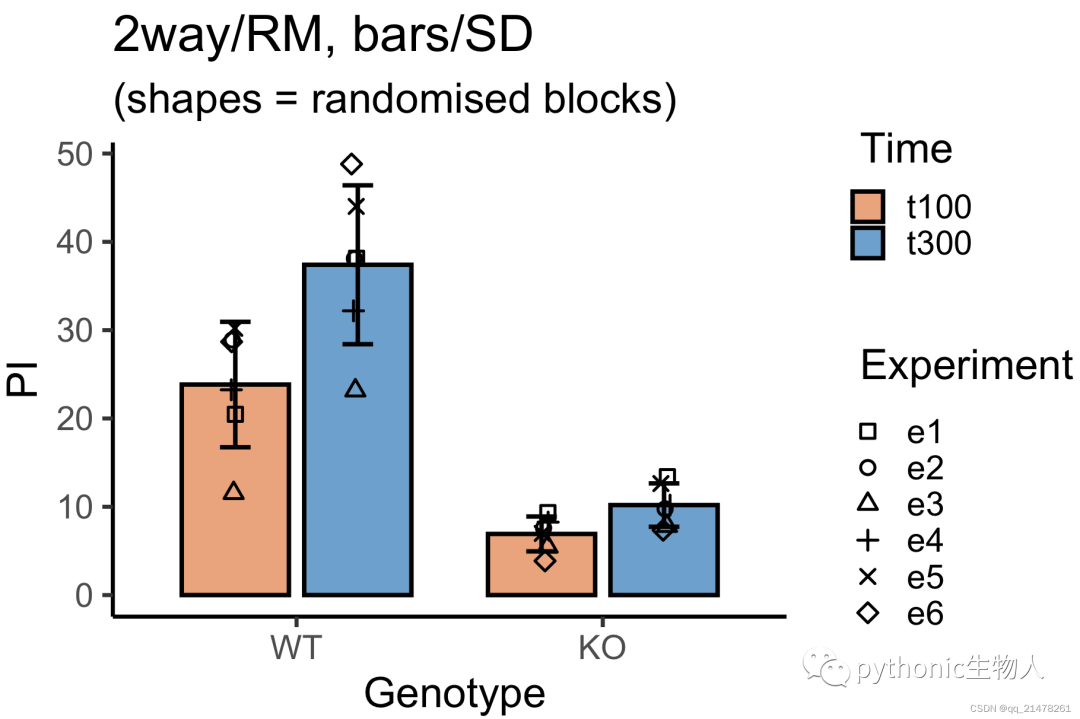
demo1
Map a combination:bar图+散点图+SD,plot_scatterbar_sd()可轻松搞定
library('grafify') # 导入包
plot_scatterbar_sd(data = data_doubling_time,#使用内置数据集data_doubling_time
                   xcol = Student,           # 指定X轴变量
                   ycol = Doubling_time,     # 指定Y轴变量
                   SingleColour = "r4_1")+ # 指定颜色,Take child palette herer4
                   labs(title = "Scatter+bar+SD") # 设置标题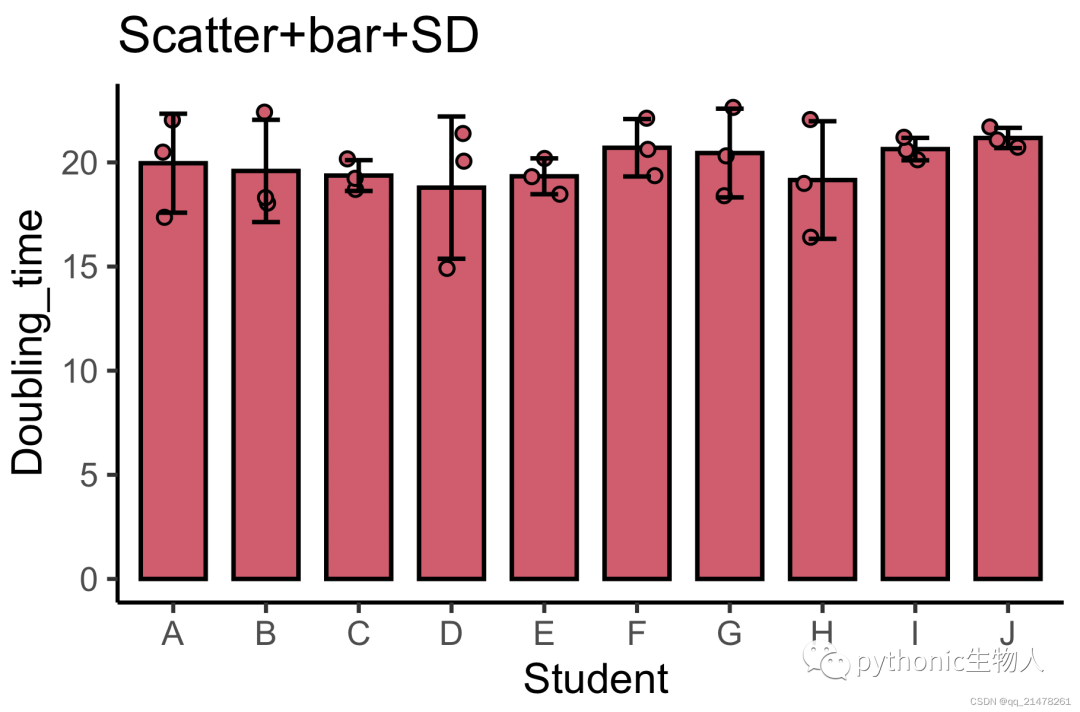
demo2
QQ图:使用plot_qqline()即可,
plot_qqline(data_t_pratio,
            log(Cytokine),
            Genotype)+
            labs(title = "QQ plot with plot_qqline()")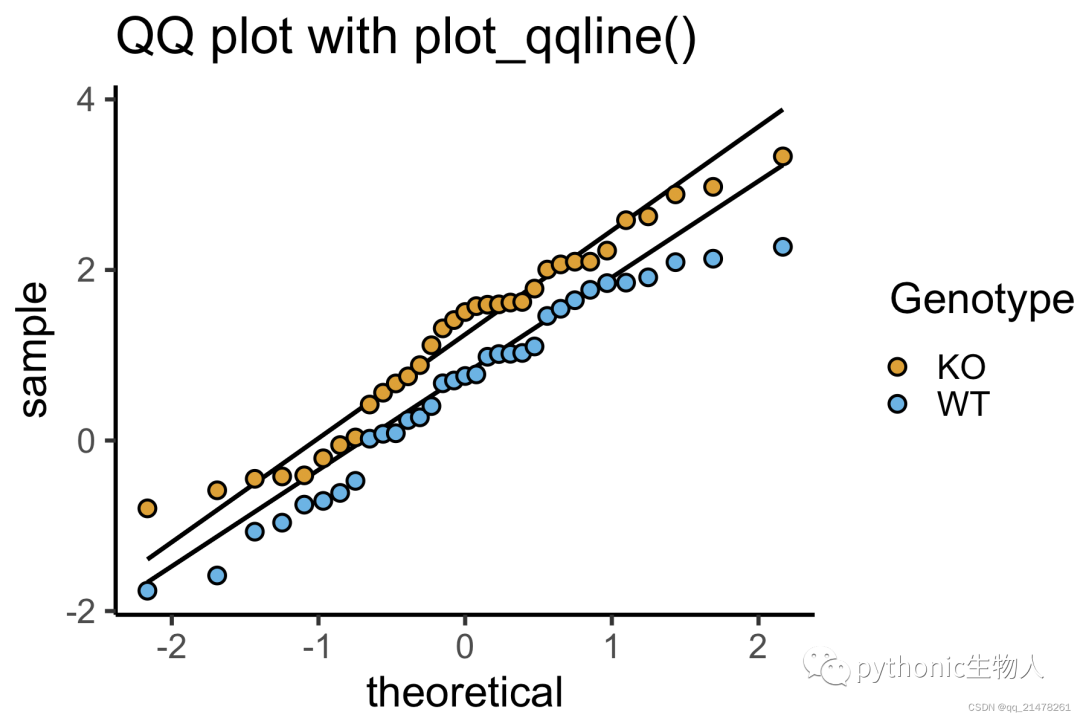
demo3
Clinical a chart:SCIThe article as well as a chart comparing the changes before and after the intervention,grafify中plot_befafter_colours()可轻松实现,
plot_befafter_colours(data = data_t_pdiff,
                      xcol = Condition,
                      ycol = Mass,
                      match = Subject,
                      symsize = 5,
                      ColPal = "r4",
                      ColRev = T)+
  labs(title = "TBefore-after with plot_befafter_colours")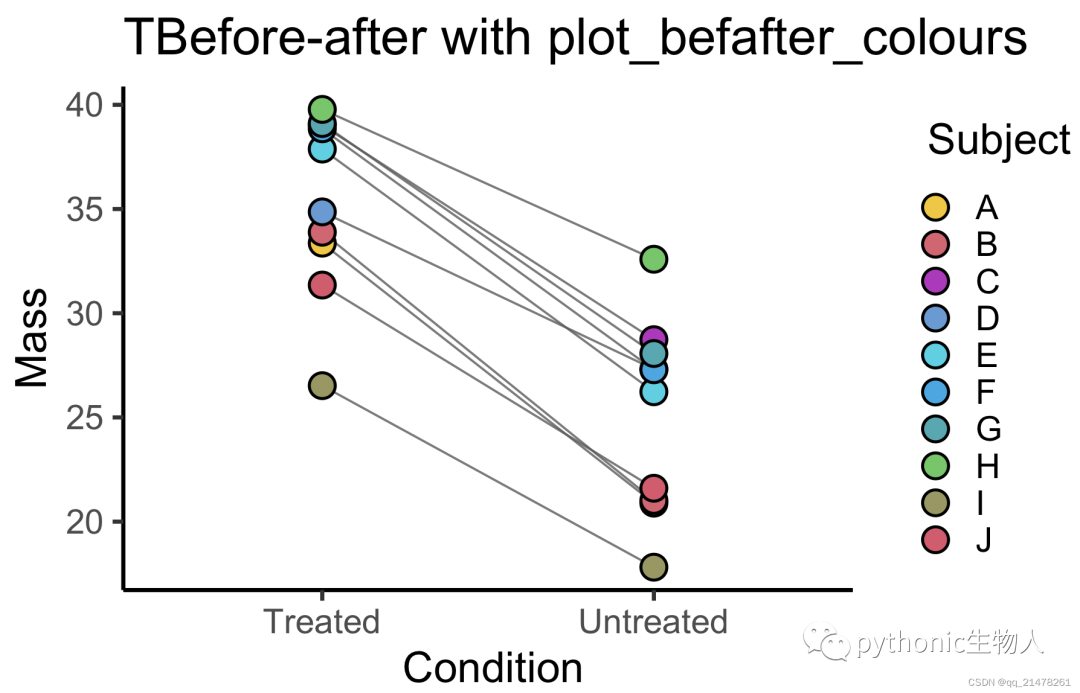
demo4
plot_xy_NumGroup()
plot_xy_NumGroup(dplyr::filter(diamonds, cut == "Premium" & clarity == "SI1"),
                 depth,
                 price,
                 carat,
                 s_alpha = .5,
                 ColPal = "grey_conti")+ #colschem
  labs(title = "plot_xy_NumGroup()")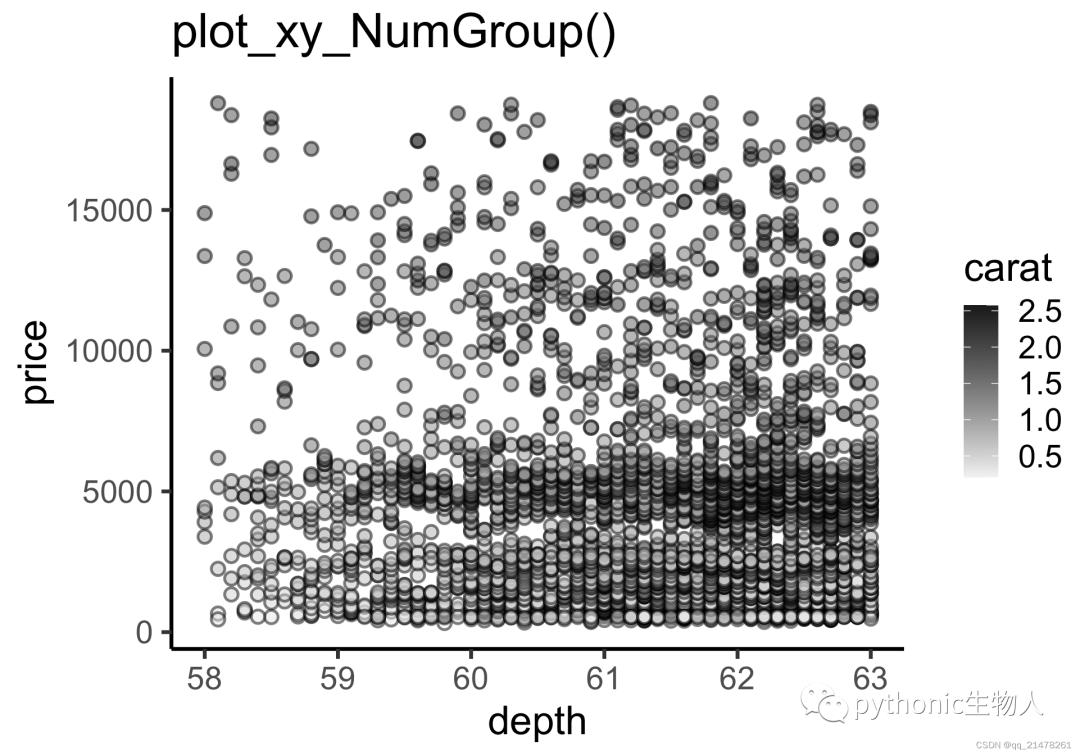
grafify方差分析
This part is not in detail,The categories of main supportANOVA:
Simple linear models: One-way ANOVA, Two-way ANOVAMixed effects models: One-way ANOVA & randomised blocks,Two-way ANOVA & randomised blocks,Two-way ANOVA, repeated-measures & randomised blocksPosthoc comparisons:posthoc_Pariwise, posthoc_Levelwise, posthoc_vsRef
参考:https://github.com/ashenoy-cmbi/grafify

往期精彩回顾


适合初学者入门人工智能的路线及资料下载(图文+视频)机器学习入门系列下载机器学习及深度学习笔记等资料打印《统计学习方法》的代码复现专辑机器学习交流qq群955171419,加入微信群请扫码
边栏推荐
- 业界新标杆!阿里开源自研高并发编程核心笔记(2022最新版)
- 技术分享 | 接口自动化测试如何搞定 json 响应断言?
- Kubernetes 网络入门
- 易观分析:2022年Q2中国网络零售B2C市场交易规模达23444.7亿元
- [Verilog] HDLBits Problem Solution - Verification: Writing Testbenches
- Graphic animation and button animation of an animation basic component
- leetcode/字符串中的所有变位词(s1字符串的某个排列是s2的子串)的左索引
- R language ggplot2 visualization: use the patchwork bag plot_layout function will be more visual image together, ncol parameter specifies the number of rows, specify byrow parameters configuration dia
- An工具介绍之骨骼工具
- GameFi industry down but not out | June Report
猜你喜欢


随机推荐
Sogou news-数据集
PyTorch构建神经网络预测气温(数据集对比,CPU与GPU对比)
PolarFormer: Multi-camera 3D Object Detection with Polar Transformers 论文笔记
来广州找工作有一个多月了,今天终于有着落了,工资7000
An introduction to the skeleton tool
长江商业银行面试
Oracle is installed (system disk) and transferred from the system disk to the data disk
YOLOv5 training data prompts No labels found, with_suffix is used, WARNING: Ignoring corrupted image and/or label appears during yolov5 training
leetcode16最接近的三数之和 (排序+ 双指针)
[Blue Bridge Cup Trial Question 48] Scratch Dance Machine Game Children's Programming Scratch Blue Bridge Cup Trial Question Explanation
基于php旅游网站管理系统获取(php毕业设计)
AMS simulation
【Verilog】HDLBits题解——验证:阅读模拟
Key points for account opening of futures companies
秋招招工作
An动画基础之元件的图形动画与按钮动画
Database basics one (MySQL) [easy to understand]
Feature dimensionality reduction study notes (pca and lda) (1)
Yahoo! Answers-数据集
实数取整写入文件(C语言文件篇)