当前位置:网站首页>ANR Application Not Responding
ANR Application Not Responding
2022-06-28 18:42:00 【Novice Xiaowang】
ANR Full name Application Not Responding
One 、ANR Cause of occurrence .
Only when the application UI Thread response timeout will cause ANR, The causes of timeout are generally 2 Kind of .
● The current event has no chance to be handled
● The current event is being processed , But it took too long to finish in time
Two 、ANR The classification of ( Three ).
1.KeyDispatchTimeout: The most common type , as a result of View The key event or touch event of 5 No response in seconds .
2.BroadcastTimout: The reason is that the broadcast receiver (BrocastReceiver) Of onReceive() Function at a specific time (10 second ) Unable to complete processing .
3.ServiceTimeout: The reason is service (Service) At a specific time (20 second ) Processing cannot be completed within .
 a.View Click events or touch events at a specific time (5s) Unable to get a response within

 b. The main thread is executing BroadcastReceiver Of onReceive() Function time 10 Not processed in seconds

 c. The main thread is in Service Each life cycle function of 20 Not processed in seconds .
3、 ... and 、 Typical ANR Problem scenario .
1. Applications UI Threads have time-consuming operations , For example, in UI Network request in thread , Database operation or file operation, etc , May lead to UI Threads cannot process user input in time .
2. Applications UI A thread waits for a child thread to release a lock , Thus, the input requested by the user cannot be processed .
3. Time consuming animation requires a lot of computational work , May lead to CPU Too much load .
Four 、ANR Positioning and analysis of .
1.LogCat Log information .
2. Inside the cell phone anr file ( be located /data/anr/). for example anr_2022-06-27-12-47-52-079
----- pid 8418 at 2022-06-27 12:47:52 ----- pid  When does it appear anr
Cmd line: com.example.testdemo               Corresponding   Package name


"main" prio=5 tid=1 Sleeping
  | group="main" sCount=1 dsCount=0 flags=1 obj=0x71b2a1f0 self=0xf1e5ce00
  | sysTid=8418 nice=-10 cgrp=default sched=0/0 handle=0xf238bdc0
  | state=S schedstat=( 1176699784 74358829 585 ) utm=110 stm=6 core=3 HZ=100
  | stack=0xff2d2000-0xff2d4000 stackSize=8192KB
  | held mutexes=
  at java.lang.Thread.sleep(Native method)
  - sleeping on <0x0d9beb8e> (a java.lang.Object)
  at java.lang.Thread.sleep(Thread.java:440)
  - locked <0x0d9beb8e> (a java.lang.Object)
  at java.lang.Thread.sleep(Thread.java:356)
  at com.example.testdemo.MainActivity$1.onClick(MainActivity.java:19)
  at android.view.View.performClick(View.java:7140)
  at com.google.android.material.button.MaterialButton.performClick(MaterialButton.java:1194)
  at android.view.View.performClickInternal(View.java:7117)
  at android.view.View.onKeyUp(View.java:14165)
  at android.widget.TextView.onKeyUp(TextView.java:8543)
  at android.view.KeyEvent.dispatch(KeyEvent.java:2825)
  at android.view.View.dispatchKeyEvent(View.java:13374)
  at android.view.ViewGroup.dispatchKeyEvent(ViewGroup.java:1922)
  at android.view.ViewGroup.dispatchKeyEvent(ViewGroup.java:1922)
  at android.view.ViewGroup.dispatchKeyEvent(ViewGroup.java:1922)
  ... repeated 2 times
"main" prio=5 tid=1 Sleeping
Represent the thread name, thread Priority, DVM thread id, DVM thread status
"main" :main thread -> activity thread
prio :java thread priority default is 5, ( The normal area is 1-10)
tid: yes DVM thread id, No linux thread id( Next line sysTid It's just )
Native:DVM thread Status These states are normal (ZOMBIE, RUNNABLE, TIMED_WAIT, MONITOR, WAIT, INITALIZING,STARTING, NATIVE, VMWAIT, SUSPENDED,UNKNOWN)
group="main" sCount=1 dsCount=0 flags=1 obj=0x416eaf18 self=0x416d8650
representative DVM thread status.
group: Is the thread group of the thread default is “main”
sCount: The number of times the thread is normally suspended 1 (thread suspend count)
dsCount: Number of times the thread was suspended due to debugging 0 (thread dbg suspend count)
obj: Associated with the current thread java Thread object 0x75720fb8 (thread obj address)
sef: The address of the thread itself 0x7f7e8af800 (thread point address)
sysTid=30307 nice=0 sched=0/0 cgrp=apps handle=1074565528
representative Linux thread status Display thread scheduling information
sysTId: linux Local threads under the system id linux thread tid
Nice: Thread scheduling has priority linux thread nice value
cgrp: Priority group genus c group
sched: Scheduling strategy cgroup policy/gourp id
handle: Handle function address handle address
state=S schedstat=( 0 0 0 ) utm=5 stm=4 core=3
representative CPU Sched stat Show more of the thread's current context
state: Scheduling status process/thread state ( Normal yes "R (running)", "S (sleeping)", "D (disk sleep)", "T (stopped)", "t (tracing stop)", "Z (zombie)", "X (dead)", "x (dead)", "K (wakekill)", "W (waking)",), Usually average Process The state of being is S (sleeping), And if you find yourself in such a D (disk sleep), T (stopped), Z (zombie) It will be examined carefully after a while .
schedstat (Run CPU Clock/ns, Wait CPU Clock/ns, Slice times) The thread running information
utm: utime, user space time The time value used in thread user mode ( The unit is jiffies)
stm: stime, kernel space time The scheduling time value in kernel mode
core: now running in cpu. Finally, run the thread change cup identification
stack=0x7f7dc93000-0x7f7dc95000 stackSize=1020KB
Represents the stack address area and size
held mutexes=
Represents whether it is locked , Normal has four properties (mutexes: tll=0 tsl=0 tscl=0 ghl=0),0 Express unlock, All other values represent being lock,
tll: thread List Lock,
tsl: thread Suspend Lock,
tscl: thread Suspend Count Lock
ghl: gc Heap Lock
The rest is just some Call Stack
5、 ... and 、ANR To deal with
Three different situations , The general treatment is as follows
1. Main thread blocking
Open up separate sub threads to handle time-consuming blocking transactions .
2.CPU Full load , I/O Blocking
I/O Generally speaking, blocking means that file read / write or database operations are executed in the main thread , It can also be executed asynchronously by opening up sub threads .
3. Out of memory
increase VM Memory , Use largeHeap attribute , Check for memory leaks .
6、 ... and 、ANR Detection of
Use StrictMode
Strict mode StrictMode yes Android SDK A tool class provided to detect whether there are illegal operations in the code ,StrictMode It mainly detects two types of problems .
- Thread strategy ThreadPolicy
- detectCustomSlowCalls: Detect custom time-consuming actions
- detectDiskReads: Detect if there is a disk read operation
- detectDiskWrites: Check whether there is a disk write operation
- detectNetWork: Detect whether there is network operation
- Virtual machine policy VmPolicy
- detectActivityLeaks: Detect the presence of Activity Let the cat out of the
- detectLeakedClosableObjects: Check whether there are unclosed Closeable Object leakage
- detectLeakedSqlLiteObjects: Detect the presence of Sqlite Object leakage
- setClassInstanceLimit: Check whether the number of class instances exceeds the limit
You can see ,ThreadPolicy It can be used to detect possible mainline time-consuming operations , It should be noted that we can only Debug Use it in version , The version released to the market should be closed .StrictMode It's easy to use , We only need to initialize the application, for example Application perhaps MainActivity Class onCreate Method :
StrictMode.setThreadPolicy(new StrictMode.ThreadPolicy.Builder()
                .detectAll().penaltyLog().penaltyDialog().build());

StrictMode.setVmPolicy(new StrictMode.VmPolicy.Builder().detectAll()
.penaltyLog().build());

penaltyLog It means that Logcat Print log in ,
detectAll Method means to start all detection policies
BlockCanary
BlockCanary Is a non intrusive performance monitoring function library , Its usage and leakCanary similar , But the latter monitors memory leaks in applications , and BlockCanary It is mainly used to monitor the application main thread . Its basic principle is to use the message queue processing mechanism of the main thread , Determine whether the set time is exceeded by comparing the start and end time points of message distribution , If it is , It is judged that the main route is stuck . Its integration is simple
1. stay build.gradle Introduce dependency in
implementation 'com.github.markzhai:blockcanary-android:1.5.0'2. stay Application Class
BlockCanary.install(this,new MyBlockCanaryContext()).start();边栏推荐
- EasyCVR新建用户后,视频调阅页面不能点击的问题修复
- leetcode 1647. Minimum Deletions to Make Character Frequencies Unique(所有字母频率不同的最小删除次数)
- 1 invalid import format(s) Postman Collection Format v1 is no longer supported and can not be import
- 几行代码就能实现复杂的 Excel 导入导出,这个工具类真心强大!
- 安装nodejs环境
- 内存抖动
- 电子商务盛行,怎么提高商店转换率?
- WiFi安全漏洞KRACK深度解读
- Sword finger offer 11 Minimum number of rotation array
- [flask] update and delete crud of data
猜你喜欢

Chapter 2 processing files, cameras and GUI Cameo applications

【Unity3D】相机跟随

use. NETCORE's own background job, which simply simulates producers and consumers' processing of request response data in and out of the queue

Go, begin, end, for, after, instead of

tensorboard 使用总结

堆的概念和代码实现
Advanced technology management - how managers communicate performance and control risks

618活动季——百数低代码平台特享折扣来临

io模型初探
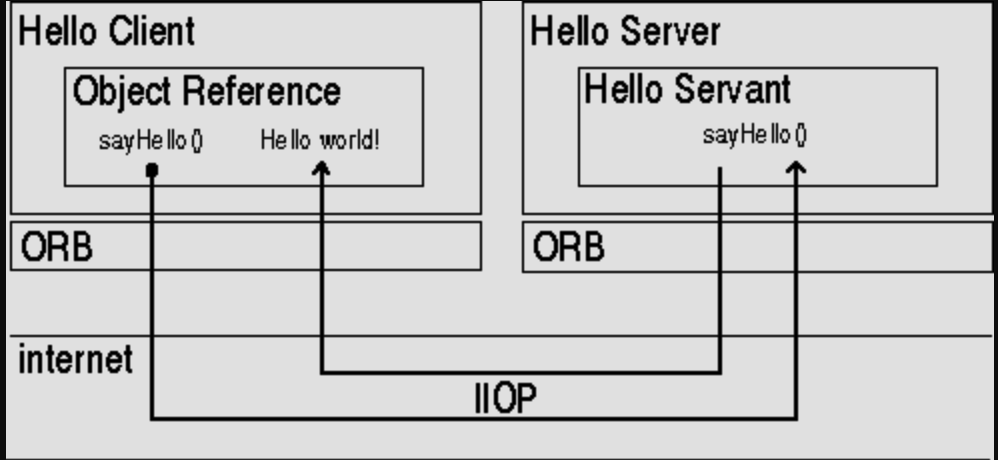
CORBA 架构体系指南(通用对象请求代理体系架构)
随机推荐
运筹学note
Analysis of response parsing process of SAP ui5 batch request
华为云AOM发布2.0版本,3大特性亮相
use. NETCORE's own background job, which simply simulates producers and consumers' processing of request response data in and out of the queue
【C#】详解值类型和引用类型区别
正版ST-link/V2 J-LINK JTAG/SWD引脚定义和注意事项
How to use the current conversion function in SAP CDs view
推荐两款超高质量的壁纸软件
Go descending sort takes top n
Yixin Huachen: real estate enterprises want to grasp the opportunity of the times for digital transformation
手动备份和还原DHCP服务器
leetcode 1423. Maximum Points You Can Obtain from Cards(从牌中能得到的最大点数和)
sqrt()函数的详解和用法「建议收藏」
Can I open an account today and buy shares today? Is it safe to open an account online?
上传文件列表(文件名重复加括号标识)
leetcode 1647. Minimum Deletions to Make Character Frequencies Unique(所有字母频率不同的最小删除次数)
Seata implementation of sharing JDBC distributed transaction
使用.NetCore自带的后台作业,出入队简单模拟生产者消费者处理请求响应的数据
第2章 处理文件、摄像头和图形用户界面cameo应用
向上转型和向下转型