当前位置:网站首页>Matlab paper illustration drawing template No. 42 - bubble matrix diagram (correlation coefficient matrix diagram)
Matlab paper illustration drawing template No. 42 - bubble matrix diagram (correlation coefficient matrix diagram)
2022-08-03 19:43:00 【Akun's research routine】
在上一篇文章中,分享了Matlab气泡图的绘制模板:

进一步,Suppose we want to visualize a table or matrix,That is, the bubbles are arranged in a matrix,And the size and color of each bubble represent the value of its corresponding feature,应该怎么操作呢?
Take a look at the finished product:

特别提示:Matlab论文插图绘制模板系列,旨在降低大家使用Matlab进行科研绘图的门槛,只需按照模板格式添加相应内容,即可得到满足大部分期刊以及学位论文格式要求的数据插图.如果觉得有用可以分享给你的朋友.
模板中最关键的部分内容:
1. 数据准备
此部分主要是读取数据,Generate matrix coordinate data.
% 读取数据load data.mat% Generate matrix coordinate data[r,c] = size(data);x = 1:c;y = 1:r;[xx,yy] = meshgrid(x,y);yy = flipud(yy);
其中,利用‘meshgrid’command to generate coordinate data for a matrix.
值得注意的是,在竖直方向,The index numbering order of the matrix is opposite to the positive direction of the coordinate axis,所以使用‘flipud’command to flip the matrix upside down.
2. 颜色定义
由于It needs to be colored according to the size of the feature,So use a gradient color scheme.
这里直接用之前分享的addcolorplus工具的渐变色:
%% 颜色定义map = addcolorplus(300);

3. Bubble matrix graph drawing
使用‘bubblechart’命令,绘制Unprettified bubble matrix diagram.
bubblechart(xx(:),yy(:),data(:)*10,data(:),'MarkerFaceAlpha',1);hTitle = title('BubbleMatrix Plot');hXLabel = xlabel('XAxis');hYLabel = ylabel('YAxis');
其中, data(:)*10Used to define the bubble size,data(:)Used to define the bubble color,This is just to illustrate the two dimensions of features that can be represented by color and size.

4. 细节优化
为了插图的美观,使用colormap命令赋上之前选择好的颜色.
% 赋色colormap(map)
然后,使用‘bubblesize’The command defines the size of the smallest and largest bubbles:
% Adjust bubble sizebubblesize([10 30])

进一步,Make adjustments to the axes:
% 坐标轴美化axis equalset(gca, 'Box', 'on', ...'XGrid', 'on', 'YGrid', 'on', ...'TickDir', 'in', 'TickLength', [0 0], ...'XMinorTick', 'off', 'YMinorTick', 'off', ...'XColor', [.1 .1 .1], 'YColor', [.1 .1 .1],...'XTick', 0:1:c+1,...'XLim', [0 c+1],...'YTick', 0:1:r+1,...'YLim', [0 r+1],...'XTickLabel',{'','A1','A2','A3','A4','A5','A6','A7','A8','A9','A10',''},...'YTickLabel',{'','B1','B2','B3','B4','B5','B6','B7','B8','B9','B10',''})ytickangle(90)% 添加图例blgd = bubblelegend('Style','vertical',...'BubbleSizeOrder','descending',...'box','off',...'Location','northeastoutside',...'NumBubbles',3,... ...'FontName', 'Helvetica',...'FontSize', 10);colorbar('Position',[0.79,0.11,0.03,0.5])% 字体字号set(gca, 'FontName', 'Arial', 'FontSize', 10)set([hXLabel,hYLabel], 'FontName', 'Arial', 'FontSize', 11)set(hTitle, 'FontSize', 13, 'FontWeight' , 'bold')% 背景颜色set(gcf,'Color',[1 1 1])
最后,按照所需分辨率、格式输出图片.
figW = figureWidth;figH = figureHeight;set(figureHandle,'PaperUnits',figureUnits);set(figureHandle,'PaperPosition',[0 0 figW figH]);fileout = 'test';print(figureHandle,[fileout,'.png'],'-r300','-dpng');
也可以尝试其它配色:


以上.
完整代码:
边栏推荐
- NNLM、RNNLM等语言模型 实现 下一单词预测(next-word prediction)
- 基础软件与开发语言开源论坛| ChinaOSC
- 阿里巴巴政委体系-第八章、阿里政委工作方法论
- JMeter笔记5 |Badboy使用和录制
- Anaconda virtual environment migration
- 622 设计循环队列——Leetcode天天刷【循环队列,数组模拟,双指针】(2022.8.2)
- dpkg强制安装软件
- 【统计机器学习】线性回归模型
- Postgresql源码(64)查询执行——子模块Executor(2)执行前的数据结构和执行过程
- MySQL master-slave, 6 minutes you master!
猜你喜欢
危化企业双重预防机制数字化建设进入全面实施阶段
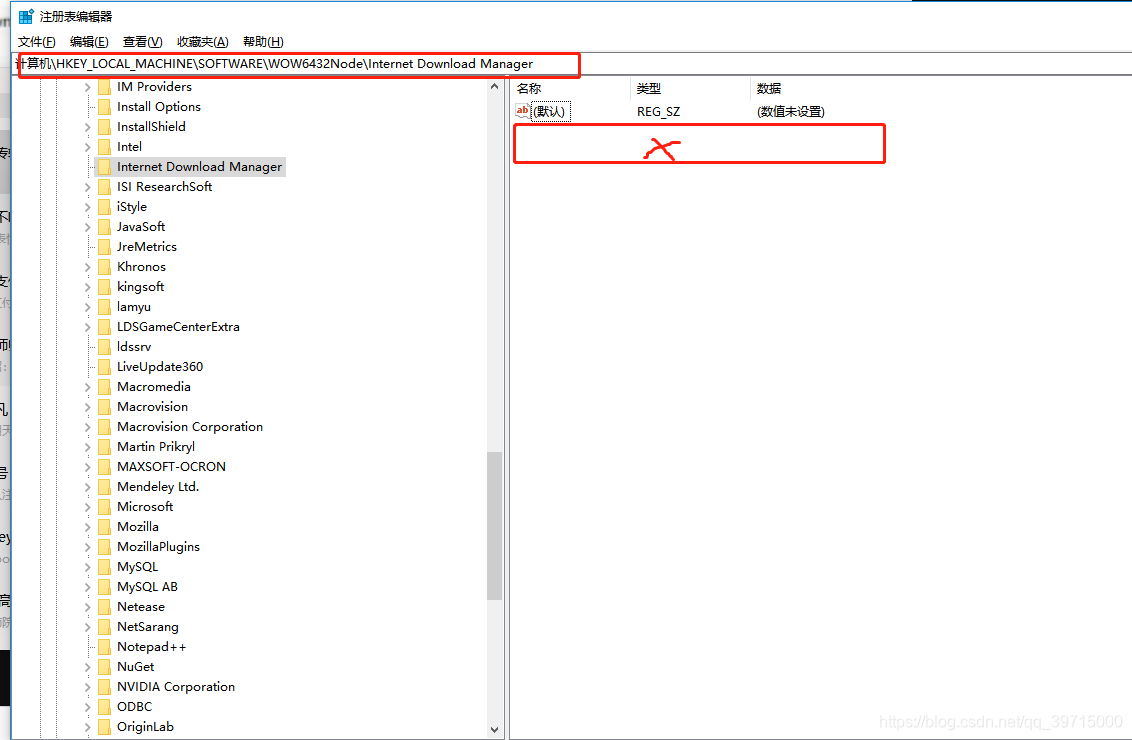
Internet Download Manager简介及下载安装包,IDM序列号注册问题解决方法

百利药业IPO过会:扣非后年亏1.5亿 奥博资本是股东
单调栈及其应用

告诉你0基础怎么学好游戏建模?
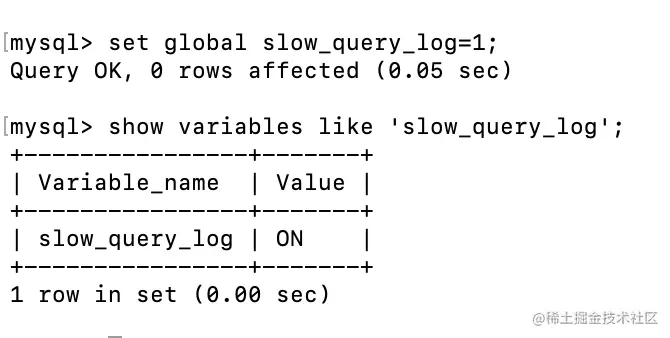
Teach you to locate online MySQL slow query problem hand by hand, package teaching package meeting
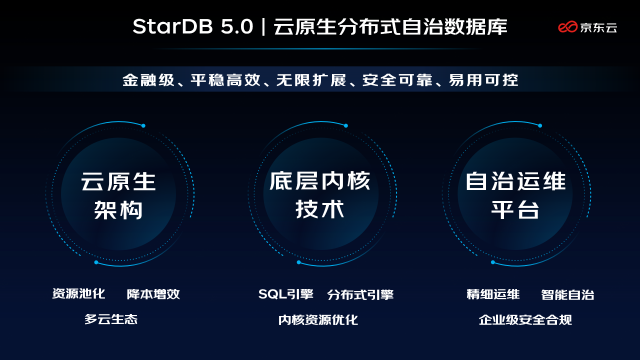
Jingdong cloud released a new generation of distributed database StarDB 5.0

高效目标检测:动态候选较大程度提升检测精度(附论文下载)
「游戏建模干货」建模大师几步操作,学习经典,赶紧脑补一下吧

Reveal how the five operational management level of hundreds of millions of easily flow system
随机推荐
node版本切换工具NVM以及npm源管理器nrm
关于2022年度深圳市技术攻关重大项目的申报通知
ADS 2023 Download Link
Compose原理-compose中是如何实现事件分法的
Postgresql source code (65) analysis of the working principle of the new snapshot system Globalvis
百利药业IPO过会:扣非后年亏1.5亿 奥博资本是股东
MySQL Basics
梅科尔工作室-14天华为培训七
Unity获取canvas 下ui 在屏幕中的实际坐标
力扣解法汇总899-有序队列
阿里巴巴政委体系-第五章、阿里政委体系建设
建模该从哪一步开始?给你分析,给零基础的你一些学习建议
awk语法-02-运算、数组、格式化输出
CS免杀姿势
CentOS 7 安装mysql
X86函数调用模型分析
详解AST抽象语法树
Shell programming loop statement
The ecological environmental protection management system based on mobile GIS
虚拟机vmware设置nat模式上网