当前位置:网站首页>Grafana draws the trend chart
Grafana draws the trend chart
2022-06-28 19:01:00 【South Lake Fishing Song】
Example data :
use test_bi;
CREATE TABLE `orderpaytable` (
  `time1` varchar(20) DEFAULT NULL,
  `time2` varchar(20) DEFAULT NULL,
  `orderpay` int(10) DEFAULT NULL,
  `month_rate` decimal(10,2) DEFAULT NULL
) ENGINE=InnoDB DEFAULT CHARSET=utf8mb4 COLLATE=utf8mb4_0900_ai_ci;

#  insert data
INSERT INTO test_bi.orderpaytable (time1,time2,orderpay,month_rate) VALUES
	 ('2016-01','2016-01-01',1407993,NULL),
	 ('2016-02','2016-02-01',684899,-0.51),
	 ('2016-03','2016-03-01',1297697,0.89),
	 ('2016-04','2016-04-01',1183767,-0.09),
	 ('2016-05','2016-05-01',1691896,0.43),
	 ('2016-06','2016-06-01',1450639,-0.14),
	 ('2016-07','2016-07-01',1152697,-0.21),
	 ('2016-08','2016-08-01',1318004,0.14),
	 ('2016-09','2016-09-01',1289457,-0.02),
	 ('2016-10','2016-10-01',1134492,-0.12),
	 ('2016-11','2016-11-01',1243779,0.10),
	 ('2016-12','2016-12-01',1270597,0.02),
	 ('2017-01','2017-01-01',1305803,0.03),
	 ('2017-02','2017-02-01',786593,-0.40),
	 ('2017-03','2017-03-01',987215,0.26),
	 ('2017-04','2017-04-01',883131,-0.11),
	 ('2017-05','2017-05-01',1125141,0.27),
	 ('2017-06','2017-06-01',1036588,-0.08),
	 ('2017-07','2017-07-01',946463,-0.09),
	 ('2017-08','2017-08-01',1282120,0.35),
	 ('2017-09','2017-09-01',1139918,-0.11),
	 ('2017-10','2017-10-01',1136302,0.00),
	 ('2017-11','2017-11-01',1179867,0.04),
	 ('2017-12','2017-12-01',1208147,0.02);

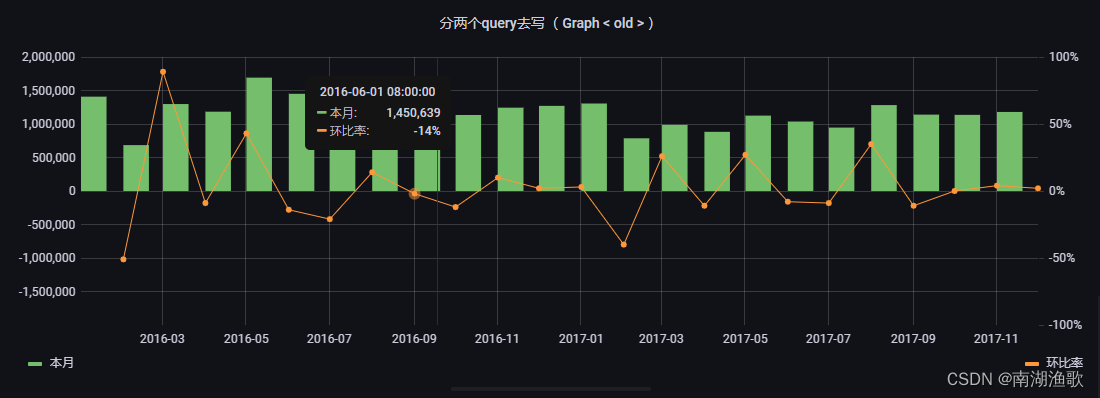
Visual display :
select   STR_TO_DATE( time2 ,'%Y-%m-%d') as time
        ,orderpay as  This month,
from test_bi.orderpaytable

select   STR_TO_DATE( time2 ,'%Y-%m-%d') as time
        ,lag(orderpay,1)over() as  Last month,
from test_bi.orderpaytable
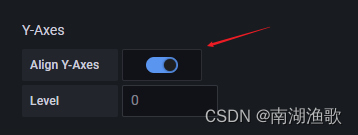
Time series:


select   STR_TO_DATE( time2 ,'%Y-%m-%d') as time
        ,orderpay as  This month,
from test_bi.orderpaytable;

select   STR_TO_DATE( time2 ,'%Y-%m-%d') as time
        ,month_rate as  Link ratio
from test_bi.orderpaytable


边栏推荐
- ONEFLOW source code parsing: automatic inference of operator signature
- About Significance Tests
- 毕业设计-基于Unity的餐厅经营游戏的设计与开发(附源码、开题报告、论文、答辩PPT、演示视频,带数据库)
- postgresql数据库docker
- Question brushing analysis tool
- tensorboard 使用总结
- Servlet的使用手把手教学(一)
- About Covariance and Correlation(协方差和相关)
- POI Excel转换工具
- Native implementation Net5.0+ custom log
猜你喜欢
技术管理进阶——管理者如何做绩效沟通及把控风险

牛津大學教授Michael Wooldridge:AI社區近40年如何看待神經網絡

Memory leak

About Statistical Distributions

基于管线的混合渲染

leetcode 1423. Maximum points you can obtain from cards

用户网络模型与QoE

微博评论的高性能高可用计算架构方案

毕业设计-基于Unity的餐厅经营游戏的设计与开发(附源码、开题报告、论文、答辩PPT、演示视频,带数据库)

19.2 container classification, array and vector container refinement
随机推荐
Huawei cloud AOM released version 2.0, and three features appeared
找出连续7天登陆,连续30天登陆的用户
福建的朋友们,你们的养老保险上云啦!
CVPR2022 | 浙大、蚂蚁集团提出基于标签关系树的层级残差多粒度分类网络,建模多粒度标签间的层级知识
深入解析kubernetes中的选举机制
Modular operation
Business layer modification - reverse modification based on the existing framework
Shanghai Pudong Development Bank Software Test interview real question
sql计算每日新增用户、及留存率指标
About covariance and correlation
AOSP清华镜像下载错误解决
使用.NetCore自带的后台作业,出入队简单模拟生产者消费者处理请求响应的数据
Graduation project - Design and development of restaurant management game based on unity (with source code, opening report, thesis, defense PPT, demonstration video and database)
Michael Wooldridge, professeur à l'Université d'Oxford: comment la communauté de l'IA voit les réseaux neuronaux depuis près de 40 ans
Understanding of closures
Tensorboard Usage Summary
原生实现.NET5.0+ 自定义日志
Enhancing steam and engineering education from theory to practice
Advanced technology management - how managers communicate performance and control risks
Voice network VQA: make the user's subjective experience of unknown video quality in real-time interaction known