当前位置:网站首页>Mac version PHP installed Xdebug environment (M1 version)
Mac version PHP installed Xdebug environment (M1 version)
2022-07-07 05:52:00 【ARCHER359】
The author depends on the environment
1.php7.4
2.macOS 12
3.apache2
4.xdebug3.1.4
5.phpstorm
php7.4 install
brew install php7.4
Remember to put... After installation brew The automatic update software is off , Or the next new version php7.4 May lead to xdebug reinstall
apache2 install ( As if mac Bring their own , I did it again )
brew install apache2
Author default web root /opt/homebrew/var/www Profile directory /opt/homebrew/etc/httpd
xdebug install
Go to the official website to download the latest xdebug

After downloading, we came to php Of bin Catalog , I am here /opt/homebrew/Cellar/[email protected]/7.4.29/bin And then execute sudo ./pecl install xdebug( Just downloaded xdebug Compressed package ), The official is to use arch -arm64 sudo pecl install xdebug Command installation failed here .
After compiling, if there is a warning of missing some directories , And no xdebug.so Words , Just create the missing directory and remember to give permission , Then recompile to generate xdebug.so, After successful compilation, enter php -m Command to see if the installation is successful .
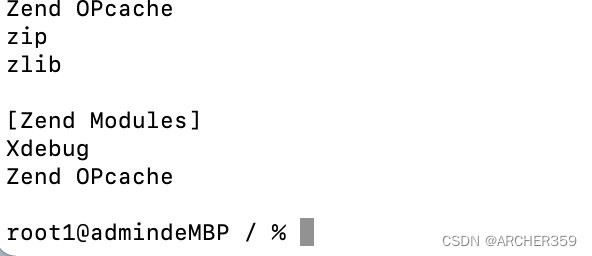
The key is coming.
modify php.ini And add the following .
[xdebug]
zend_extension ="/opt/homebrew/Cellar/[email protected]/7.4.29/pecl/20190902/xdebug.so"; Modify the directory according to yourself
xdebug.idekey="PHPSTORM"
xdebug.client_host=localhost
;  port ID,phpstorm  The settings must be consistent
xdebug.client_port=9003
; Turn on xdebug Support , Different mode Different uses of , See the official documentation for details
xdebug.mode = debug ; If multiple modes are to be turned on together , Just use `,` Just separate it
xdebug.profiler_append = 0
xdebug.profiler_output_name = cachegrind.out.%p
xdebug.start_with_request = default|yes|no|trigger ; It's different here , It turns out that if you want to open trace or profile, It's using enable_trace,enable_profile Etc
xdebug.trigger_value=StartProfileForMe ; Here is the original profile_trigger_value,trace_trigger_value
xdebug.output_dir = /tmp ; Output file path , Turned out to be output_profiler_dir,trace_dir Set separately , Now use this setting uniformly
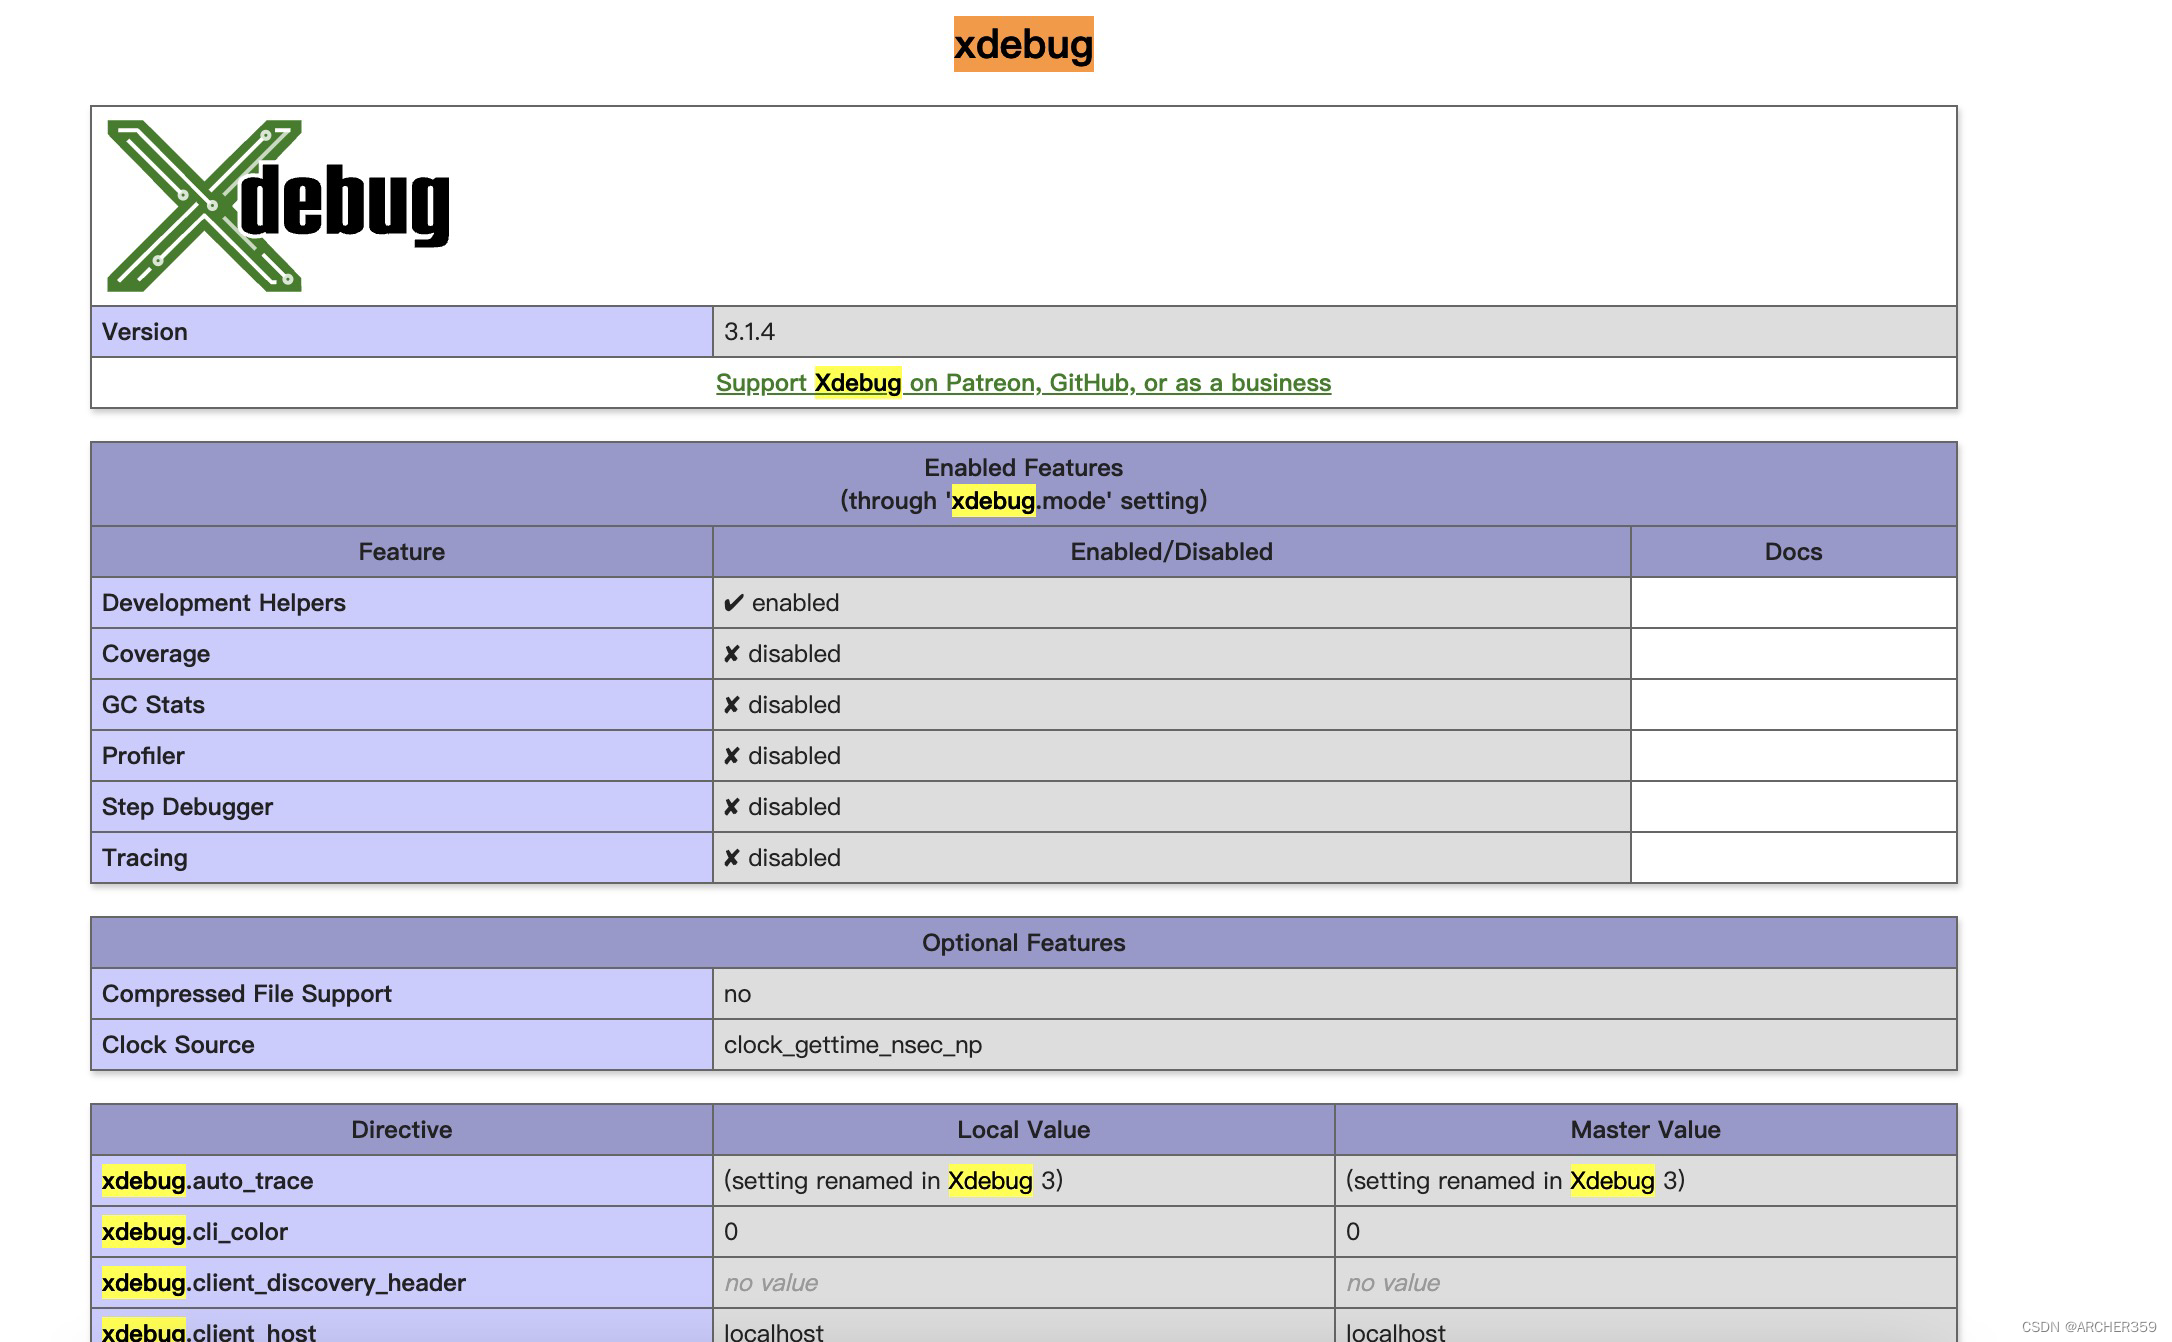
Verify that the configuration was successful
phpstorm To configure
Put it in advance php Good configuration , And then start debug To configure
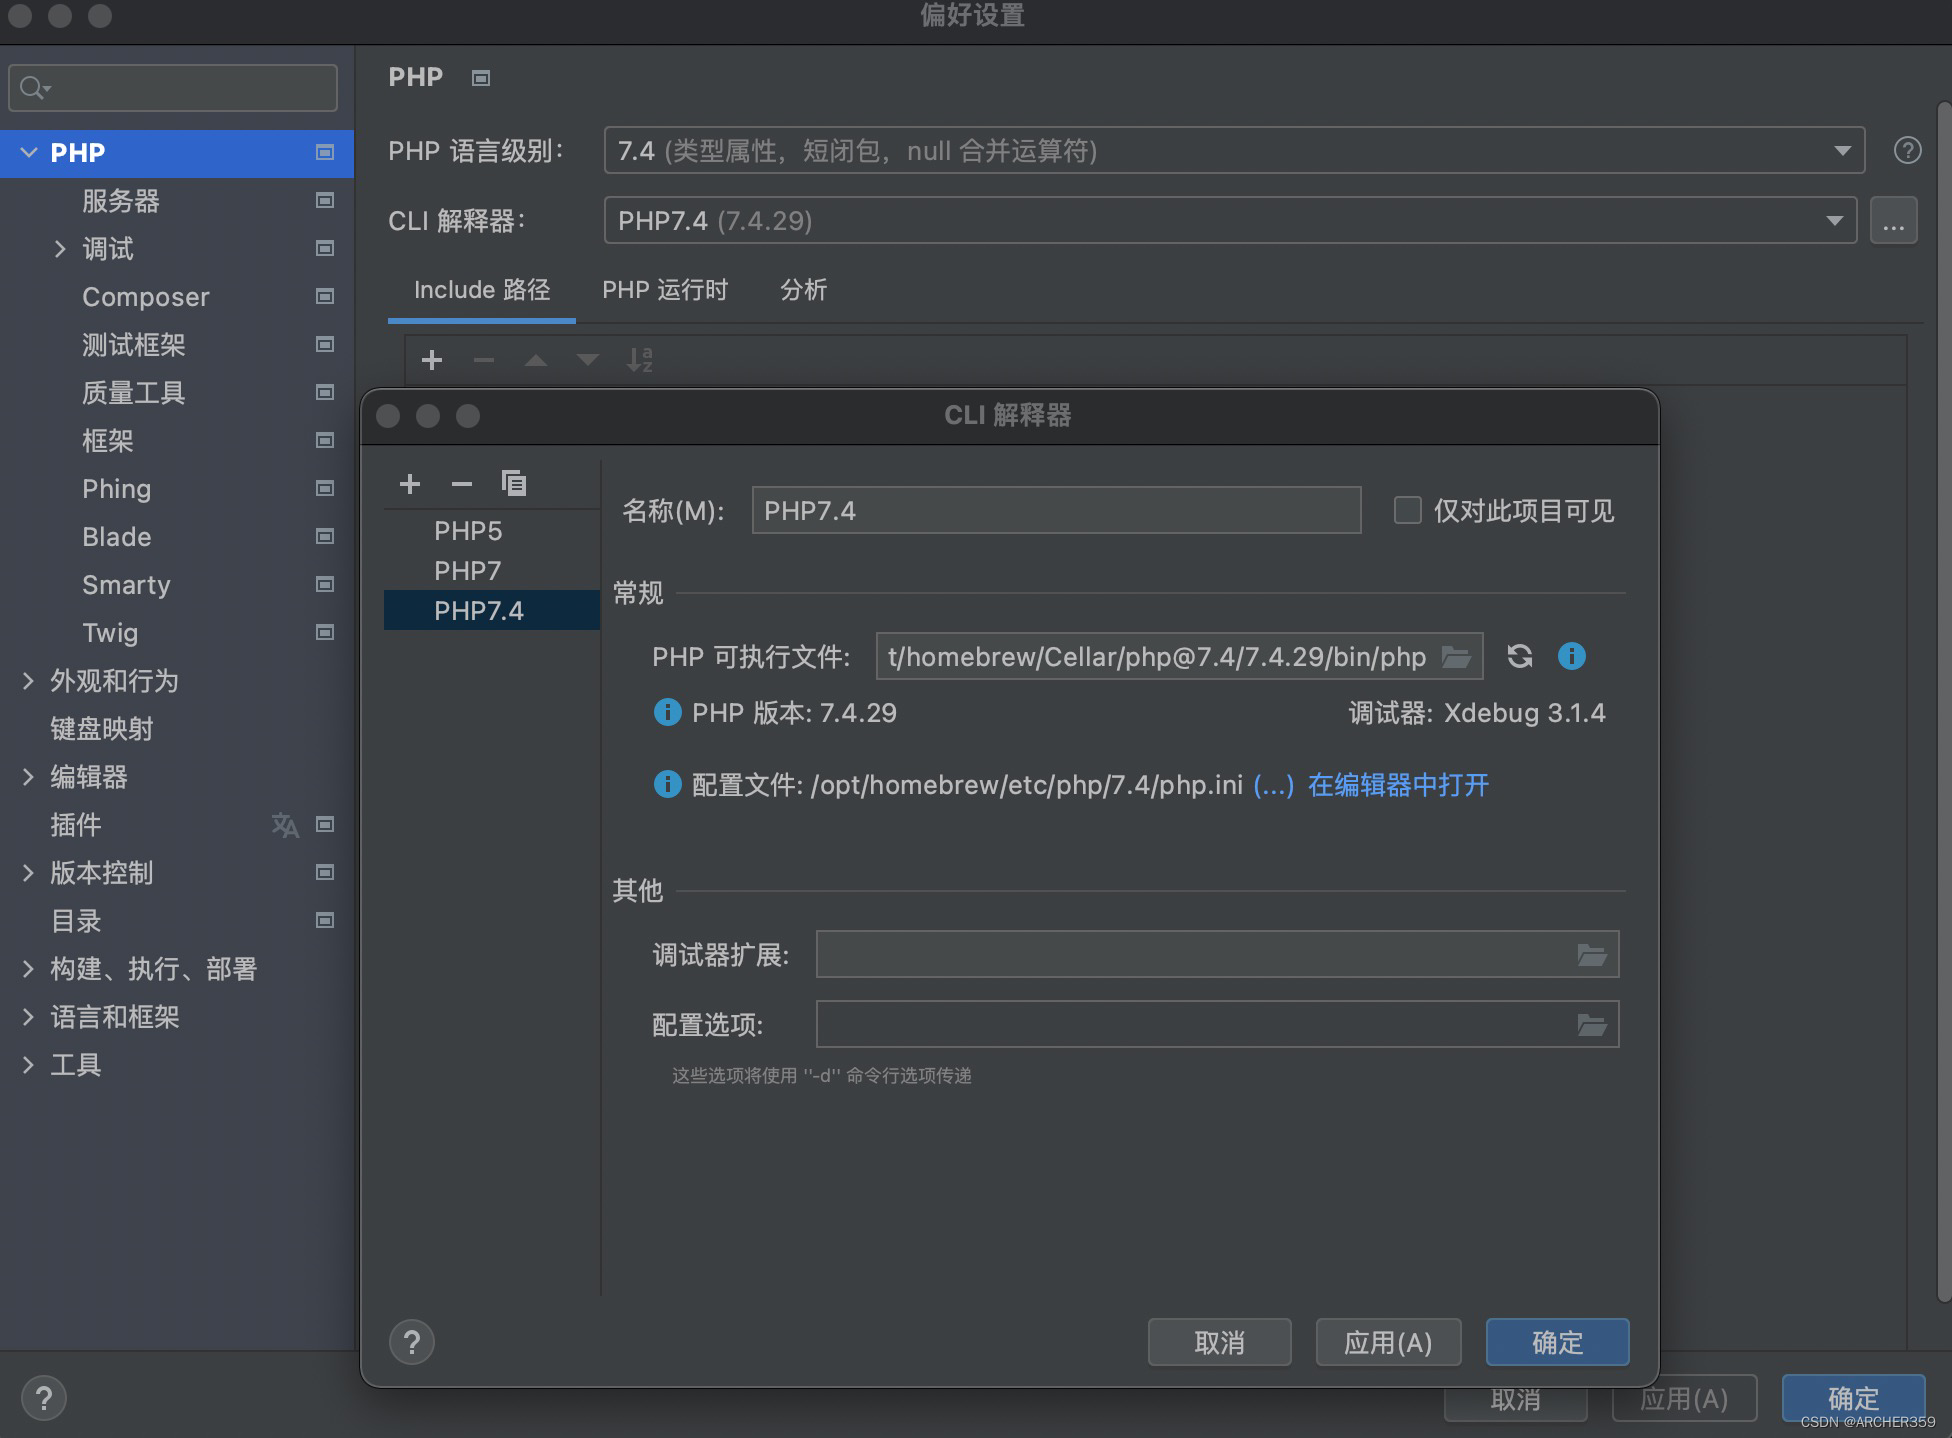
1. Create a server
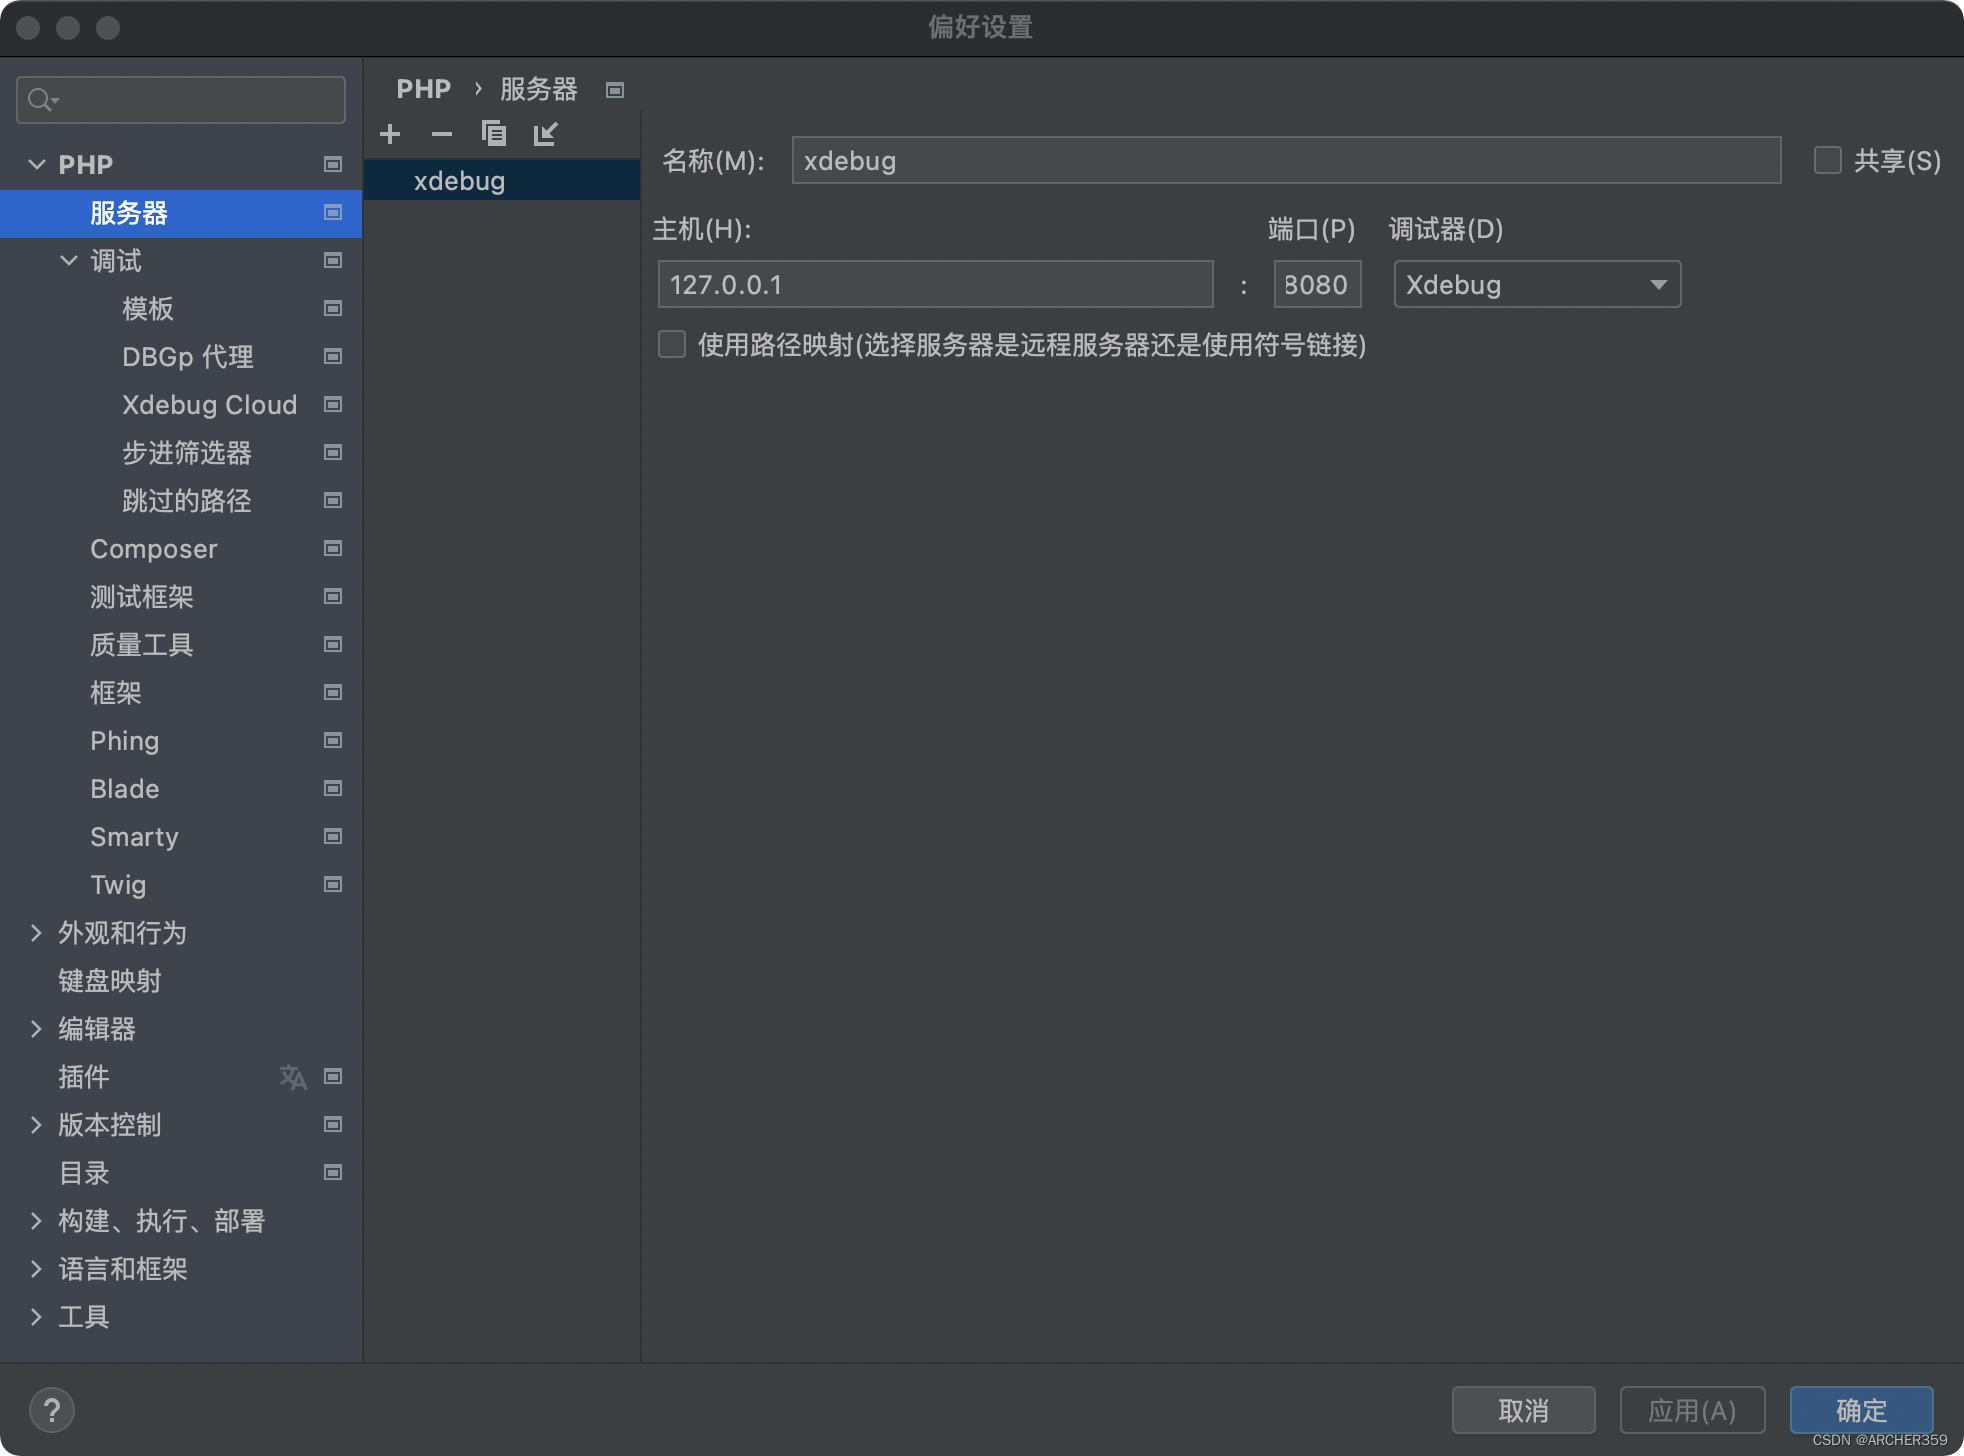
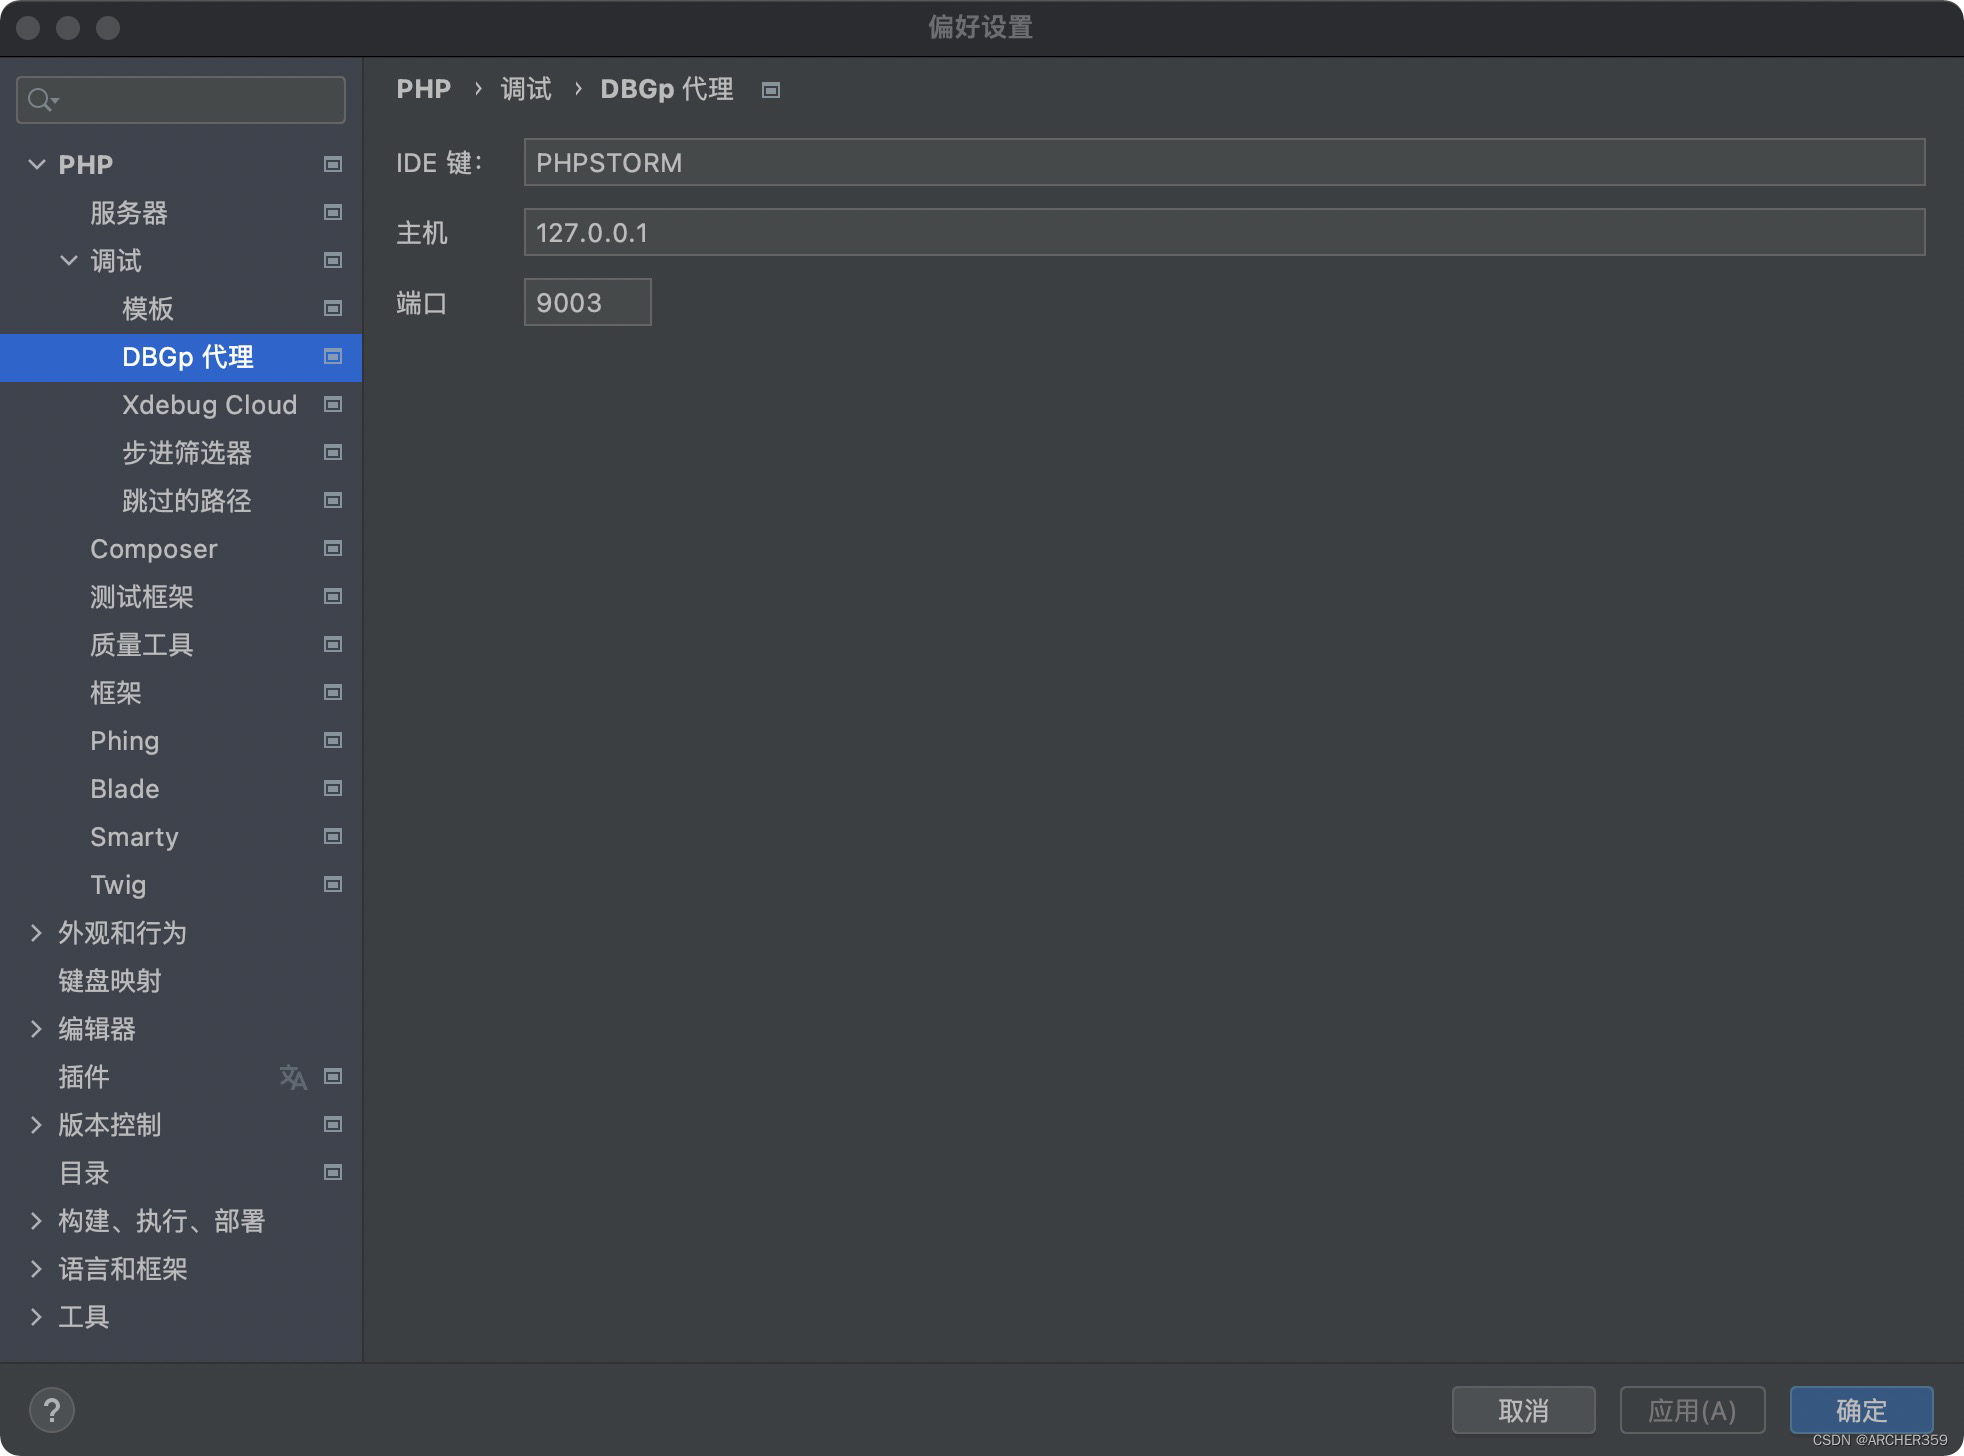
2. Set up Dgbp agent , Want to be with php.ini The configuration is the same .
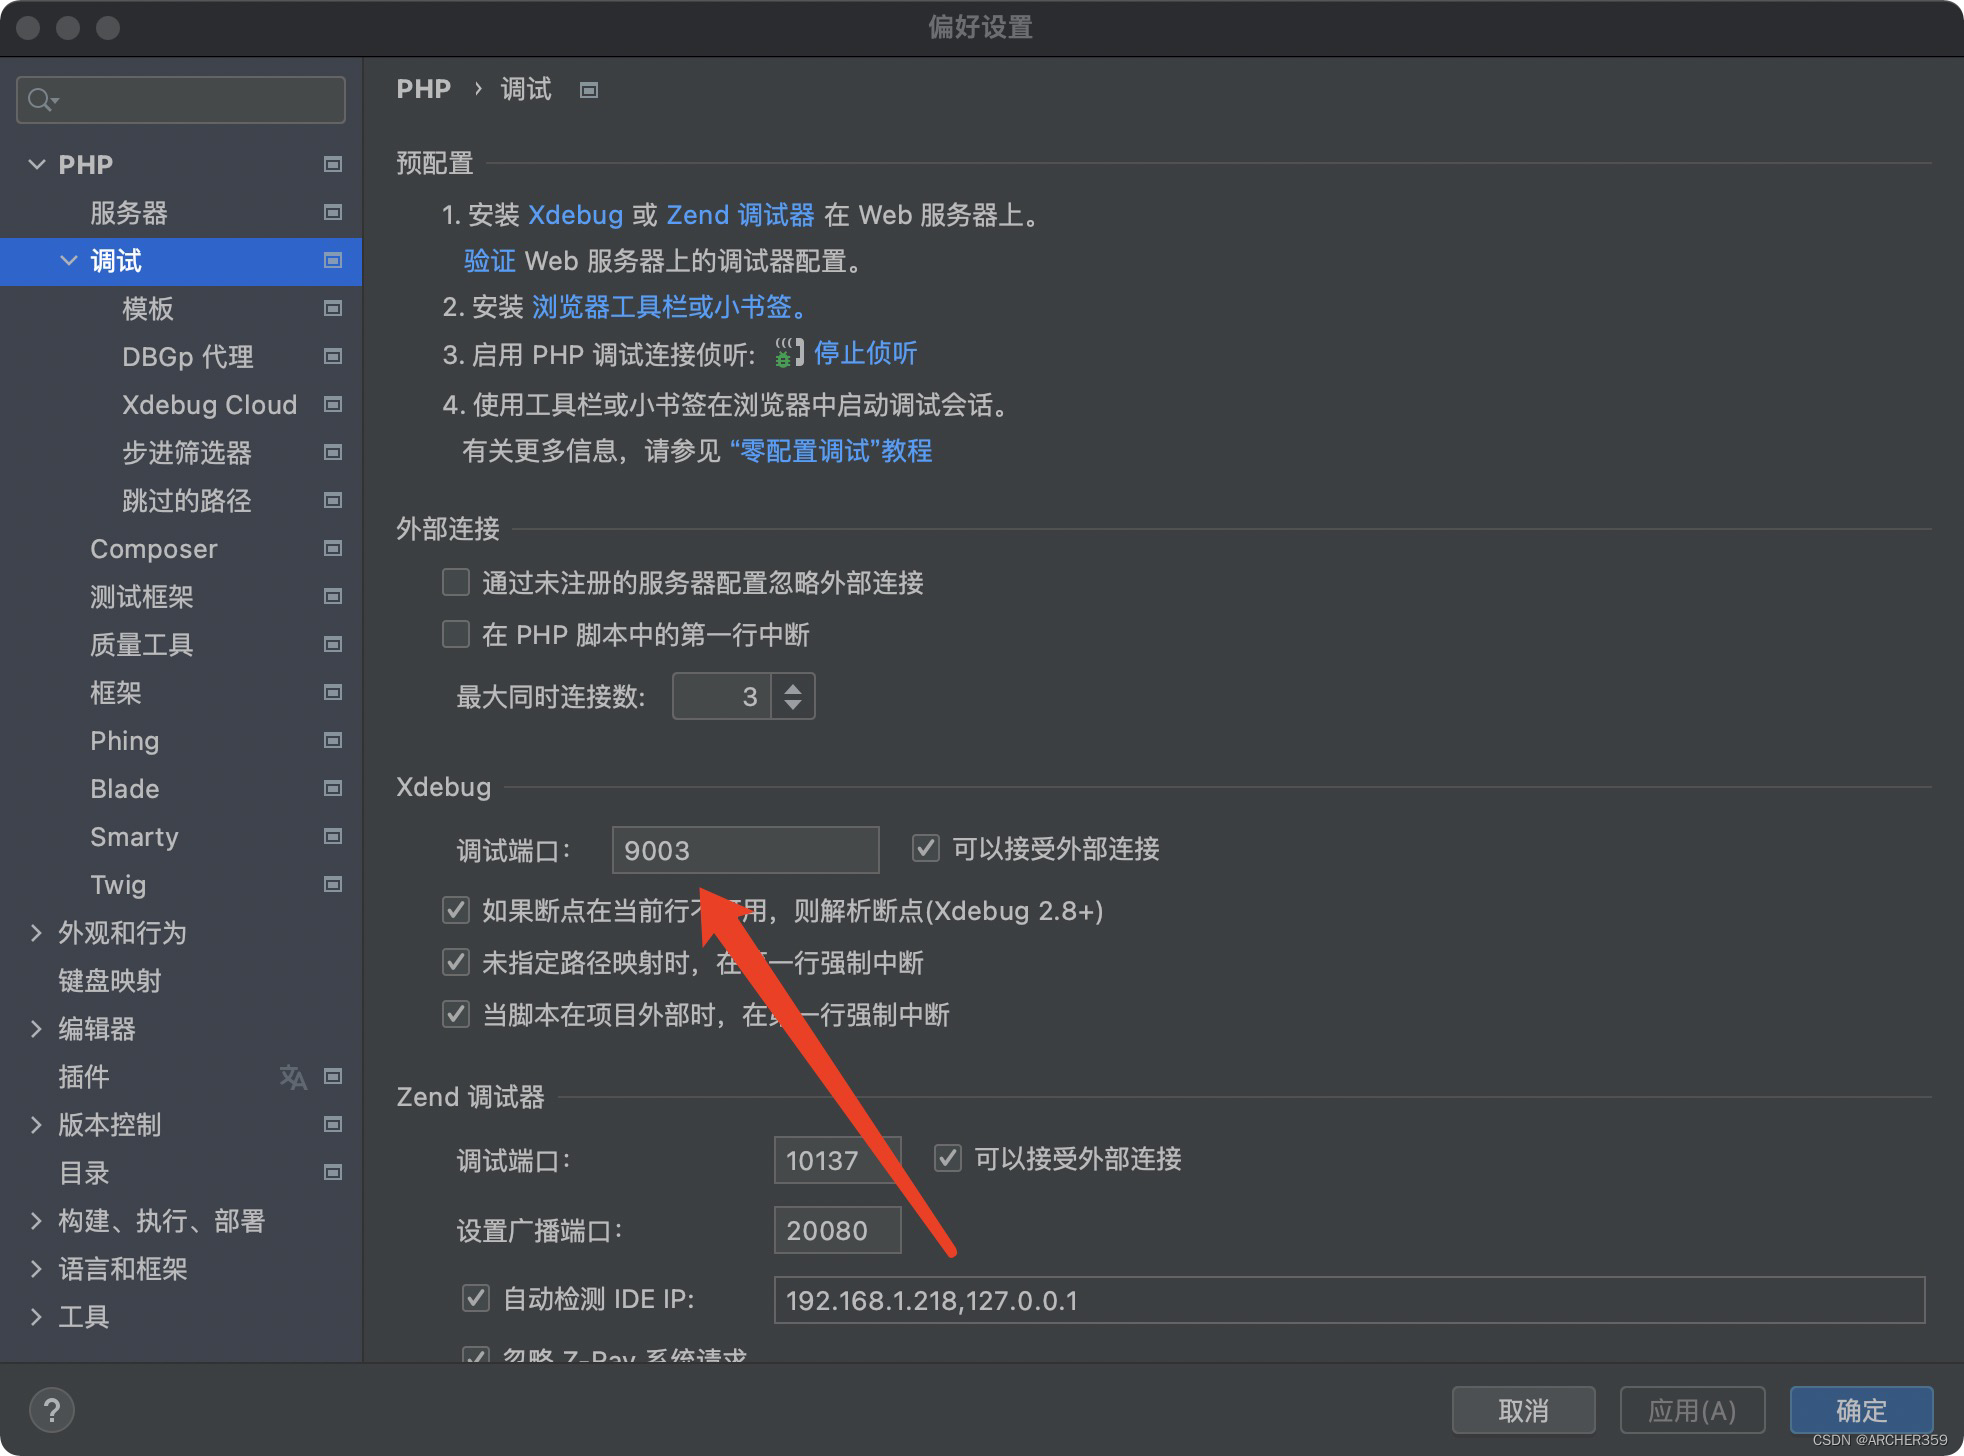
3. Modify debug port , Want to be with php.ini equally
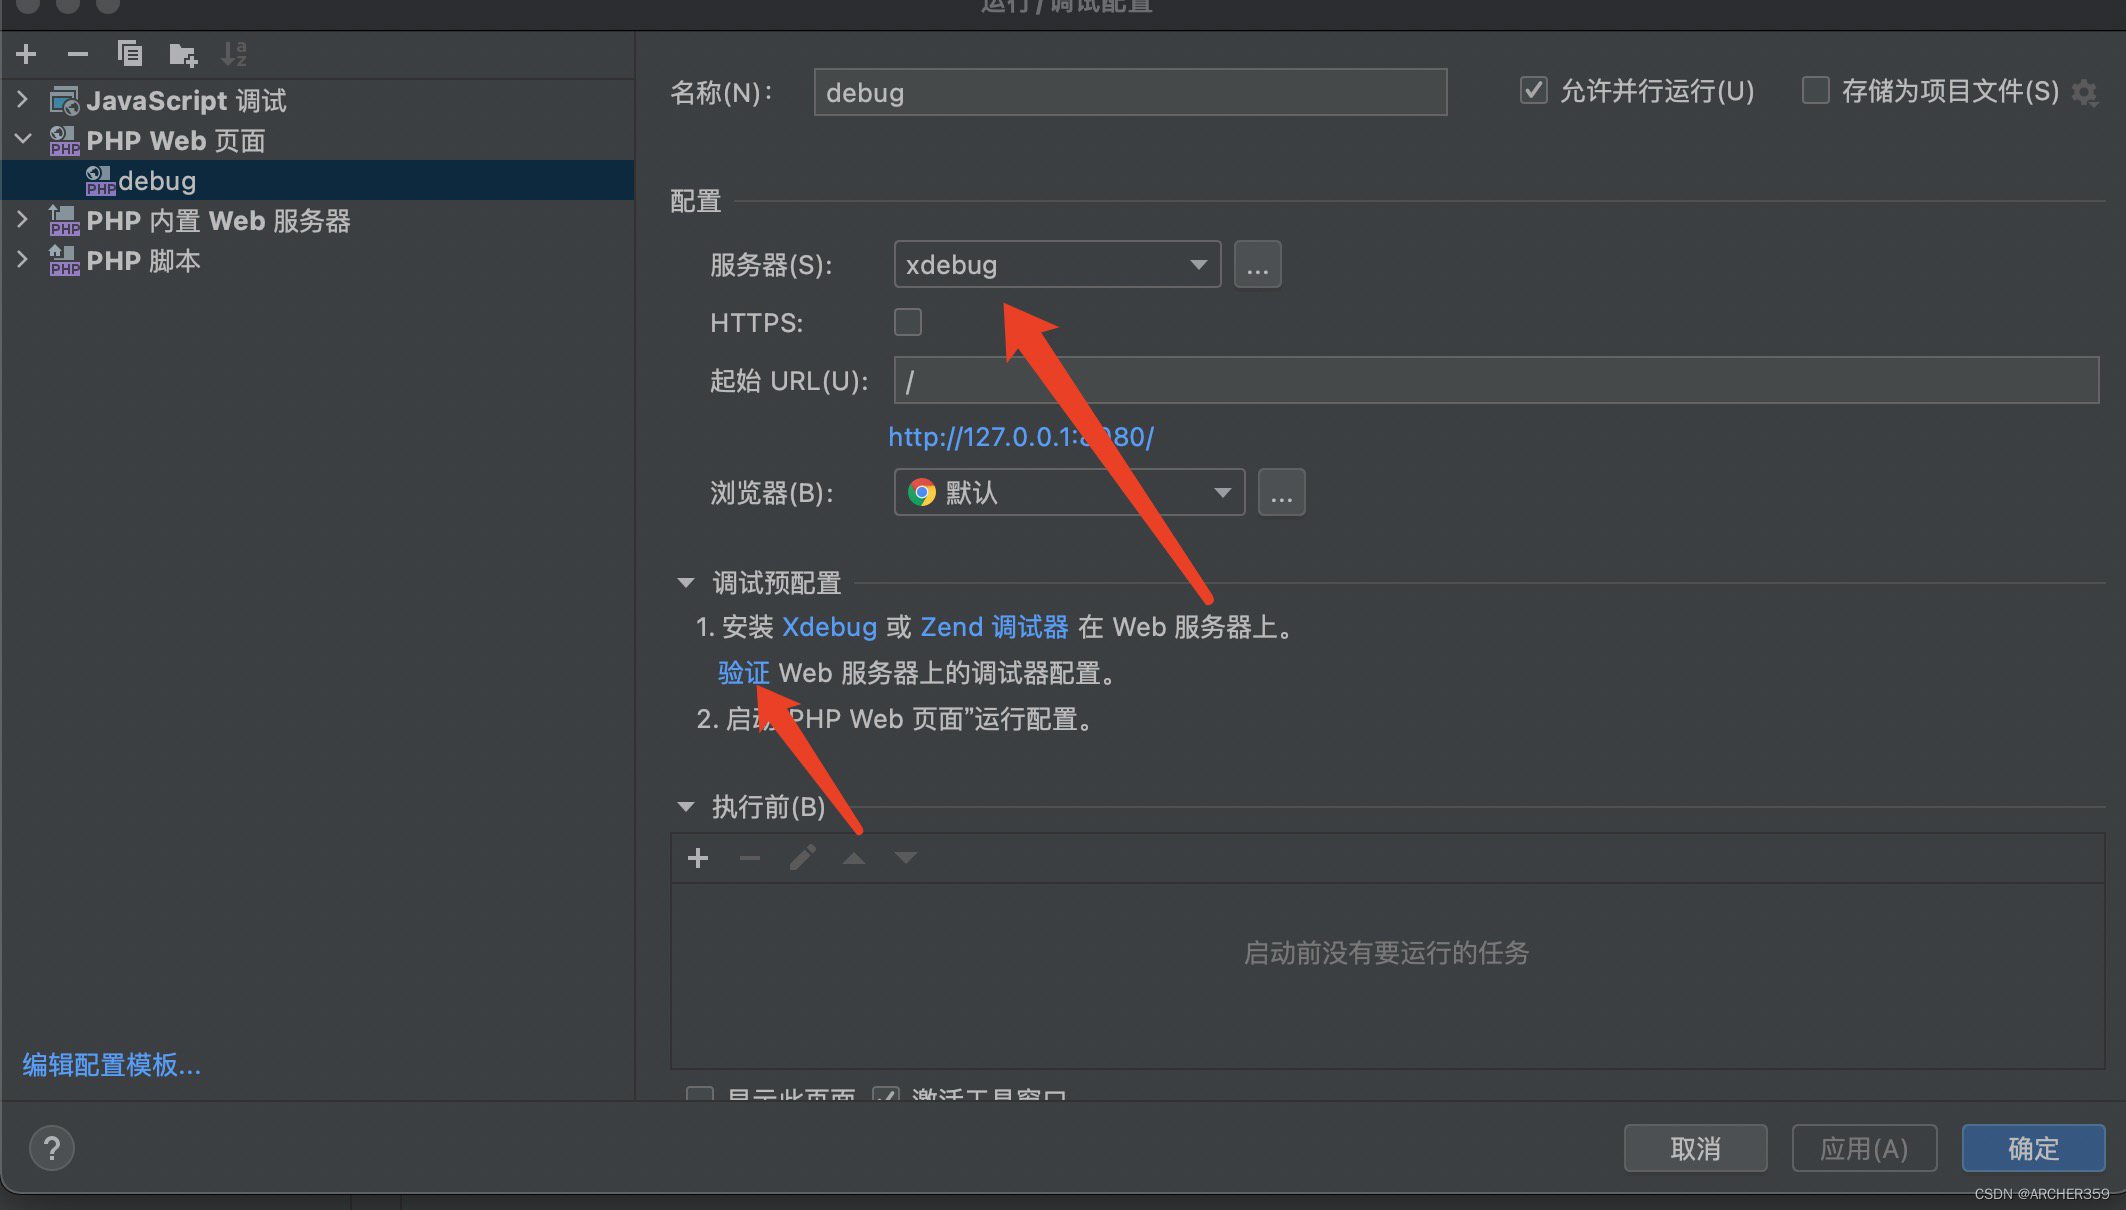
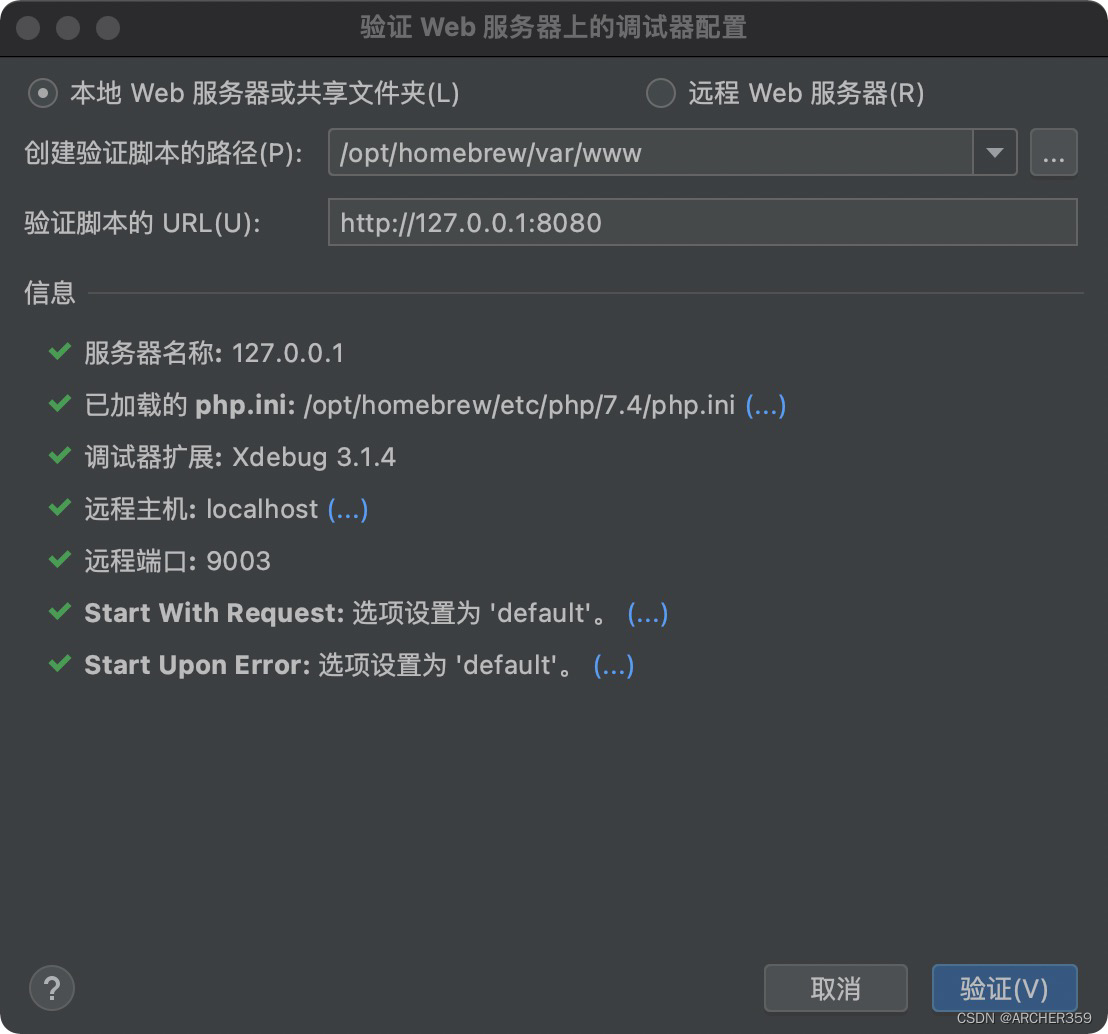
 4. Create a php web page , Select the server we created in the first step , Click verify to check our debugging configuration .
Environmental testing
After turning on the small phone , We came to the browser , Good configuration xdebug plug-in unit , Turn on httpd.
sudo brew services start httpd
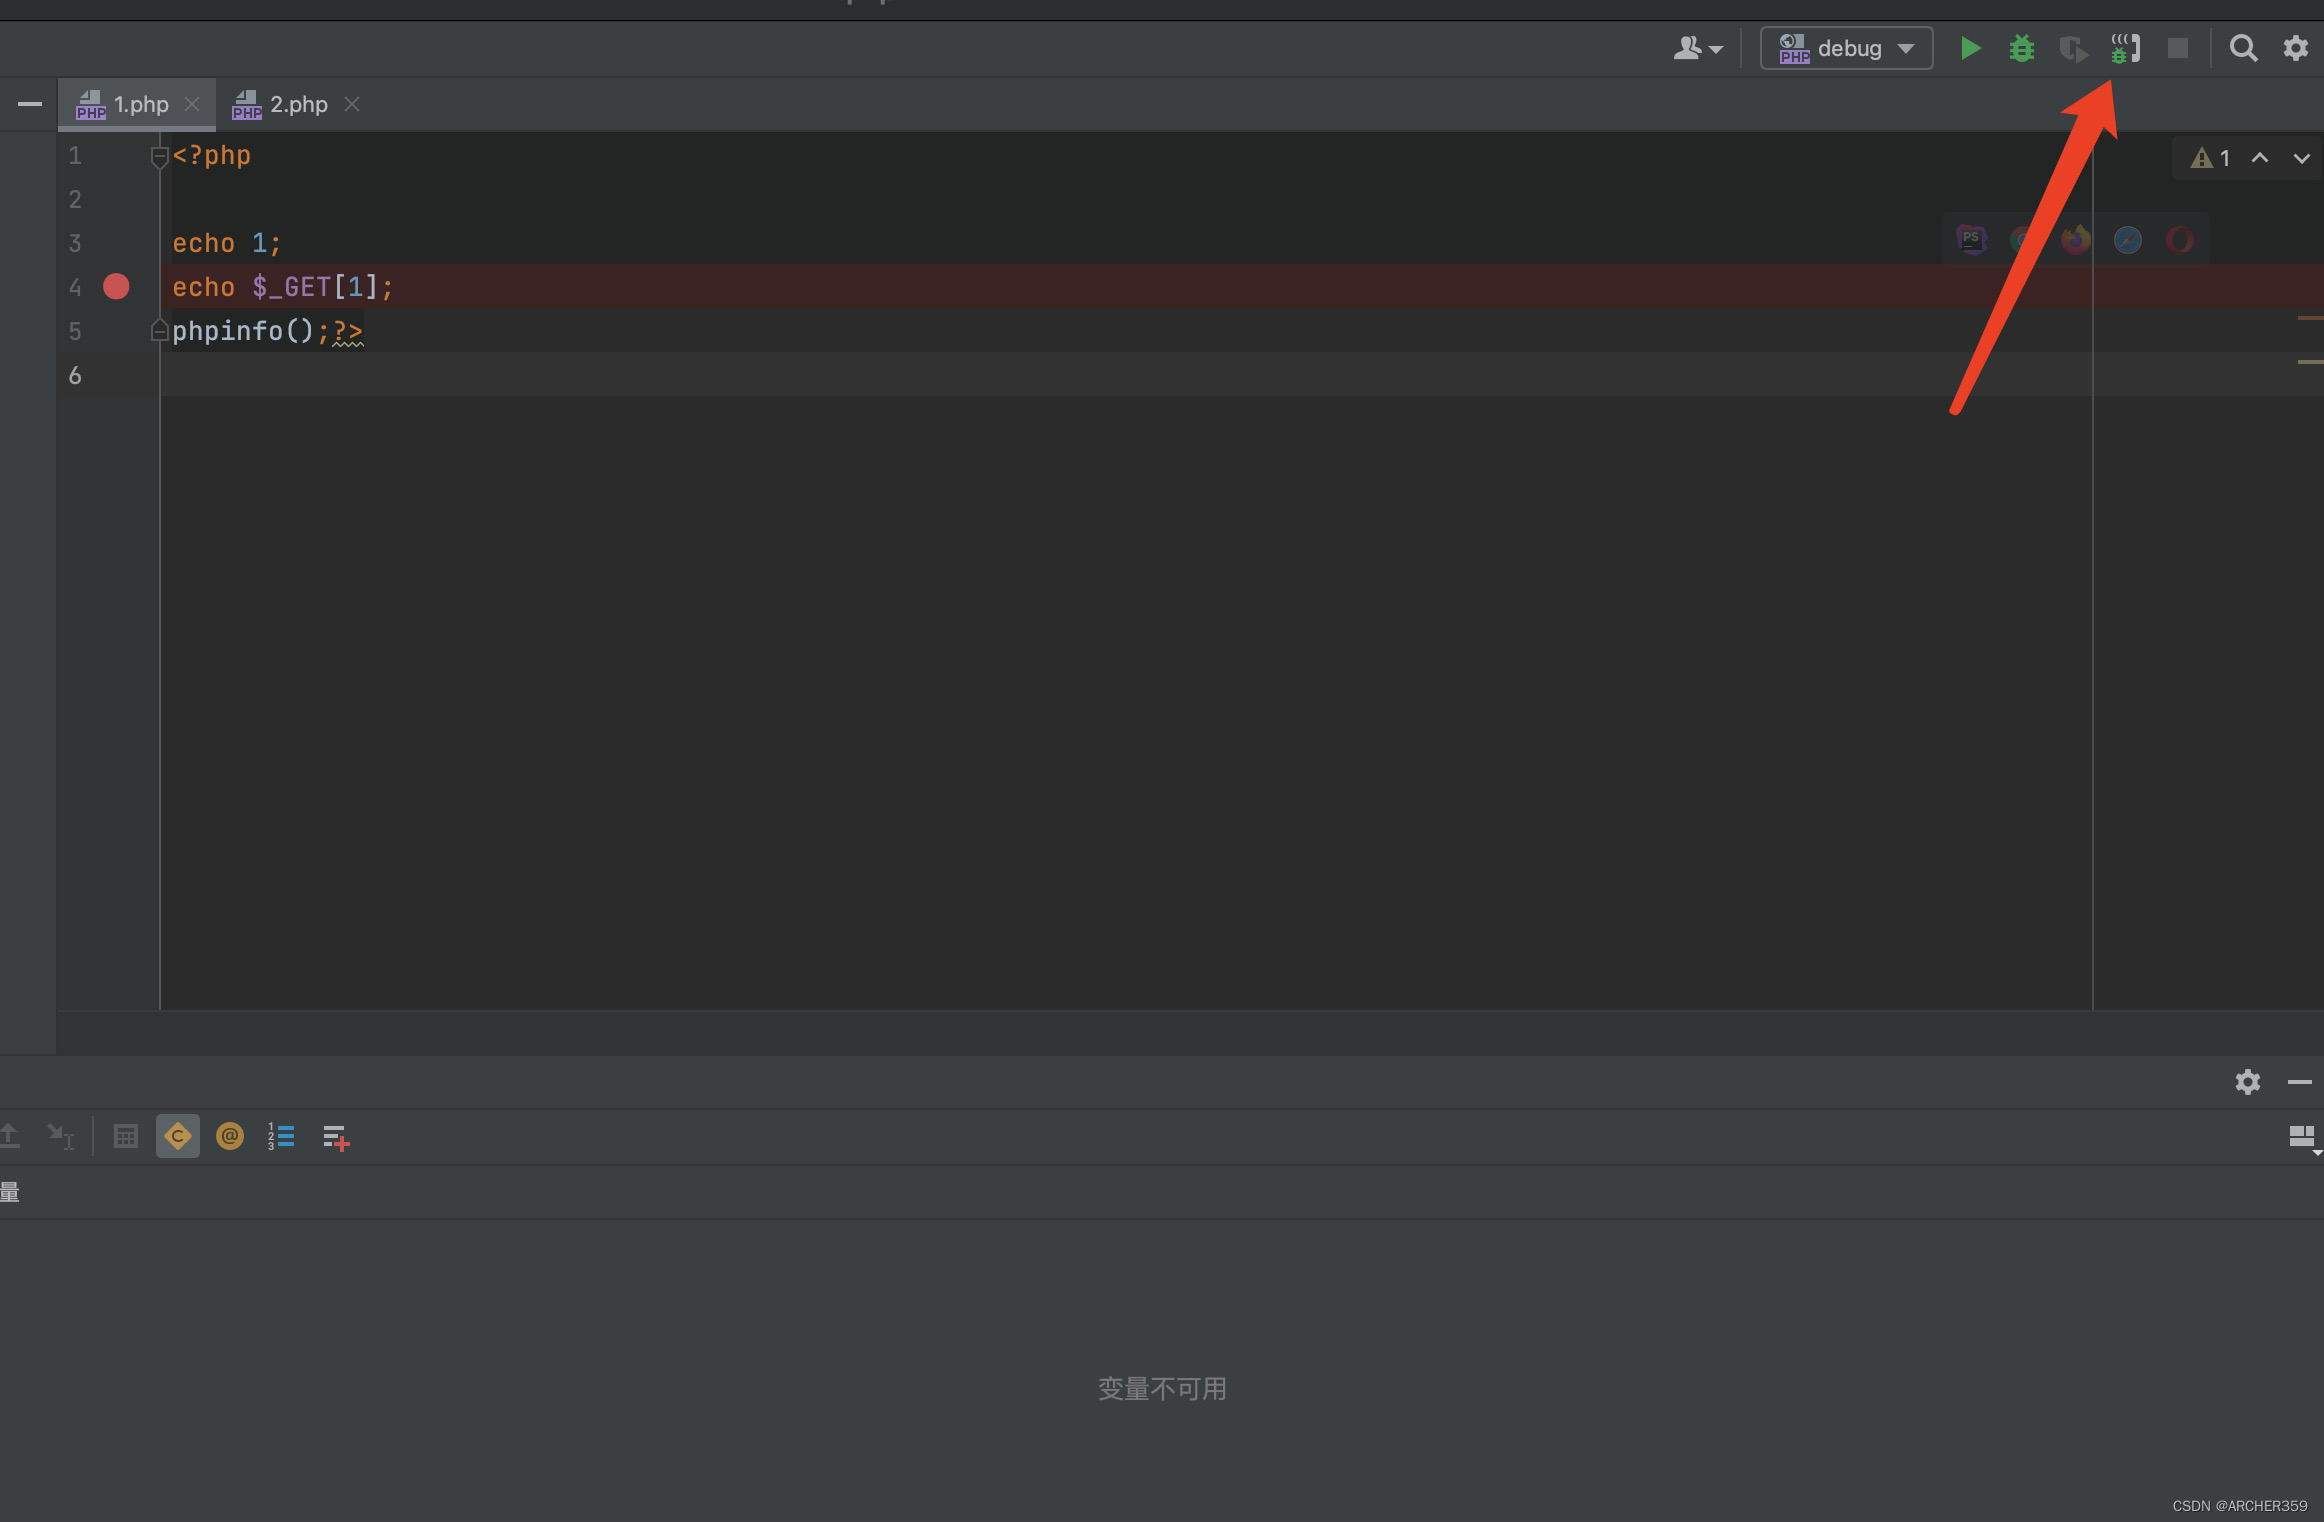
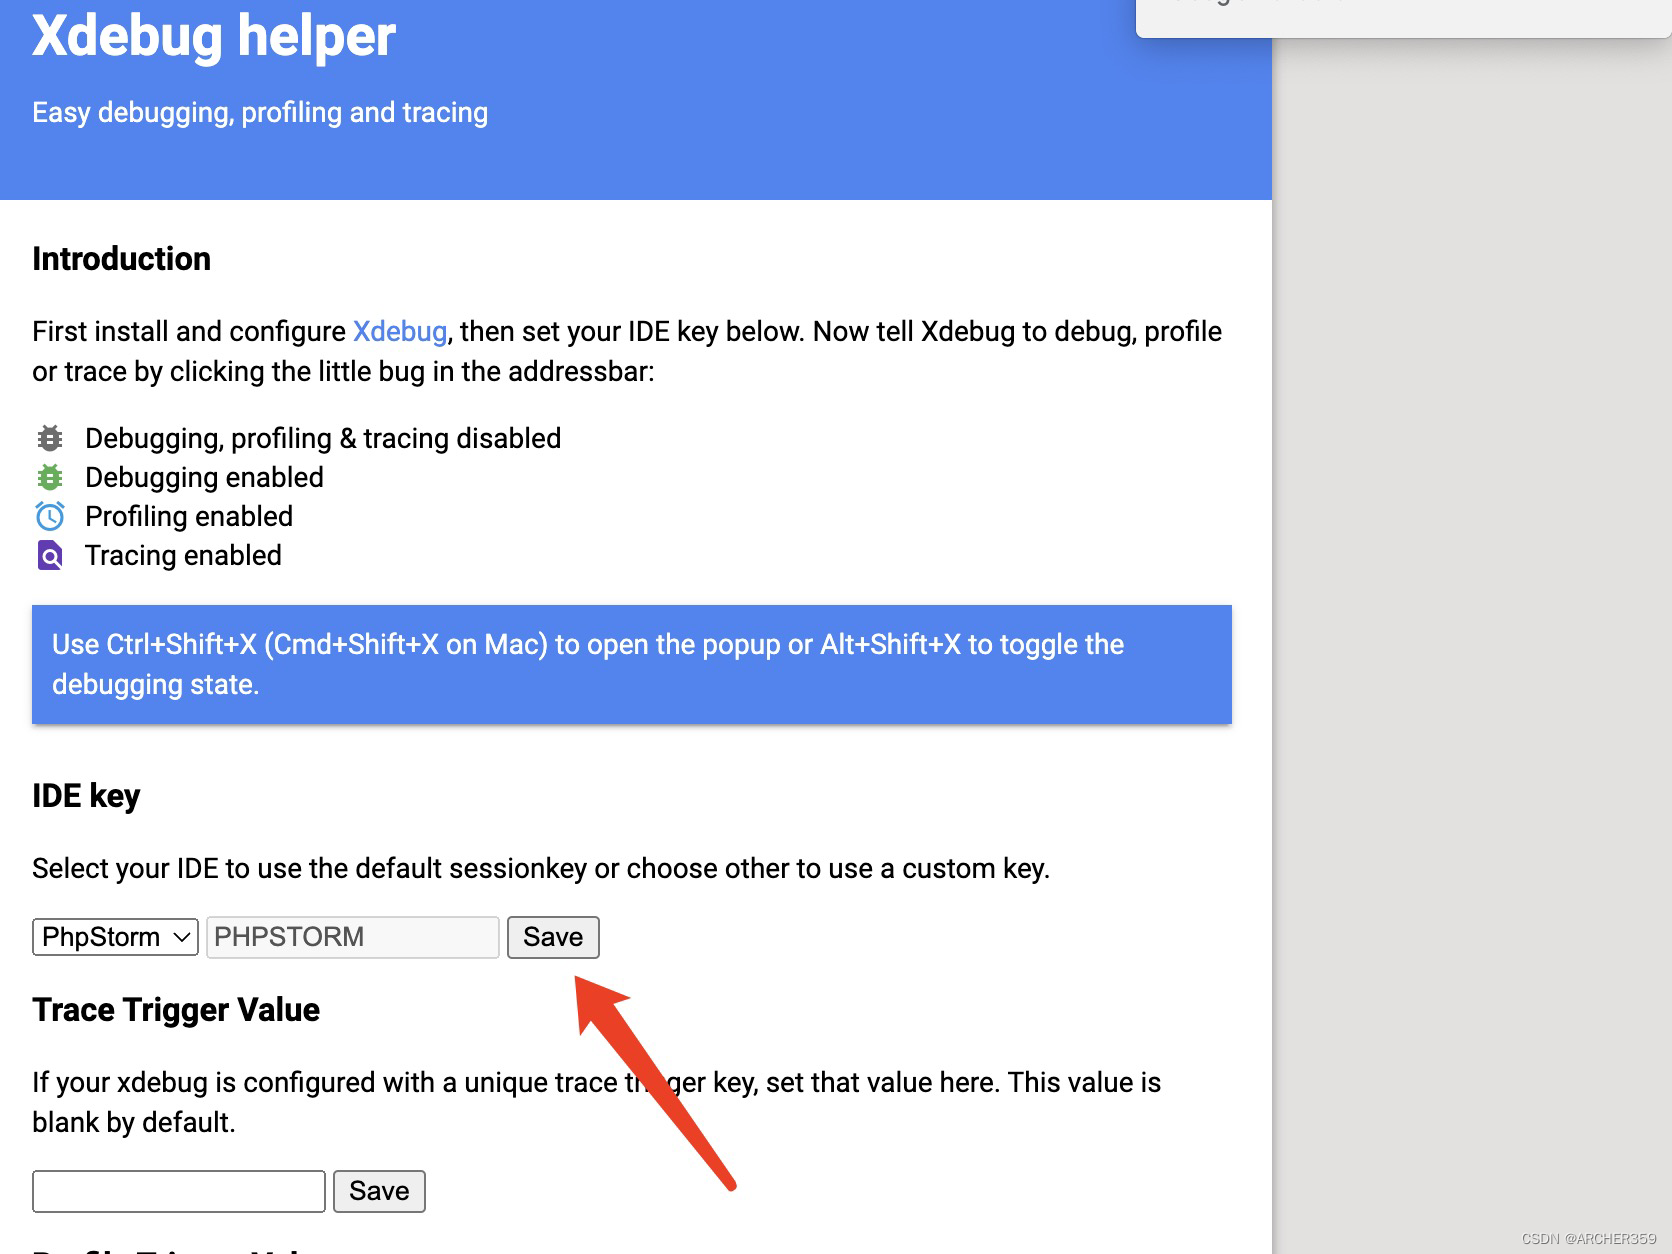
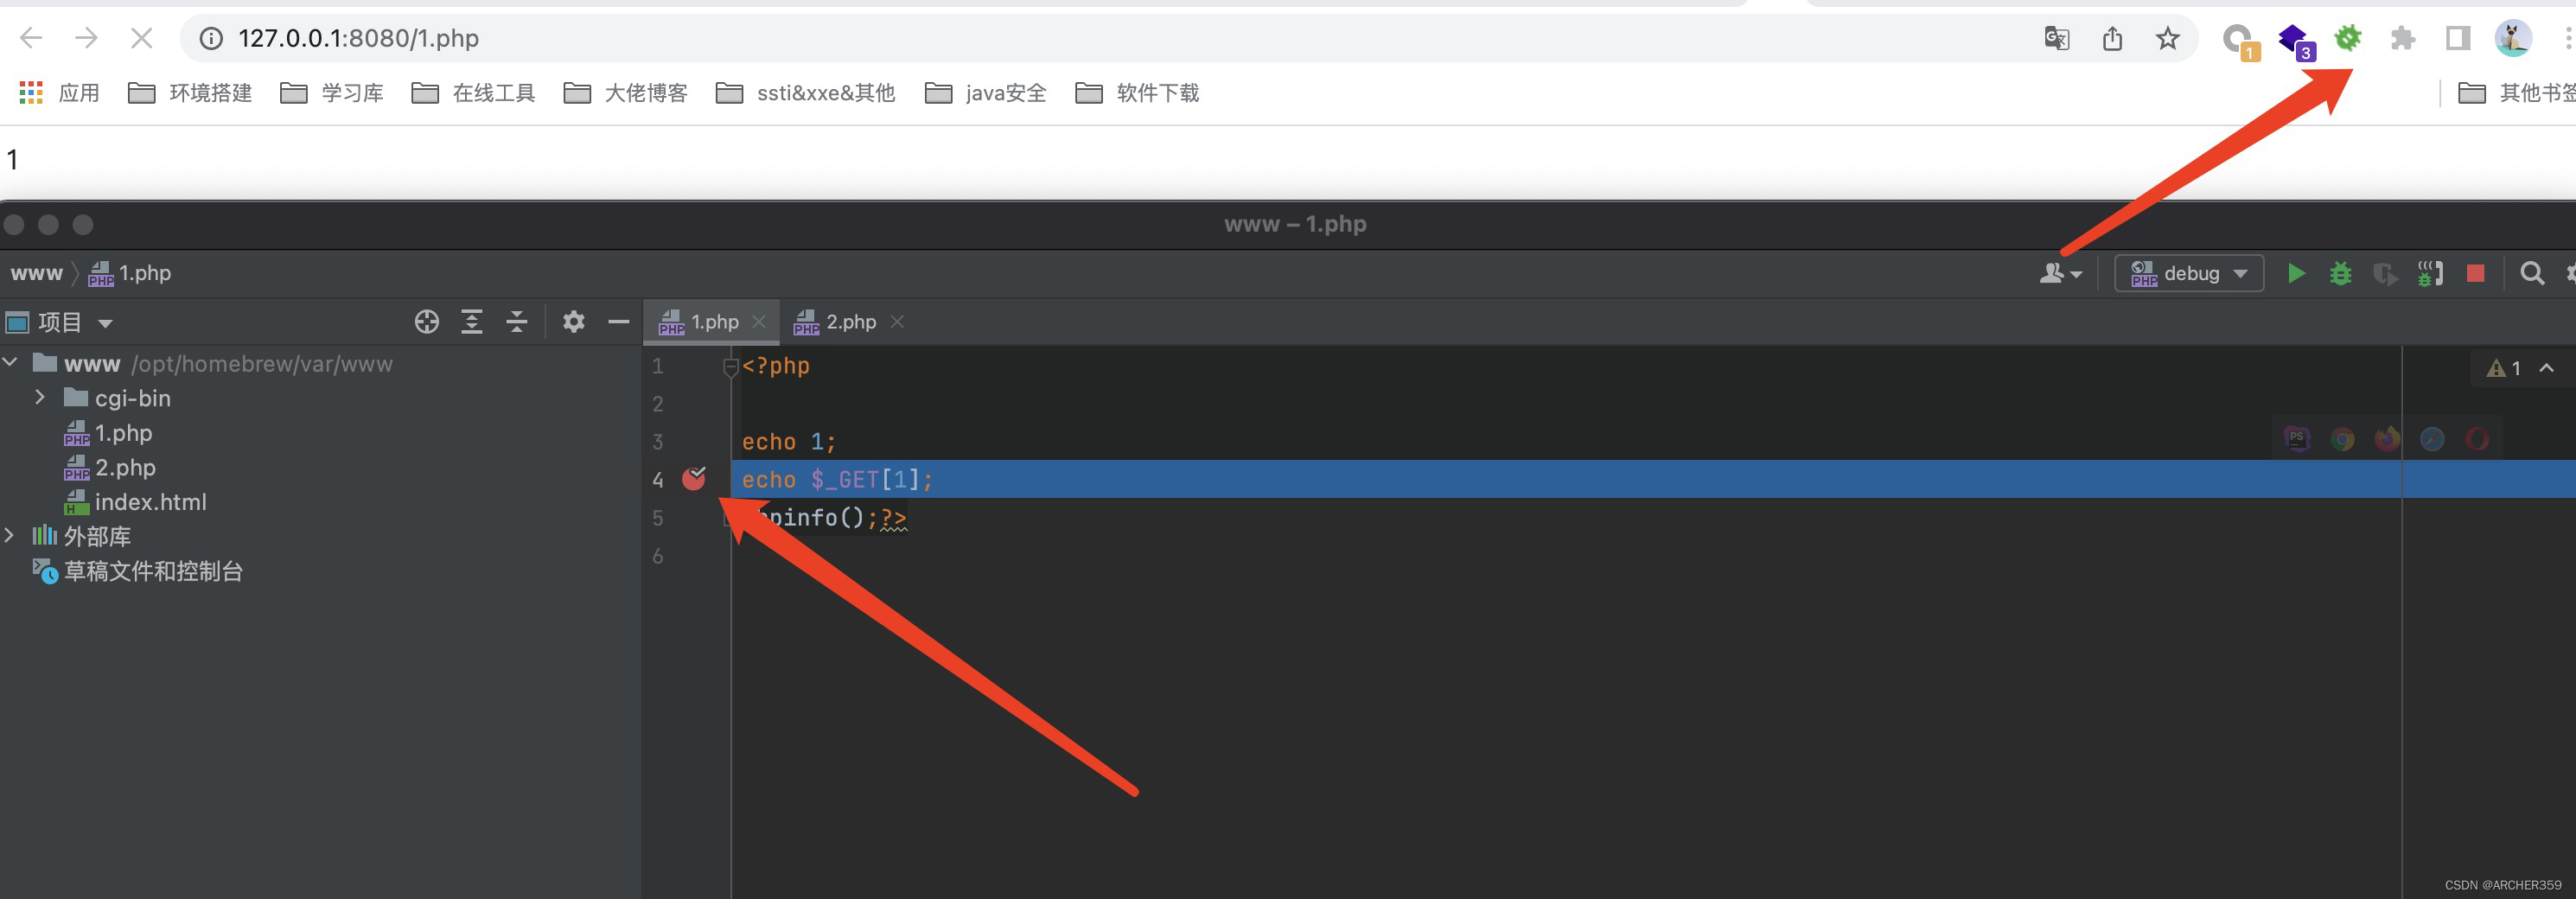
You can see the beginning of success debug .
Possible problems in the future
1.httpd Don't parse php
modify httpd.conf Add a row , According to oneself php Installation directory modification
LoadModule php7_module /opt/homebrew/Cellar/[email protected]/7.4.29/lib/httpd/modules/libphp7.so
If not, add another line AddType application/x-httpd-php .php try
2. No, php environment variable
Just edit this file , Then restart a terminal .

边栏推荐
- Reading the paper [sensor enlarged egocentric video captioning with dynamic modal attention]
- 往图片添加椒盐噪声或高斯噪声
- 产业金融3.0:“疏通血管”的金融科技
- Web Authentication API兼容版本信息
- Go 語言的 Context 詳解
- Flink SQL realizes reading and writing redis and dynamically generates hset key
- Flinksql read / write PgSQL
- 分布式事务介绍
- 4. Object mapping Mapster
- I didn't know it until I graduated -- the principle of HowNet duplication check and examples of weight reduction
猜你喜欢

C nullable type
Harmonyos practice - Introduction to development, analysis of atomized services

话说SQLyog欺骗了我!
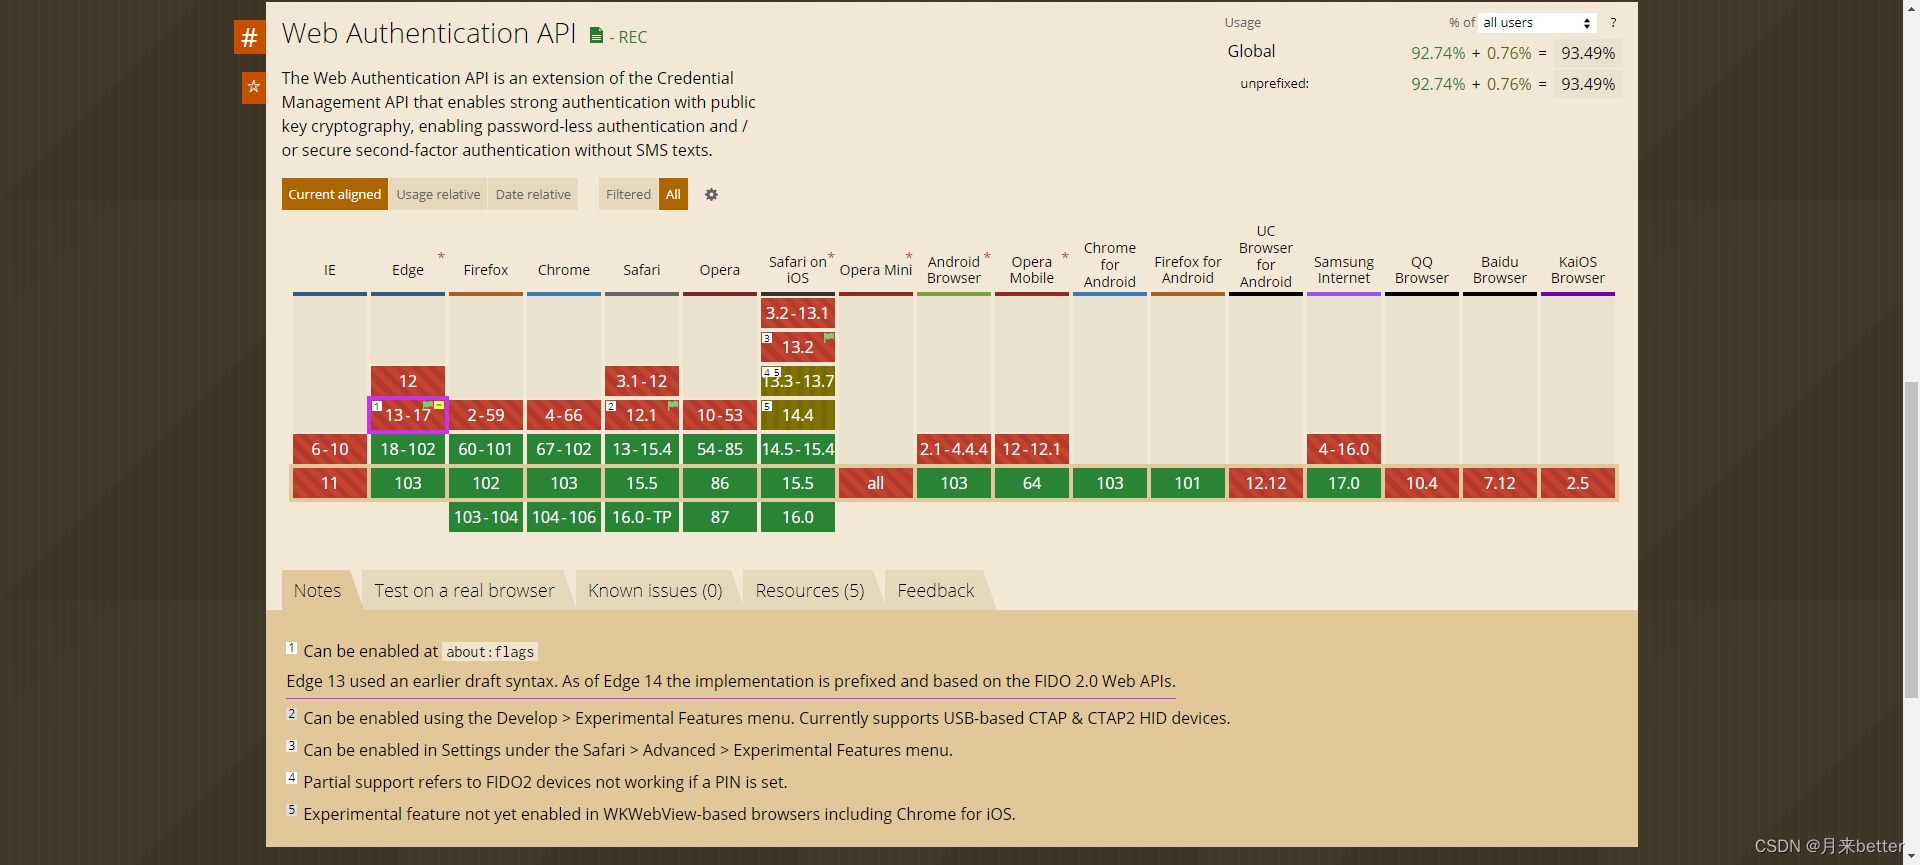
Web Authentication API兼容版本信息
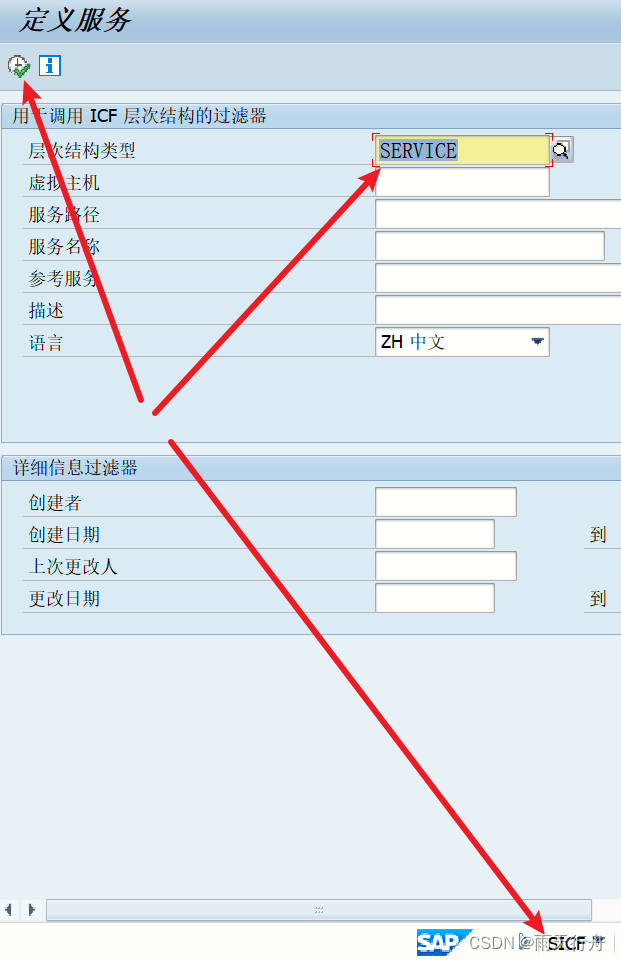
SAP webservice 测试出现404 Not found Service cannot be reached
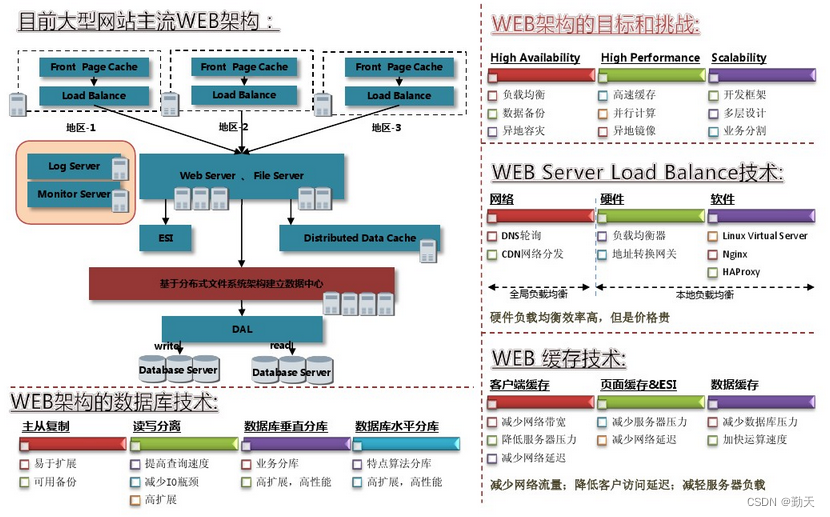
WEB架构设计过程
![R language [logic control] [mathematical operation]](/img/93/06a306561e3e7cb150d243541cc839.png)
R language [logic control] [mathematical operation]
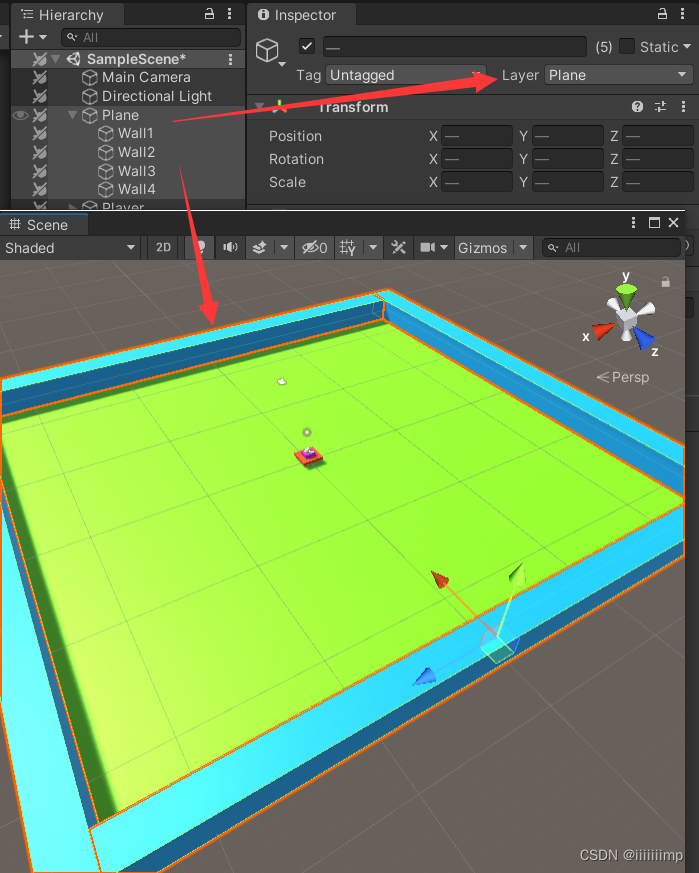
Unity keeps the camera behind and above the player
ForkJoin最全详解(从原理设计到使用图解)
![[paper reading] semi supervised left atrium segmentation with mutual consistency training](/img/d6/e6db0d76e81e49a83a30f8c1832f09.png)
[paper reading] semi supervised left atrium segmentation with mutual consistency training
随机推荐
Forkjoin is the most comprehensive and detailed explanation (from principle design to use diagram)
Explication contextuelle du langage Go
JVM the truth you need to know
【日常训练--腾讯精选50】292. Nim 游戏
Educational Codeforces Round 22 B. The Golden Age
软件测试面试技巧
Bat instruction processing details
nVisual网络可视化
pytorch_ 01 automatic derivation mechanism
Go 语言的 Context 详解
Flask 1.1.4 werkzeug1.0.1 analyse du code source: processus de démarrage
[shell] clean up nohup Out file
Common skills and understanding of SQL optimization
产业金融3.0:“疏通血管”的金融科技
成为资深IC设计工程师的十个阶段,现在的你在哪个阶段 ?
zabbix_ Get test database failed
原生小程序 之 input切換 text與password類型
Paper reading [open book video captioning with retrieve copy generate network]
【Shell】清理nohup.out文件
How much do you know about clothing ERP?