当前位置:网站首页>基于多元时间序列对高考预测分析案例
基于多元时间序列对高考预测分析案例
2022-07-02 13:31:00 【Python数据之道】
本文借助 ARIMA模型,通过对中国的往年高考录取率进行建模和预测,并验证和检验模型精度和可行性,来应用模型来估计未来的录取率,进一步得出2030年中国高考录取率的预测值。
本文系读者投稿
作者简介:理智,河北科技大学的大三学生,主攻深度学习。和大多数程序员一样,他是个乐观主义者,大量的时间都在调试代码,在调试中满怀希望,克服遇到的无数挫折。
01 数据来源
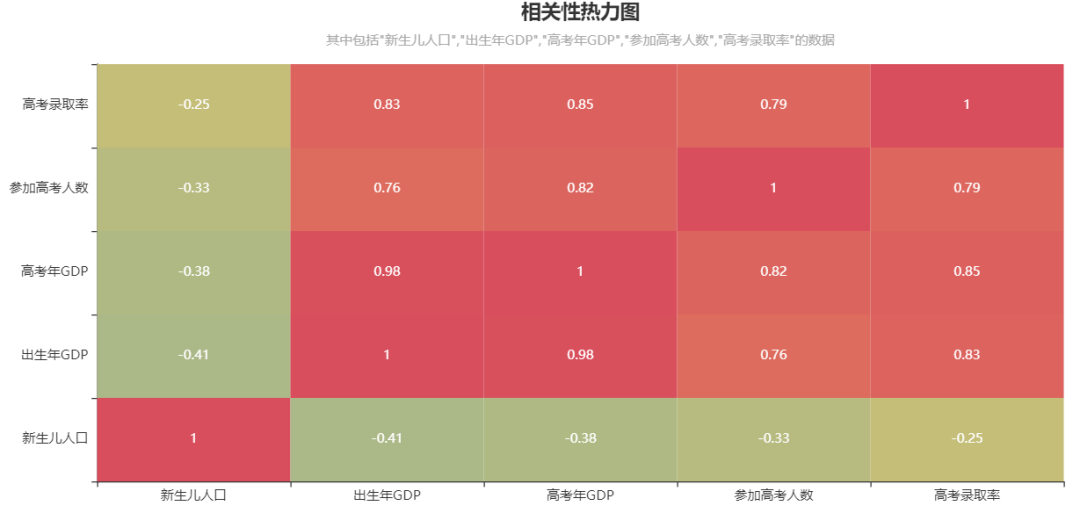
本文采用的数据来自世界银行官网(https://data.worldbank.org.cn/)的中国宏观经济数据集,现行版本的数据集共 45行12列,提供自1959年至2021年中国大陆12个指标每年的位置和数值。数据集格式采用国际通用惯例,每年的记录包含数值记录和比率记录,记录包含了时间(世界时)、人口(万人)、金额(亿美元)、比例等指标,数据集的结构如表1所示,图1画出了中国1949至2021年间的5个指标关系密切程度的热力图。
表 1 世界银行数据列表 (️滑动查看更多)| 出生年 | 高考年 | 新生儿人口(单位:万人) | 大学招生扩招政策,布尔变量,0表示无,1表示是 | 出生年GDP(亿美元) | 高考年GDP(亿美元) | 高考年GDP占世界比例(%) | 参加高考人数(单位:万人) | 高考录取人数(单位:万人) | 高考录取率 | 高等教育毛入学率 | 参加高考人数同比增长 |
|---|---|---|---|---|---|---|---|---|---|---|---|
| 1959 | 1977 | 1635 | 0 | 550 | 1749.4 | 2.39 | 570 | 27 | 4.74 | 1.65 | NaN |
| 1960 | 1978 | 1402 | 0 | 597.2 | 1495.4 | 1.73 | 610 | 40.2 | 6.59 | 2.87 | 0.07 |
| 1961 | 1979 | 949 | 0 | 500.6 | 1782.8 | 2.23 | 468 | 28 | 5.98 | 2.95 | -0.233 |
| 1962 | 1980 | 2451 | 0 | 472.1 | 1911.5 | 2.12 | 333 | 28 | 8.41 | 1.14 | -0.288 |
| 1963 | 1981 | 2934 | 0 | 507.1 | 1958.7 | 1.67 | 259 | 28 | 10.81 | 0.95 | -0.222 |
02 统计分析
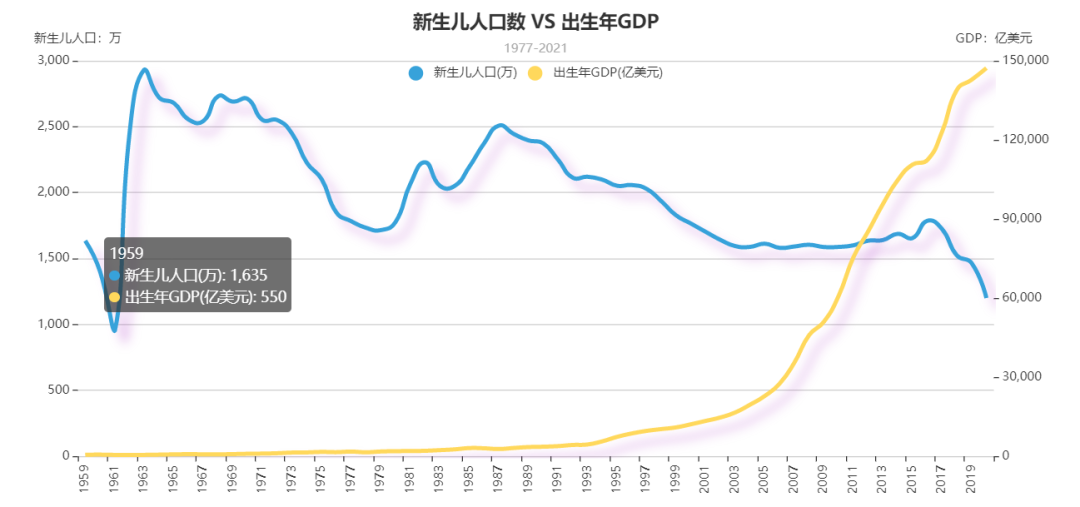
在1959年~2020年的61年间,新生儿数量有较大波动,1987年后新生儿数量呈单调递减趋势,且2016年后下降最为明显。
年GDP方面,呈上升趋势,1993年后变化较为明显。
整体上新生儿数量与出生年GDP无较为明显的关系,但存在部分区间负相关关系(1987年后)。
高考录取率与当年GDP如图3。两者均整体呈上升趋势,初步判断两者之间存在正相关关系。

高考参加人数及与之相关的情况:参加高考的人数逐年增加,但是参加高考的人数的年同比增长变化波动大,无明显特征,如图4。

观察高等教育毛入学率及当年GDP全球占比可知如图5。

毛入学率与全球GDP占比呈上升趋势,初步判断两者间存在正相关关系。
03 时间序列预测高考录取率
在此处,我们应用ARIMA模型进行高考录取率预测。这里ARIMA模型可以点击查看详情终于把时间序列预测ARIMA模型讲明白了。
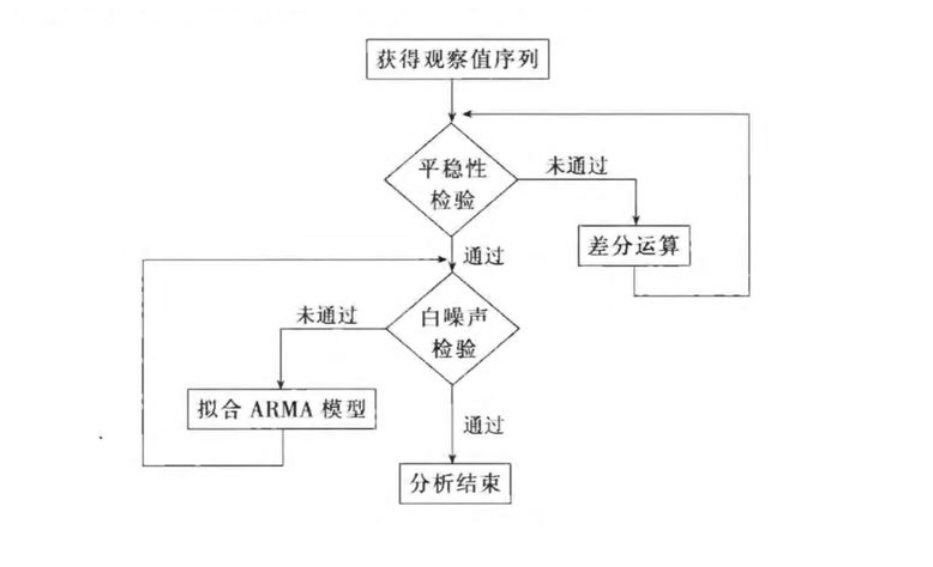
在应用ARIMA模型时需要先对观测序列进行平稳性以及白噪声检验,只有平稳非白噪声序列才具有观测价值,详细流程有:
3.1
目标数据的原始数据序列时序图及自相关图
import matplotlib.pyplot as plt
# 确定目标数据
tag = data['高考录取率']
from statsmodels.graphics.tsaplots import plot_acf
from statsmodels.graphics.tsaplots import plot_pacf
fig = plt.figure(figsize=(12,4))
ax1 = fig.add_subplot(121)
tag.plot()
plt.title('Sequence diagram')
ax2 = fig.add_subplot(122)
plot_acf(tag,ax=ax2) # 自相关图
plt.show()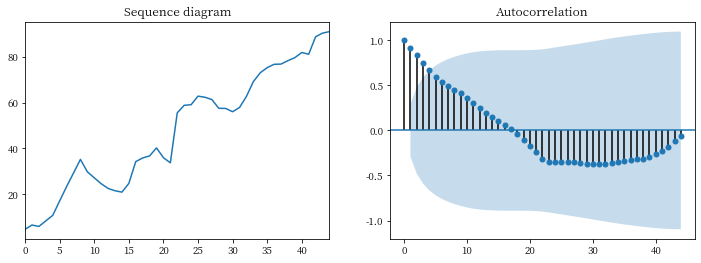
观察时序图可知:
由于该序列有明显的单调递增趋势,初步判断其为非平稳序列,且自相关图显示自相关系数长期大于0,说明序列间有很强的长期相关性。
结合上述流程,需要先对该序列进行平稳性检验。
3.2 ADF检验(单位根检验)
# 平稳性检测
from statsmodels.tsa.stattools import adfuller as ADF
ADF(tag)
(-0.5482617125015317,
0.882249553115714,
0,
44,
{'1%': -3.5885733964124715,
'5%': -2.929885661157025,
'10%': -2.6031845661157025},
203.98252176030874)观察结果,P值为0.882249553115714,显著大于0.05。
最终将该序列判断为非平稳序列。
由于最终判断该序列为非平稳序列,因此需要对其进行差分处理。
3.3 差分处理
tag_diff = tag.diff().dropna()
tag_diff.plot()
plt.title('First order sequence diagram')
plt.show()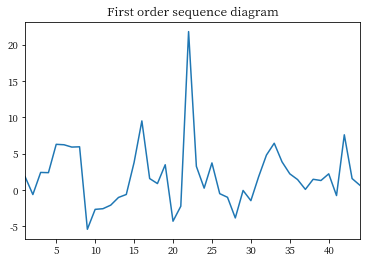
从上图可以看出,一阶差分后的数据增减趋势较为平稳。但是依据最优化及准确性原则,需要再进行二阶差分处理。
## 二阶
tag_diff2 = tag_diff.diff().dropna()
tag_diff2.plot()
plt.title('Second order sequence diagram')
plt.show()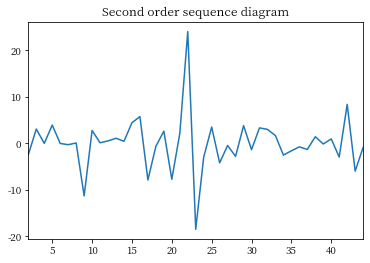
理论上说,多阶的差分可以更好的剔除序列中的不确定因素,
但是差分的同时也会使得原序列损失一定的数据,所以差分的阶数应该适当。
在本文中,二阶差分过后,序列趋势较为平稳,接下来对二阶差分后的序列进行自相关及偏自相关图的绘制分析。
# 偏自相关
fig = plt.figure(figsize=(12,4))
ax1 = fig.add_subplot(121)
plot_acf(tag_diff,ax=ax1)
ax2 = fig.add_subplot(122)
plot_pacf(tag_diff,ax=ax2)
plt.show()
ADF(tag_diff2)(-7.7836768644929695,
8.2881029271227e-12,
1,
41,
{'1%': -3.60098336718852,
'5%': -2.9351348158036012,
'10%': -2.6059629803688282},
202.9415785772855)观察两图结果,
结果显示,二阶差分之后序列的自相关图有较强的短期相关性,且 ADF 检验中 p值为 8.2881029271227e-12,显著小于0.05,所以二阶差分后的序列是平稳序列。
结合流程图,平稳性检验后进行白噪声检验。对于白噪声相关内容可参见:时间序列预测中如何检测随机游走和白噪声
3.4 白噪声检验
检验结果如下
# 白噪声检验
from statsmodels.stats.diagnostic import acorr_ljungbox
acorr_ljungbox(tag_diff2,lags=[6,12,24])
(array([14.16785, 16.24145, 22.69118]),
array([0.02781, 0.18042, 0.53808]))lbvalue: QLB检验统计量
pvalue: QLB检验统计量下对应的P值此时查看P值,也就是第二行数据(各列分别为延迟6、12、24阶时的检验结果):
当 lags=6 时,也就是延迟 6阶时 P值为 0.02781636 < 0.05,此时可判断该序列为非白噪声序列,具有观测价值。
3.5 应用ARIMA模型
from statsmodels.tsa.arima_model import ARIMA
# 一般阶数不超过length/10
pmax = int(len(tag_diff)/10)
qmax = int(len(tag_diff)/10)
bic_matrix = []

for p in range(pmax+1):
   tmp = []

for q in range(qmax+1):
   try:
       tmp.append(ARIMA(tag, (p,1,q)).fit().bic)
   except:
       tmp.append(None)
   bic_matrix.append(tmp)
bic_matrix = pd.DataFrame(bic_matrix)
p,q = bic_matrix.stack().idxmin()  ## 得到最小p、q值
## 由于对原视数据进行了二阶差分,所以此处的d值为 2
model = ARIMA(tag, (p,2,q)).fit()
model.summary2()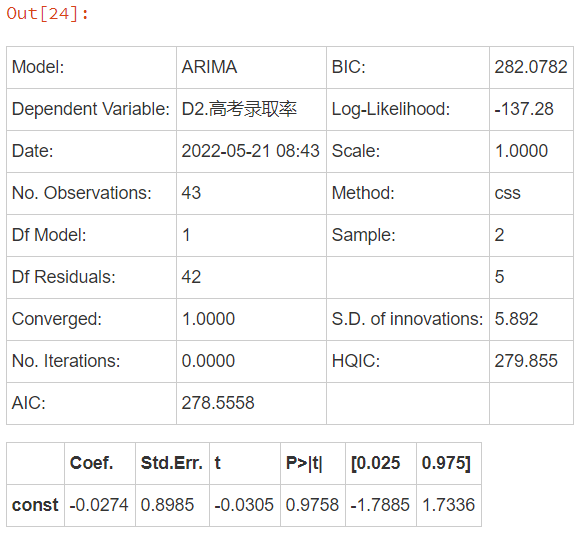
预测2030年的高考录取率
print('预测2030年的高考录取率为 ' +
      str(model.forecast(9)[0][-1]) + '%')
预测2030年的高考录取率为 95.79511627906977%print('预测2030年的高考录取率为 ' +
str(model.forecast(9)[0][-1]) + '%')预测2050年的高考录取率为 98.79511627906977%04 结论
ARIMA是一种非常流行的时间序列统计方法,它是差分整合移动平均自回归模型,分别是自回归(AR)项指的是差分序列的滞后,移动平均(MA)项是指误差的滞后,而I是用于使时间序列平稳的差分数,描述了数据点的相关性,并考虑数值之间的差异。
本文借助ARIMA模型,通过对中国的往年高考录取率进行建模和预测,并验证和检验模型精度和可行性,来应用模型来估计未来的录取率,进一步得出了2030年中国高考录取率的预测值为 95.795%。(仅供学习参考)
采用差分整合移动平均自回归模型挖掘影响高考录取率的关键因素,然而差分整合移动平均自回归模型需要各指标与高考的相关关系,故可采用相关系数R的性质,得出各指标的相关性,建立ARIMA模型需要先对观测序列进行平稳性以及白噪声检验,只有平稳非白噪声序列才具有观测价值,最终预测高考录取率。
边栏推荐
- TypeScript数组乱序输出
- 大厂面试总结大全
- LeetCode 6. Zigzag transformation (n-shaped transformation)
- SQL solves the problem of continuous login deformation holiday filtering
- PyC file decompile
- 一文读懂AGV的关键技术——激光SLAM与视觉SLAM的区别
- Yyds dry inventory method of deleting expired documents in batch
- Exploration and practice of integration of streaming and wholesale in jd.com
- Trigger: MySQL implements adding or deleting a piece of data in one table and adding another table at the same time
- 隐私计算技术创新及产业实践研讨会:学习
猜你喜欢
Unity使用UGUI设置一个简单多级水平方向下拉菜单(不需要代码)
How to solve the failure of printer driver installation of computer equipment

What is normal distribution? What is the 28 law?
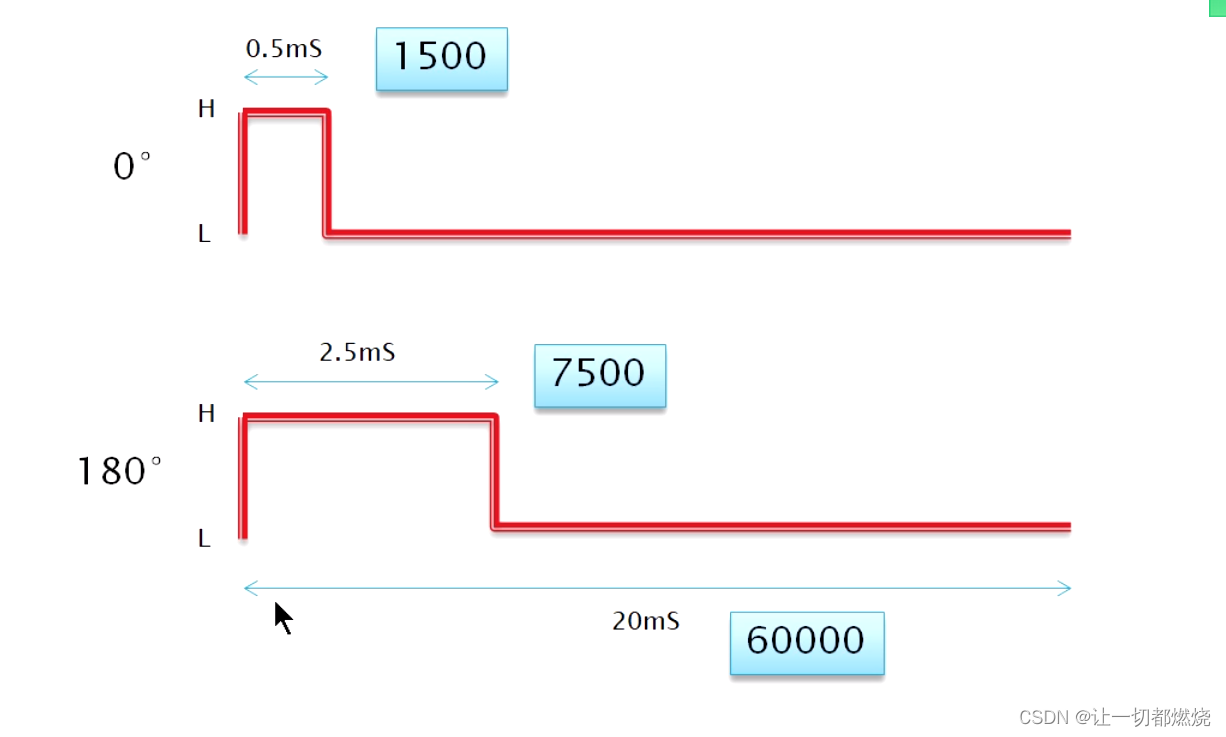
PWM控制舵机

mysql数据库mysqldump为啥没有创建数据库的语句
电脑设备打印机驱动安装失败如何解决

忆当年高考|成为程序员的你,后悔了吗?

总结|机器视觉中三大坐标系及其相互关系
![OSPF - route aggregation [(summary) including configuration commands] | address summary calculation method - detailed explanation](/img/8b/36be3191a7d71f4a8c8181eaed8417.jpg)
OSPF - route aggregation [(summary) including configuration commands] | address summary calculation method - detailed explanation

曆史上的今天:支付寶推出條碼支付;分時系統之父誕生;世界上第一支電視廣告...
随机推荐
ROW_ NUMBER()、RANK()、DENSE_ Rank difference
618深度複盤:海爾智家的制勝方法論
Foreign enterprise executives, continuous entrepreneurs, yoga and skiing masters, and a program life of continuous iteration and reconstruction
PCL point cloud image transformation
La boîte de connexion du hub de l'unit é devient trop étroite pour se connecter
请问怎么在oracle视图中使用stustr函数
Cloud native cicd framework: Tekton
Multi task prompt learning: how to train a large language model?
[fluent] dart data type number type (DART file creation | num type | int type | double type | num related API)
618深度复盘:海尔智家的制胜方法论
Global and Chinese market of oil analyzers 2022-2028: Research Report on technology, participants, trends, market size and share
False summer vacation
Mysql database mysqldump why there is no statement to create a database
Global and Chinese market of discharge machines 2022-2028: Research Report on technology, participants, trends, market size and share
Headline | Asian control technology products are selected in the textile and clothing industry digital transformation solution key promotion directory of Textile Federation
[North Asia data recovery] data recovery case of raid crash caused by hard disk disconnection during data synchronization of hot spare disk of RAID5 disk array
学生选课系统(山东农业大学课程设计)
AcWing 300. Task arrangement
618 deep resumption: Haier Zhijia's winning methodology
机器学习-感知机模型